
In a year defined by AI breakthroughs, colossal layoffs, and serious cost-cutting across industries, sales, market cap, and headcount are no longer the epitome of power and success. Since AI and automation have increasingly replaced traditional roles, companies are now able to achieve notable profits with fewer employees, transforming the rules of operational efficiency.
Companies like Apple, which surpasses $2 million in revenue per employee, and NVIDIA, which took advantage of the AI boom to reach record profits, show how a lean, high-performing workforce can become a company’s greatest asset. Meanwhile, firms such as Meta and Goldman Sachs have taken a different route – streamlining operations and cutting headcount to protect margins and boost efficiency, even in the face of weaker demand.
While market capitalisation still offers valuable insight into a company’s impact, the team at BestBrokers decided to look into the two other most telling metrics of true business performance: revenue and net income per employee. We gathered financial data on the 235 largest companies by market capitalisation as of April 7, 2025, sourced from Companies Market Cap. To work out the profit and revenue per employee, we did extensive research into the official annual reports published by the companies and divided each company’s annual revenue and net income by the number of its staff. We then ranked the firms based on this metric.
The World’s Most Valuable Companies Ranked by Profit Per Employee
Net income per employee (NIPE) is a powerful indicator of efficiency, which shows how effectively a company can convert its human capital into profit. It offers valuable insight, especially for cross-industry comparisons where revenue models may differ but profitability remains the central objective. By using annual net income, the metric depicts performance across the full economic cycle, avoiding fluctuations caused by diverse seasonal factors like holidays or product launches that often influence quarterly results.
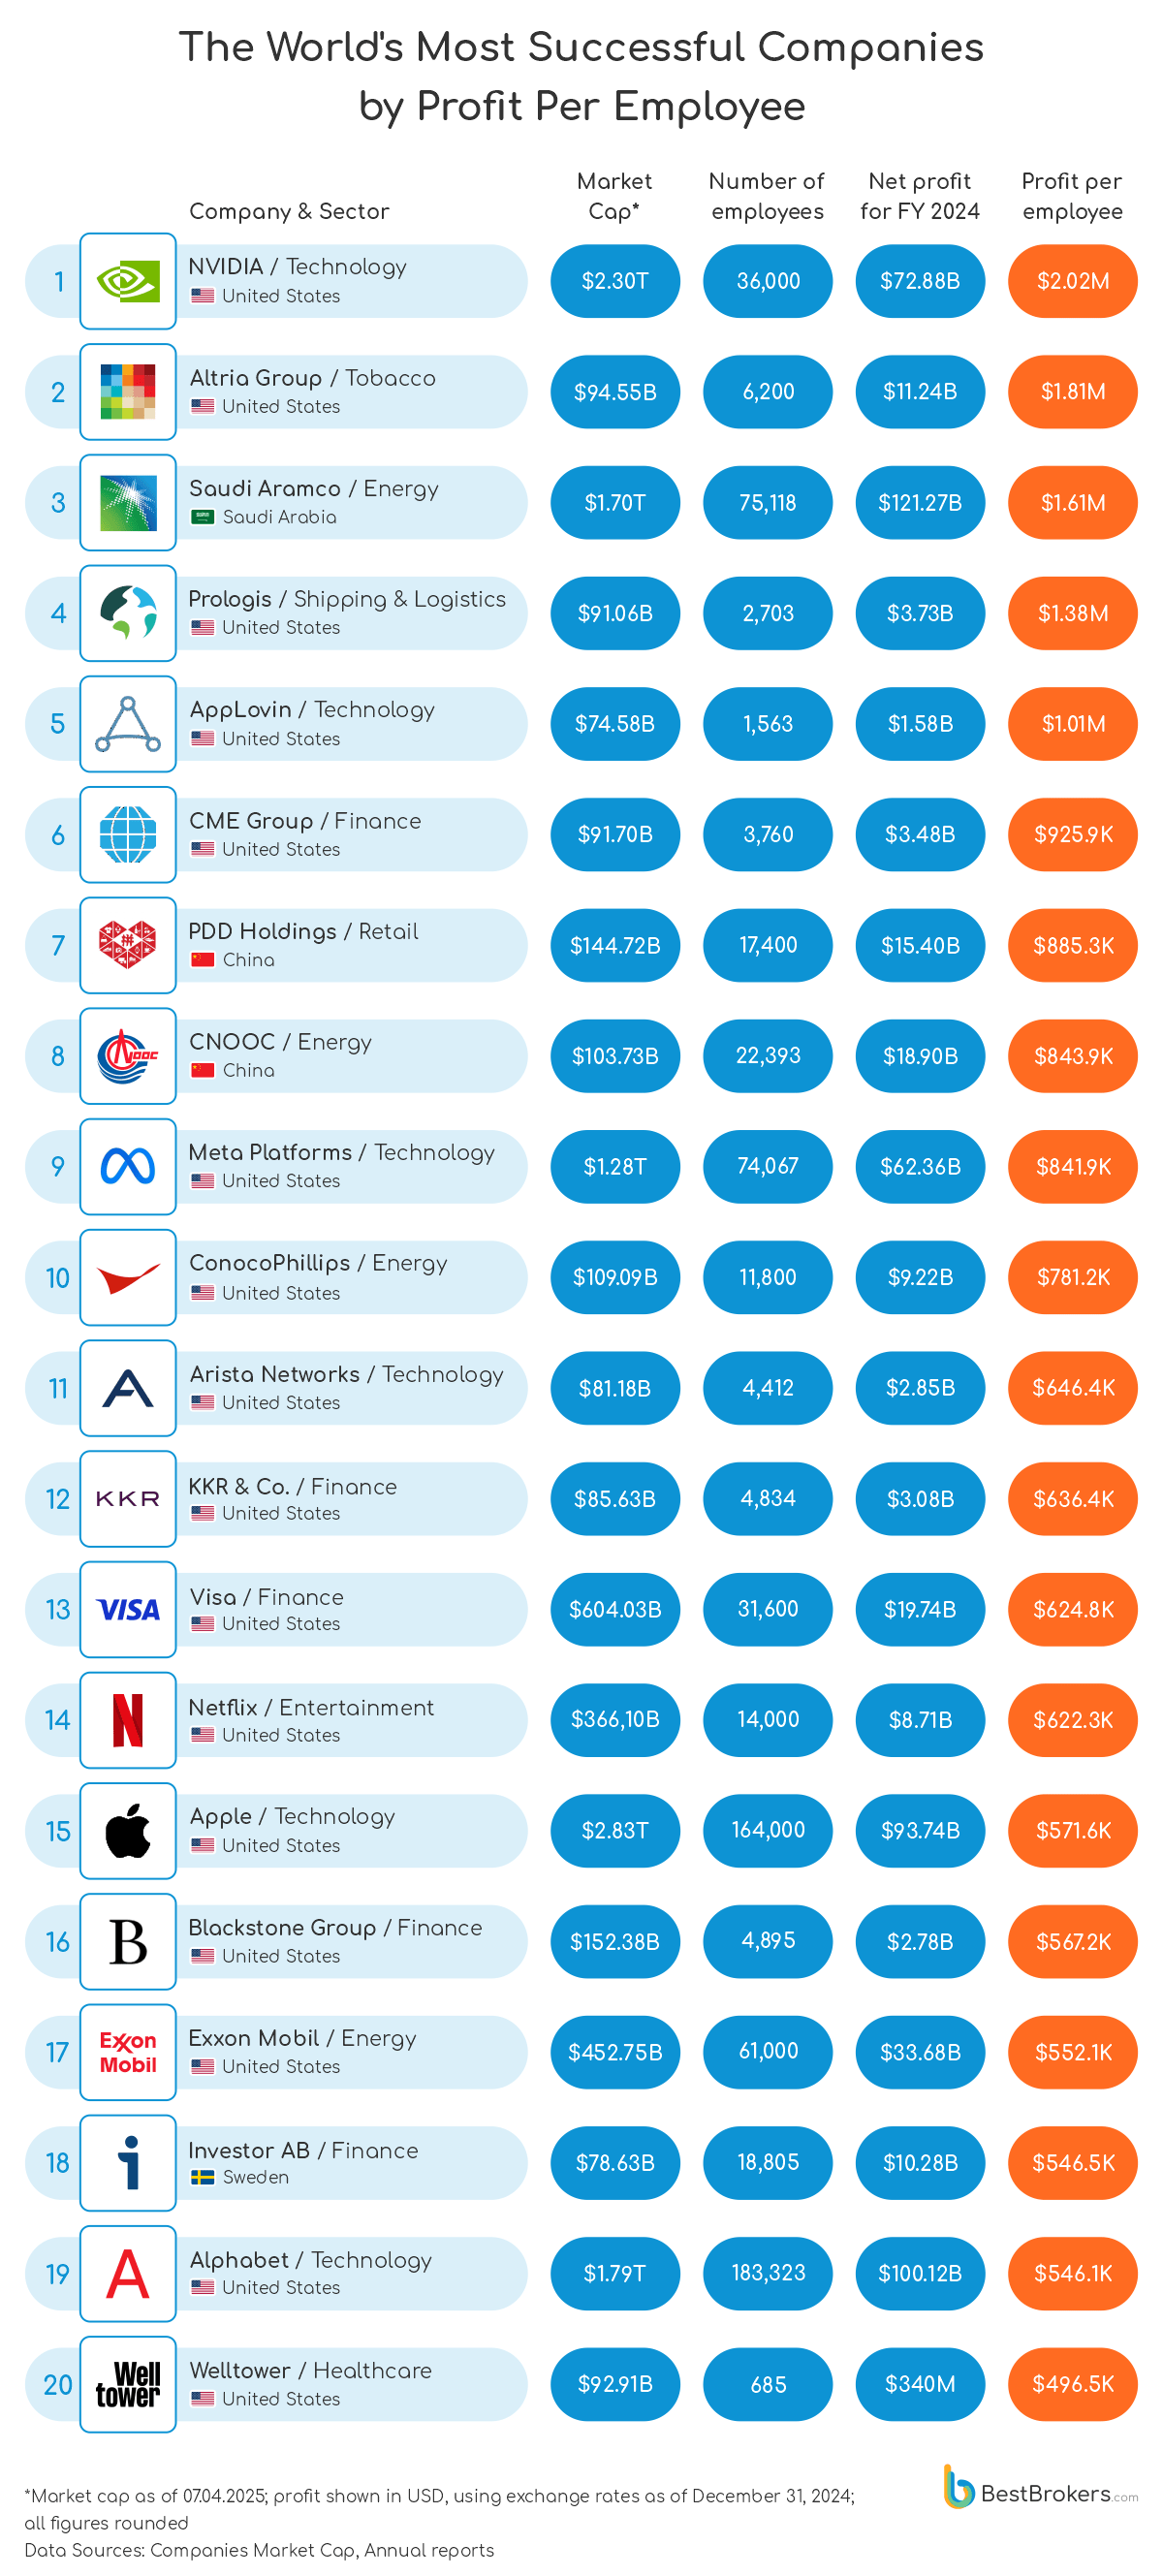
Collectively, the top 20 global companies with the highest profit per employee, according to our research, generated a tremendous net income of approximately $535.36 billion. With a combined workforce exceeding 738,000, the average profit per employee stands at an impressive $806,111. Of the 20 top-performing firms on our list, 80% are headquartered in the United States, China contributes two companies, while Sweden and Saudi Arabia each have one representative.
NVIDIA, the leading AI chip maker, tops the ranking with a net income of $2.024 million per employee, despite ranking third in market capitalisation at $2.301 trillion. While it does not report the highest total annual net income among the companies surveyed, its relatively lean workforce gives it a significant advantage in profitability per employee. Despite its global reach and influence, NVIDIA maintains a notably smaller headcount than many tech giants, including Microsoft, Alphabet (Google), and Apple. At the end of 2024, the company had a total of 36,000 employees – more than six times fewer than Microsoft, which reported a workforce of 228,000 in the same period. As a result of the high demand for its chips that power generative AI, cloud computing, and machine learning, NVIDIA has achieved extraordinary profit growth while keeping its team compact – securing its position as the clear leader in net income per employee.
Altria Group, a dominant force in the tobacco industry, claims the second spot on the list with an impressive $1.816 million in net income per employee, supported by a workforce of just 6,200 employees in 2024. The company reported a net profit of $11.264 billion for the fiscal year ending December 31st, 2024. Close behind is the leader in 2023, the world’s largest oil producer, Saudi Aramco, with a net profit of $1.61 million per employee.
Prologis, a prominent logistics real estate giant based in San Francisco, California, ranks fourth, achieving $1.378 million of net income per employee, with a workforce of 2,703. Next is AppLovin, a mobile app technology firm, with $1.008 million in net income per employee. While neither of these companies leads in market capitalisation or annual revenue, their smaller headcounts earn them the top positions in terms of net income per employee. On the other hand, Temu owner PDD Holdings (Pinduoduo), while employing a larger team of 17,400, succeeds in maintaining $885,200 in net income per employee, portraying its ability to reach significant profits through its broad e-commerce platform.
Unfortunately, not all companies in our analysis have experienced the same level of success. Out of the 241 companies we reviewed, seven reported a loss per employee. For instance, Vertex Pharmaceuticals, a leader in last year’s rankings for profit per employee, now records a loss of -$87,803 per worker, likely due to increased investments in research and development. The biggest losses are visible with MicroStrategy, which reports a loss of -$760,535 per employee, and Bristol-Myers Squibb, with a loss of -$262,405 per employee. In addition, aerospace giants Boeing and Safran also struggled with losses, at -$69,041 and -$6,941 per employee, which might be a result of supply chain disruptions and economic instability.
Tech and Financial Companies Lead in Profit Per Staff Member
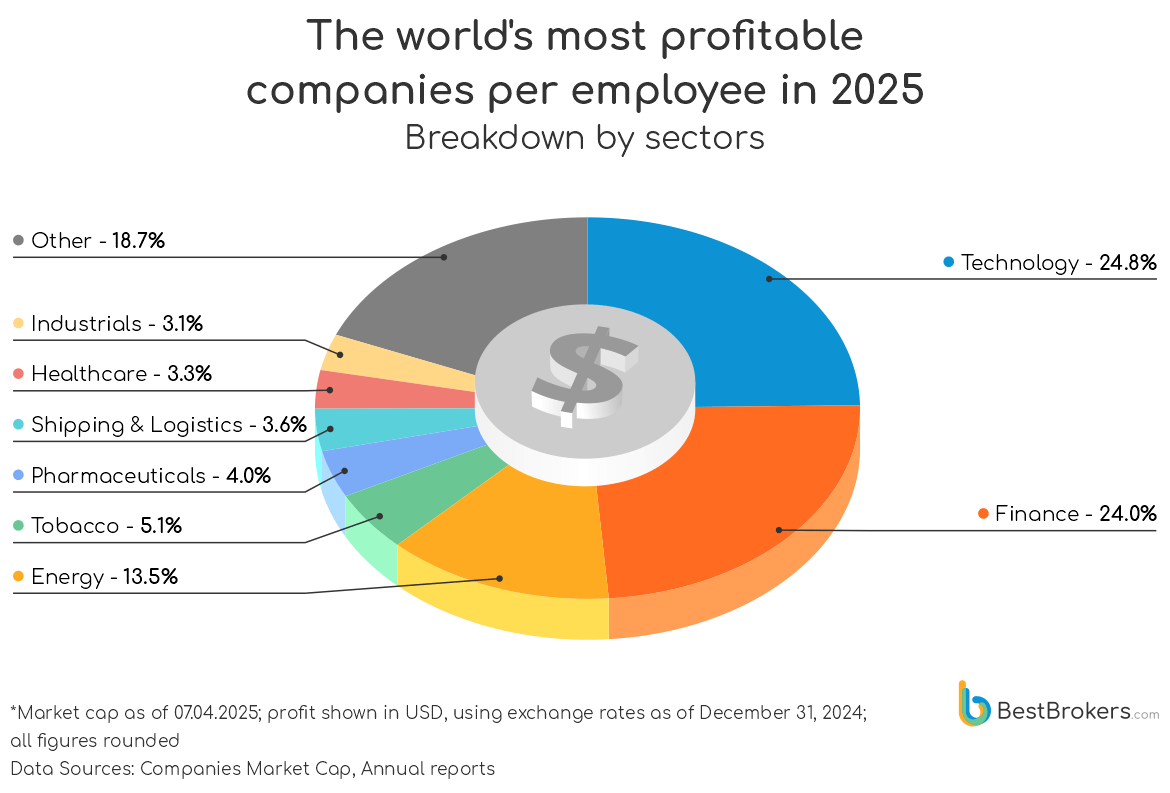
Globally, technology and financial firms lead the rankings for net profit per employee which is a reflection of their ability to generate substantial profits with relatively smaller teams. Collectively, the 45 tech companies on our list report a total of $9.61 million in net income per employee, averaging $213,515 per employee. Meanwhile, the 54 financial firms produce $9.31 million in total net income per employee, resulting in a sector average of $172,418. Both sectors are heavily reliant on intellectual capital and software-driven models, which allows them to grow their income without a proportional increase in headcount. Tech firms, in particular, benefit from the global reach of platforms and AI technologies, while financial institutions avail themselves of automation, investment income, and fee-based services to achieve high profitability with compact workforces.
An interesting observation emerges in the Shipping & Logistics and Tobacco sectors, both of which achieve high average profits per employee despite being represented by only a few companies. The Shipping & Logistics sector includes just two firms (Prologis and United Parcel Service) among the 235 companies analysed, yet it records a substantial collective net profit of $1.39 million per employee and an average of $695,089. Similarly, the Tobacco sector, with only three representatives (Altria Group, British American Tobacco, and Philip Morris International), generates an average of $658,670 in net profit per employee.
American Corporations Making the Highest Profit Per Employee
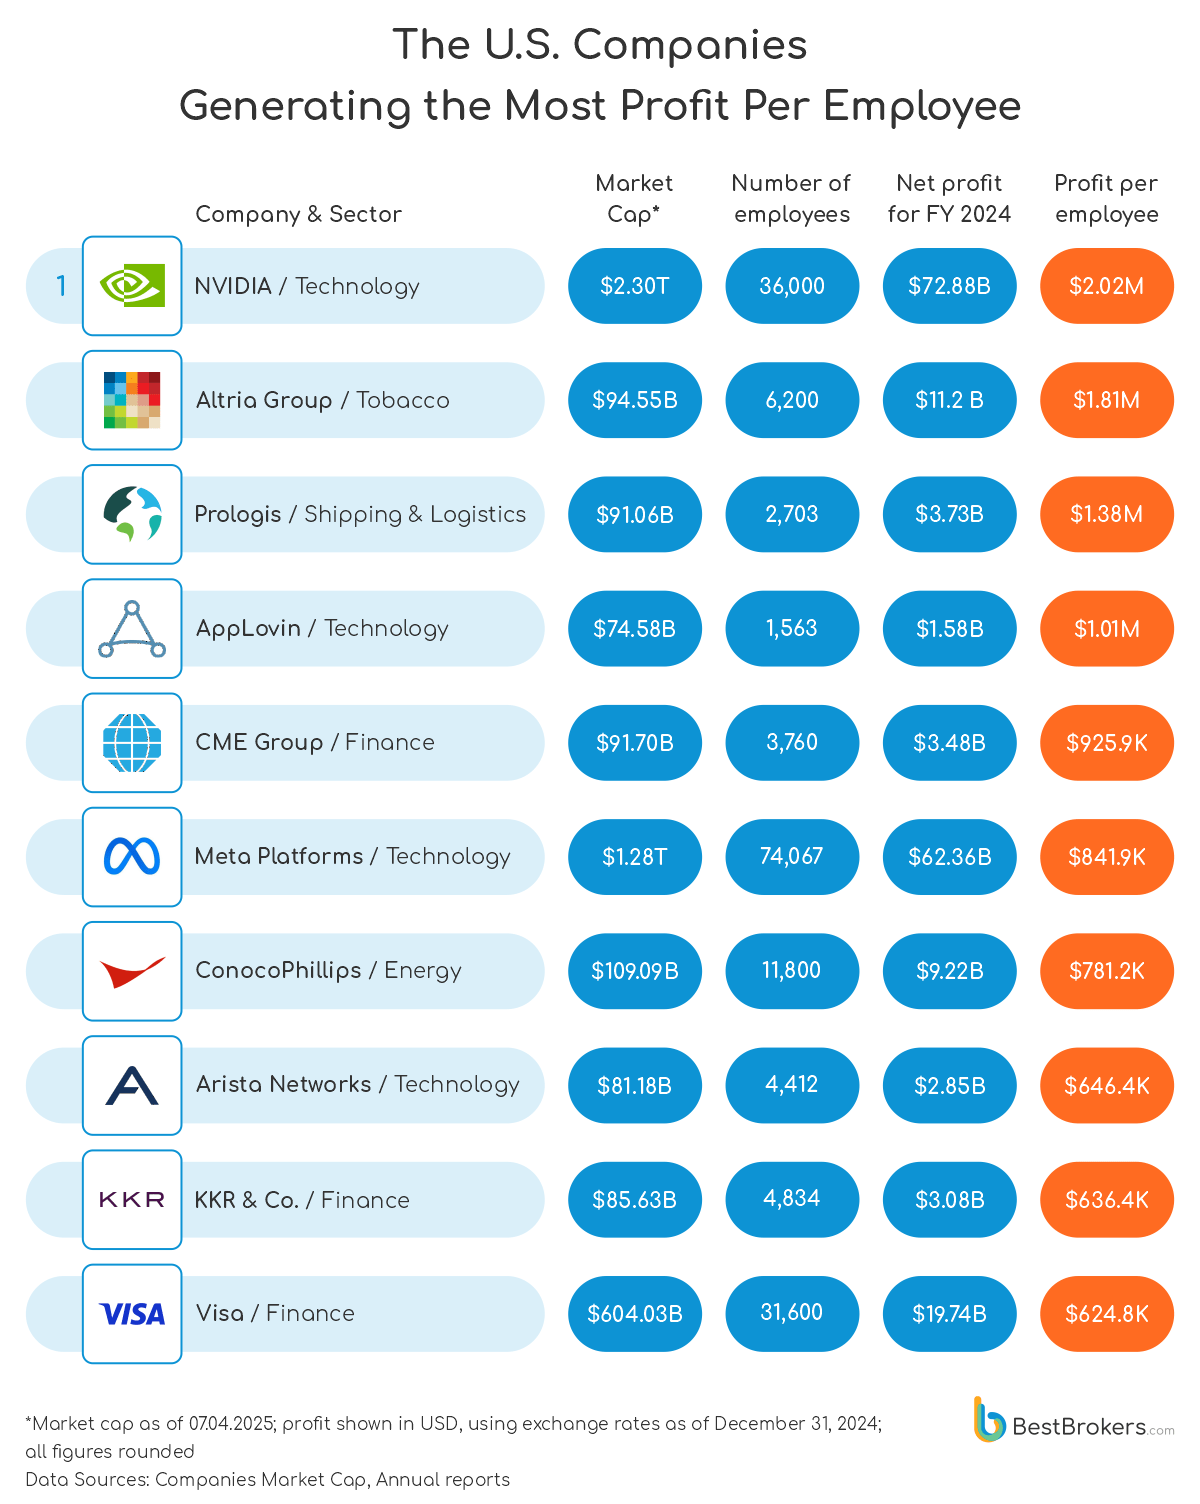
The most successful American companies once again come predominantly from the Technology and Finance sectors, with all of them also ranking among the top performers globally. Saudi Aramco and the two Chinese companies on the list are the only ones preventing the United States from claiming all the top 10 positions in terms of net profit per employee. Interestingly, while ConocoPhillips held the second spot in our 2023 rankings, it does not appear on the 2024 list. This may be attributed to a decline in its annual net income, $9.22 billion in 2024 compared to $10.9 billion the previous year, together with a rise in its headcount, from 9,900 in 2023 to 11,800 in 2024.
UK Companies with the Most Profit Per Worker
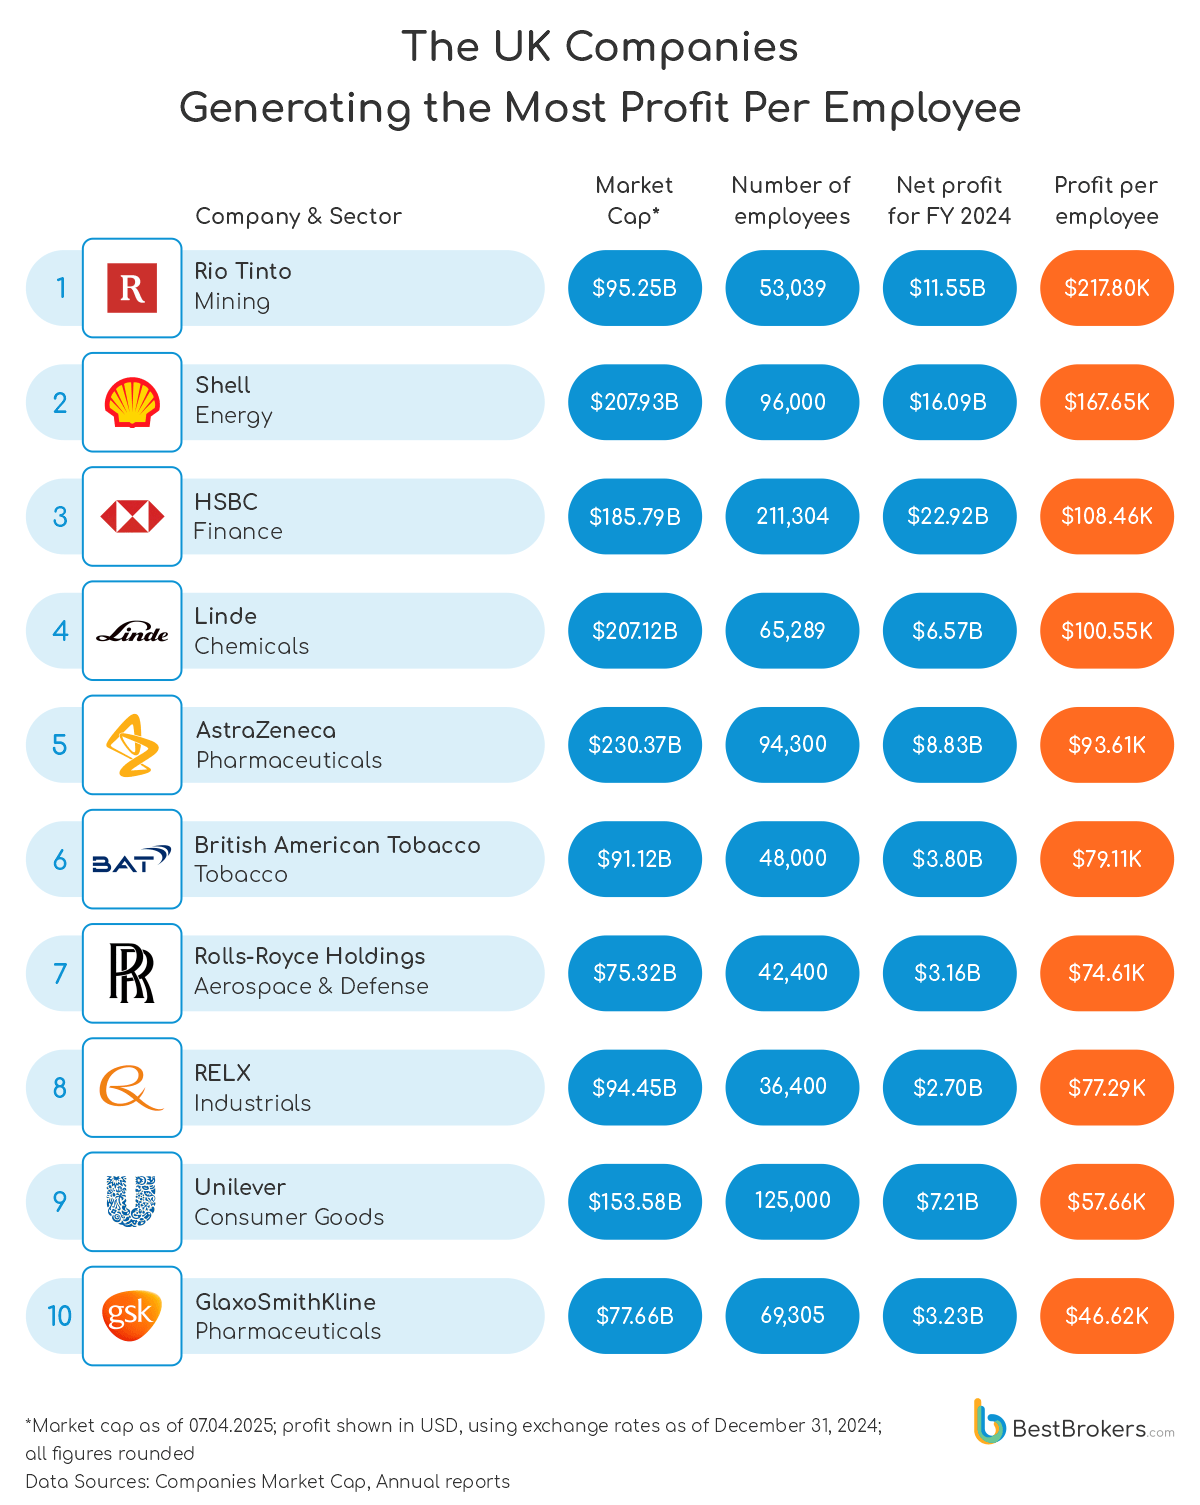
In the UK, the leading metals and mining giant Rio Tinto stands out as the most profitable company per employee, generating $217,802 in net income per worker. It is followed by Shell, the world’s second-largest investor-owned oil and gas company, with $167,646 in profit per employee. The Financial sector takes third place this time with HSBC, which records $108,455 per employee—an impressive figure given its large workforce of 211,304, compared to 53,039 at Rio Tinto and 96,000 at Shell.
European Companies Leading in Profit Per Employee
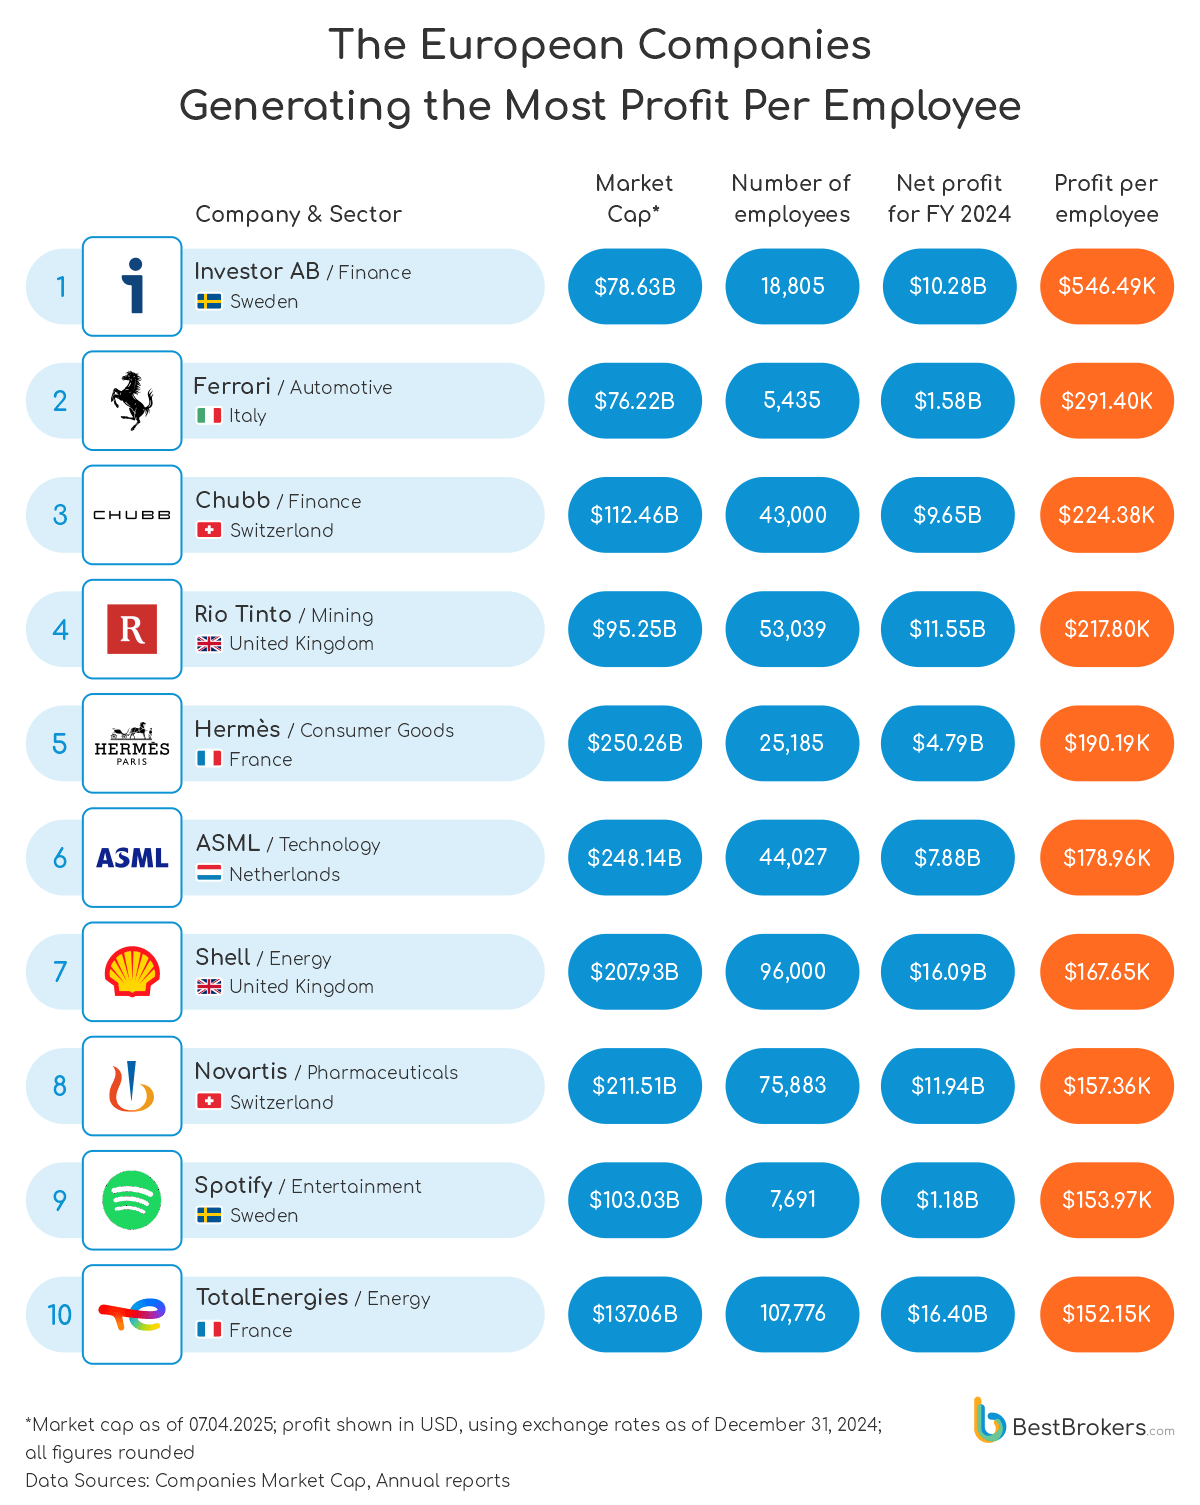
Investor AB, Sweden’s leading investment firm, tops the European rankings with a profit of $546,492 per employee and a workforce of 18,805. The company also led the chart last year, though it experienced a decrease in net profit – from $12.26 billion in 2023 to $10.27 billion in 2024. Meanwhile, its headcount rose slightly from 18,565 to 18,805. Sweden is also represented by Spotify, which ranks ninth on the list. Other European countries with two entries each include Switzerland (Chubb and Novartis), the United Kingdom (Rio Tinto and Shell), and France (Hermès and TotalEnergies).
The World’s Most Successful Companies Ranked by Revenue Per Employee
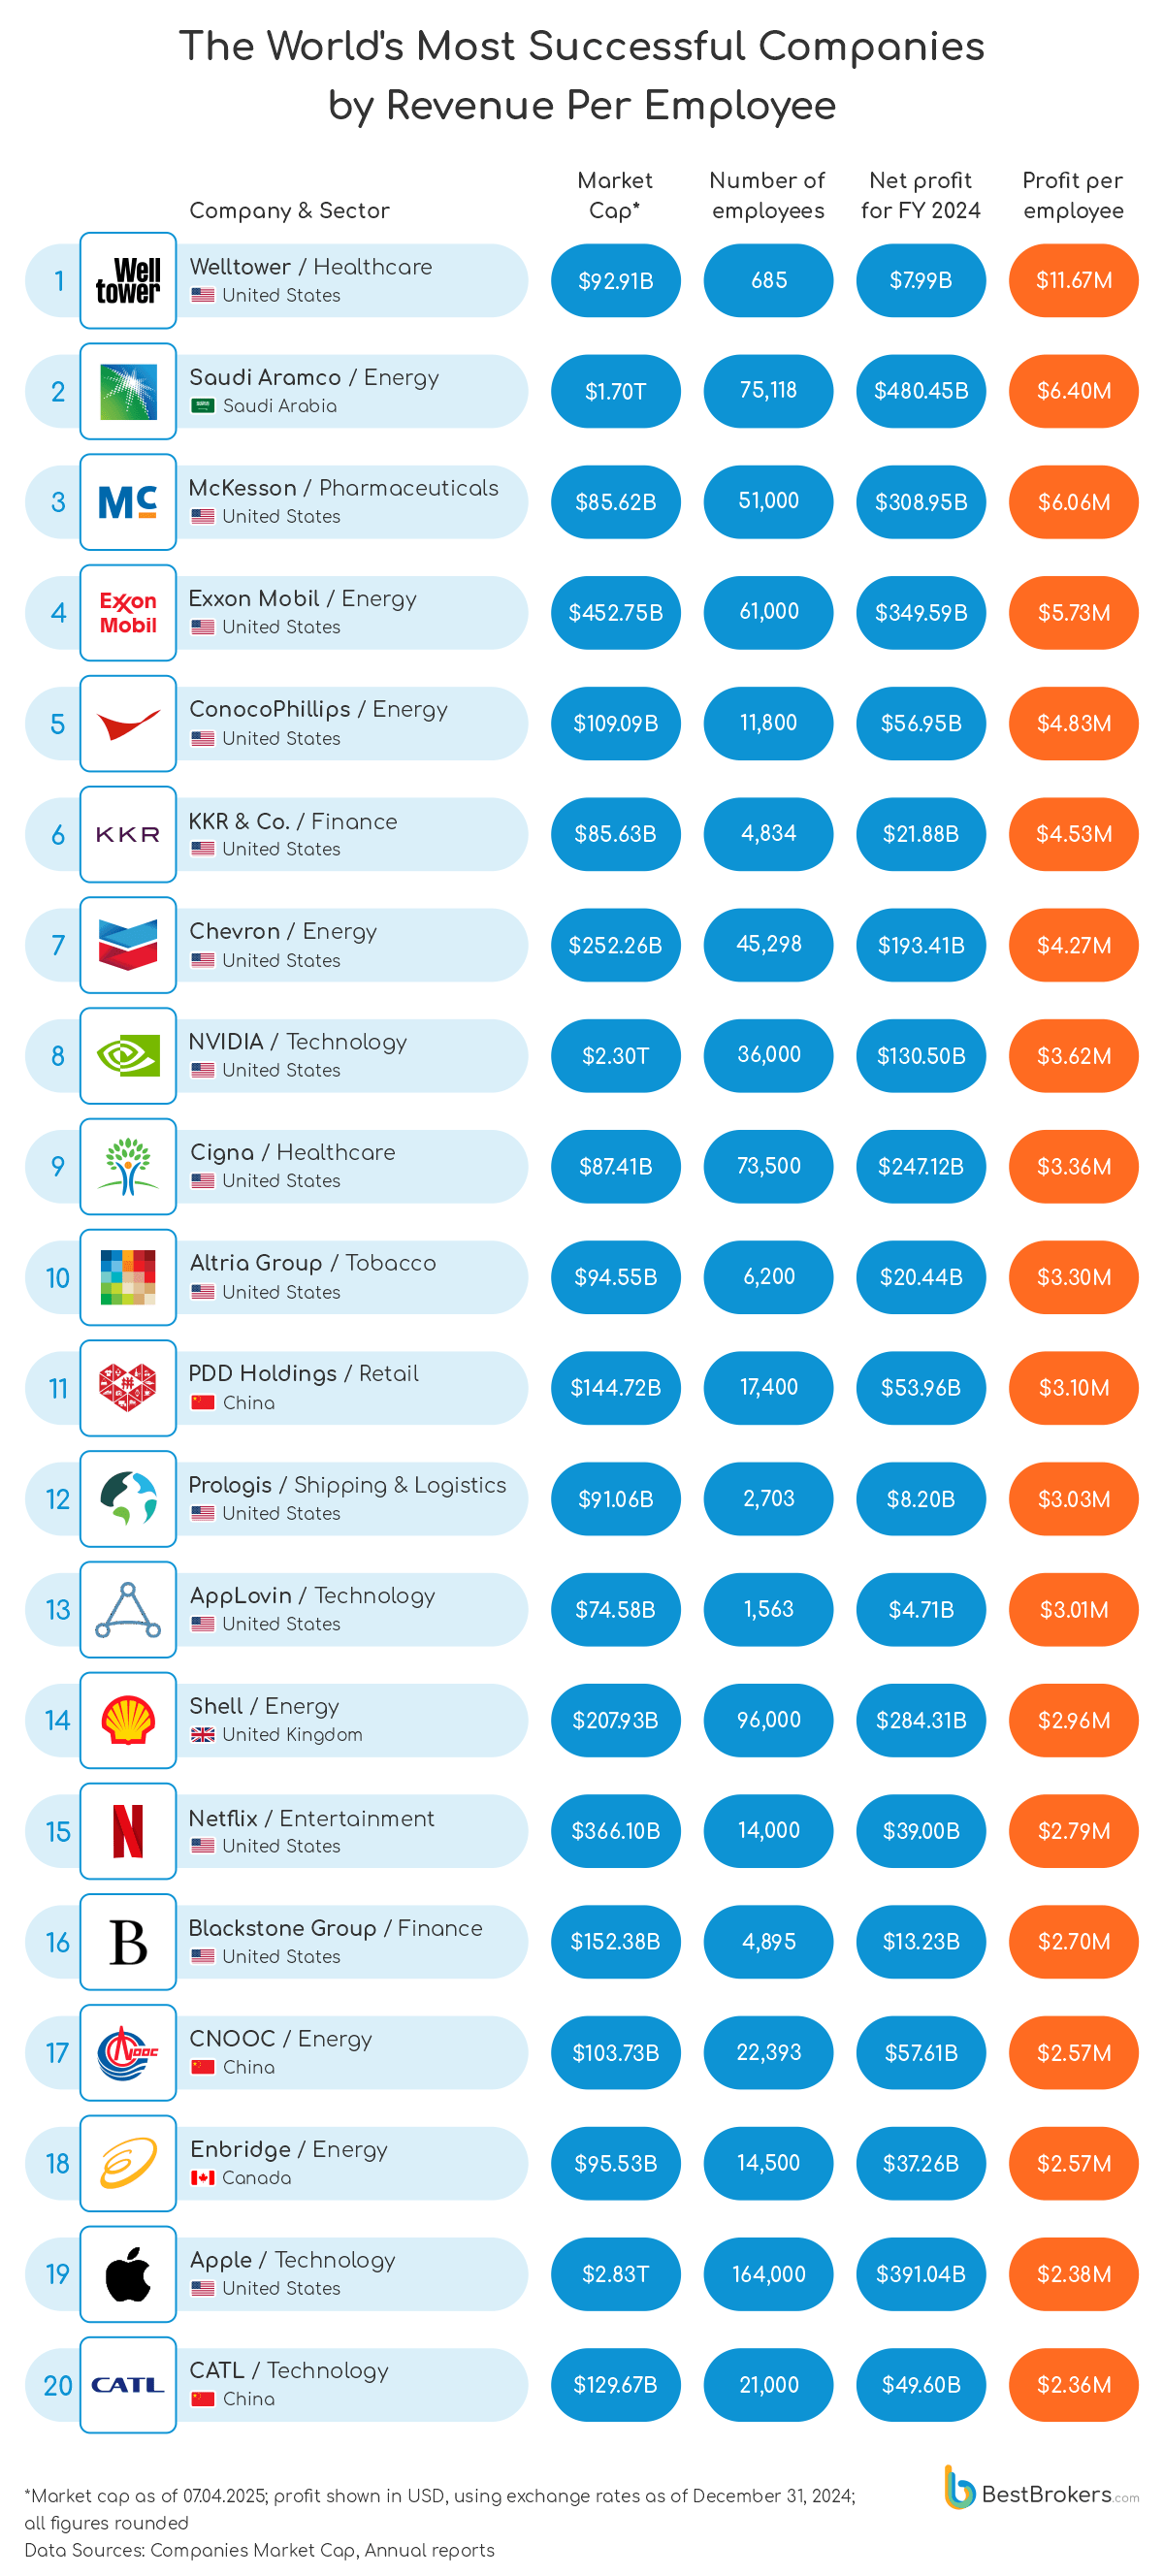
While net income per employee is a powerful tool to measure efficiency, revenue per employee provides a broader picture of whether the parts of the organisation are operating well and the extent to which employees and their capabilities are utilised. The leader in this chart is Welltower, an American healthcare real estate investment trust, which holds only 685 employees, yet achieved a total revenue of $7.99 billion, thus recording an impressive $11.67 million of revenue per employee. Its smaller workforce also secures it a spot on our net income per employee list, although it ranks at the bottom there.
Saudi Aramco ranks second with $6.40 million in revenue per employee, followed by McKesson, a major pharmaceuticals distributor, at $6.06 million per employee. Exxon Mobil, the largest U.S. oil and gas company, comes in fourth with $5.73 million per employee.
The United States accounts for 70% of the top performers, with fourteen companies. China follows with three representatives (PDD Holdings, CNOOC, and CATL), while Saudi Arabia, the United Kingdom, and Canada are each represented by one company — Saudi Aramco, Shell, and Enbridge, respectively.
What Changed in a Year?
Due to the rapidly evolving global landscape, companies are in constant competition to achieve greater efficiency and profitability. Compared to last year’s list of companies ranked by net income per employee, 65% of the top 20 remain the same, though with shifts in their positions, while seven new companies have entered the rankings. The 2024 leader, NVIDIA, moves up from the 4th spot in 2023, while Prologis sees a slight drop from second place in 2023 to third in 2024. Saudi Aramco, the leader in 2023 for net profit per employee, now ranks third in 2024 but holds second place for revenue per employee. ConocoPhillips, in comparison, experienced a significant decline, dropping from third place in 2023 to tenth in 2024.
Methodology
To compile our list of companies with the highest profit per employee, the team at BestBrokers reviewed the top 250 largest firms globally by market capitalisation as of April 7, 2024, sourced from Companies Market Cap. Fifteen companies were excluded from our analysis because of only old data available or the absence of such data overall. We were left with 235 companies, and we meticulously gathered financial data from each of their 2024 annual reports or the corresponding fiscal period. We focused on the total revenue of the companies, which is the total of sales of all products and services before expenses are taken out, and the net income attributable to shareholders, which is the income minus different expenses and operating costs. We converted those into US dollars using exchange rates from Xe Currency Converter as of December 31, 2024, for consistency across various currencies.
Furthermore, we obtained the number of employees from each company’s official website and cross-verified this information with platforms like Macrotrends. Using this data, we calculated the revenue and profit per employee for each company by dividing their yearly revenue and net profit by the total number of registered employees. Companies were then ranked based on this metric, offering valuable insights into which firms effectively utilise their workforce to achieve high levels of profitability. You can access the complete dataset on Google Drive via this link.
Raw Data
| Rank by market cap | Company | Market Cap (as of 7.04.2025) | Country | Sector | Number of employees | Revenue in USD | Net income in USD | Fiscal Year Ended | Revenue per employee | Profit per employee |
|---|---|---|---|---|---|---|---|---|---|---|
| 3 | NVIDIA | $2,301,163,732,992 | United States | Technology | 36,000 | $130,497,000,000 | $72,880,000,000 | Jan 26 2025 | $3,624,917 | $2,024,444 |
| 154 | Altria Group | $94,553,079,808 | United States | Tobacco | 6,200 | $20,444,000,000 | $11,236,000,000 | Dec 31 2024 | $3,297,419 | $1,812,258 |
| 6 | Saudi Aramco | $1,701,426,463,091 | Saudi Arabia | Energy | 75,118 | $480,447,000,558 | $121,270,551,588 | Sep 30 2024 | $6,395,897 | $1,614,401 |
| 166 | Prologis | $91,056,955,392 | United States | Shipping & Logistics | 2,703 | $8,201,610,000 | $3,725,754,000 | Dec 31 2024 | $3,034,262 | $1,378,377 |
| 214 | AppLovin | $74,576,584,704 | United States | Technology | 1,563 | $4,709,248,000 | $1,577,059,000 | Dec 31 2024 | $3,012,955 | $1,008,995 |
| 162 | CME Group | $91,703,066,624 | United States | Finances | 3,760 | $6,130,100,000 | $3,481,500,000 | Dec 31 2024 | $1,630,346 | $925,931 |
| 90 | PDD Holdings (Pinduoduo) | $144,723,722,240 | China | Retail | 17,400 | $53,955,545,289 | $15,403,528,144 | Dec 31 2024 | $3,100,893 | $885,260 |
| 137 | CNOOC | $103,725,198,805 | China | Energy | 22,393 | $57,609,322,000 | $18,897,232,000 | Dec 31 2024 | $2,572,649 | $843,890 |
| 7 | Meta Platforms (Facebook) | $1,278,814,191,616 | United States | Technology | 74,067 | $164,501,000,000 | $62,360,000,000 | Dec 31 2024 | $2,220,976 | $841,940 |
| 132 | ConocoPhillips | $109,085,229,056 | United States | Energy | 11,800 | $56,953,000,000 | $9,218,000,000 | Dec 31 2024 | $4,826,525 | $781,186 |
| 194 | Arista Networks | $81,178,296,320 | United States | Technology | 4,412 | $7,003,146,000 | $2,852,054,000 | Dec 31 2024 | $1,587,295 | $646,431 |
| 179 | KKR & Co. | $85,628,379,136 | United States | Finances | 4,834 | $21,878,698,000 | $3,076,245,000 | Dec 31 2024 | $4,526,003 | $636,377 |
| 14 | Visa | $604,030,894,080 | United States | Finances | 31,600 | $35,926,000,000 | $19,743,000,000 | Sep 30 2024 | $1,136,899 | $624,778 |
| 23 | Netflix | $366,100,086,784 | United States | Entertainment | 14,000 | $39,000,966,000 | $8,711,631,000 | Dec 31 2024 | $2,785,783 | $622,259 |
| 1 | Apple | $2,829,863,354,368 | United States | Technology | 164,000 | $391,035,000,000 | $93,736,000,000 | Sep 28 2024 | $2,384,360 | $571,561 |
| 82 | Blackstone Group | $152,381,243,392 | United States | Finances | 4,895 | $13,229,968,000 | $2,776,508,000 | Dec 31 2024 | $2,702,751 | $567,213 |
| 18 | Exxon Mobil | $452,745,854,976 | United States | Energy | 61,000 | $349,585,000,000 | $33,680,000,000 | Dec 31 2024 | $5,730,902 | $552,131 |
| 200 | Investor AB | $78,626,869,846 | Sweden | Finances | 18,805 | $16,028,860,995 | $10,276,787,144 | Dec 31 2024 | $852,372 | $546,492 |
| 5 | Alphabet (Google) | $1,786,634,698,752 | United States | Technology | 183,323 | $350,018,000,000 | $100,118,000,000 | Dec 31 2024 | $1,909,297 | $546,129 |
| 159 | Welltower | $92,911,673,344 | United States | Healthcare | 685 | $7,991,118,000 | $340,094,000 | Dec 31 2024 | $11,665,866 | $496,488 |
| 10 | TSMC | $761,385,517,056 | Taiwan | Technology | 73,090 | $88,215,613,532 | $35,760,035,372 | Dec 31 2024 | $1,206,945 | $489,260 |
| 139 | American Tower | $103,065,542,656 | United States | Telecommunications | 4,691 | $10,127,000,000 | $2,255,000,000 | Dec 31 2024 | $2,158,815 | $480,708 |
| 217 | Nintendo | $73,660,080,197 | Japan | Technology | 7,724 | $10,648,041,310 | $3,124,624,514 | Mar 31 2024 | $1,378,566 | $404,535 |
| 36 | Chevron | $252,258,779,136 | United States | Energy | 45,298 | $193,414,000,000 | $17,661,000,000 | Dec 31 2024 | $4,269,813 | $389,885 |
| 2 | Microsoft | $2,675,043,205,120 | United States | Technology | 228,000 | $245,122,000,000 | $88,136,000,000 | Jun 30, 2024 | $1,075,096 | $386,561 |
| 19 | Mastercard | $446,527,242,240 | United States | Finances | 35,300 | $28,167,000,000 | $12,874,000,000 | Dec 31 2024 | $797,932 | $364,703 |
| 35 | Kweichow Moutai | $257,819,535,044 | China | Food & Beverage | 33,302 | $23,413,183,862 | $11,813,256,060 | Sep 30 2024 | $703,056 | $354,731 |
| 112 | CATL | $129,669,126,445 | China | Technology | 21,000 | $49,595,719,898 | $6,952,021,434 | Dec 31 2024 | $2,361,701 | $331,049 |
| 115 | BlackRock | $127,714,213,888 | United States | Finances | 19,800 | $20,407,000,000 | $6,369,000,000 | Dec 31, 2024 | $1,030,657 | $321,667 |
| 225 | Chugai Pharmaceutical | $72,137,524,549 | Japan | Pharmaceuticals | 7,778 | $7,455,574,635 | $2,466,806,480 | Dec 31 2024 | $958,546 | $317,152 |
| 101 | Uber | $135,137,230,848 | United States | Transportation | 31,100 | $43,978,000,000 | $9,856,000,000 | Dec 31, 2024 | $1,414,084 | $316,913 |
| 223 | AIA | $72,298,985,799 | Hong Kong | Finances | 23,000 | $22,467,000,000 | $6,836,000,000 | Dec 31 2024 | $976,826 | $297,217 |
| 208 | Ferrari | $76,216,655,872 | Italy | Automotive | 5,435 | $6,947,673,954 | $1,583,777,980 | Dec 31 2024 | $1,278,321 | $291,403 |
| 201 | SK Hynix | $77,710,970,097 | South Korea | Technology | 46,255 | $45,027,496,268 | $13,461,171,096 | Dec 31 2024 | $973,462 | $291,021 |
| 88 | Goldman Sachs | $146,323,046,400 | United States | Finances | 46,500 | $52,164,000,000 | $13,525,000,000 | Dec 31 2024 | $1,121,806 | $290,860 |
| 156 | TAQA | $93,369,435,739 | United Arab Emirates | Utilities | 7,000 | $15,020,281,628 | $1,924,573,992 | Dec 31 2024 | $2,145,755 | $274,939 |
| 57 | Merck | $205,796,491,264 | United States | Pharmaceuticals | 62,557 | $64,168,000,000 | $17,117,000,000 | Dec 31 2024 | $1,025,753 | $273,622 |
| 16 | Tencent | $583,080,673,280 | China | Technology | 105,506 | $90,455,209,000 | $26,588,001,000 | Dec 31 2024 | $857,347 | $252,005 |
| 135 | Al Rajhi Bank | $105,366,362,407 | Saudi Arabia | Finances | 20,878 | $7,983,743,313 | $5,259,206,574 | Dec 31 2024 | $382,400 | $251,902 |
| 146 | Shopify | $100,592,107,520 | Canada | E-commerce | 8,100 | $8,880,000,000 | $2,019,000,000 | Dec 31 2024 | $1,096,296 | $249,259 |
| 152 | Enbridge | $95,525,617,664 | Canada | Energy | 14,500 | $37,262,660,050 | $3,521,183,050 | Dec 31 2024 | $2,569,839 | $242,840 |
| 92 | Booking Holdings (Booking.com) | $140,580,978,688 | United States | Travel Services | 24,300 | $23,739,000,000 | $5,882,000,000 | Dec 31 2024 | $976,914 | $242,058 |
| 8 | Berkshire Hathaway | $1,065,947,758,592 | United States | Finances | 392,396 | $371,433,000,000 | $88,995,000,000 | Dec 31 2024 | $946,577 | $226,799 |
| 13 | Eli Lilly | $662,904,504,320 | United States | Pharmaceuticals | 47,000 | $45,042,700,000 | $10,590,000,000 | Dec 31 2024 | $958,355 | $225,319 |
| 129 | Chubb | $112,464,257,024 | Switzerland | Finances | 43,000 | $58,168,981,000 | $9,648,350,480 | Dec 31, 2024 | $1,352,767 | $224,380 |
| 209 | Lam Research | $75,851,472,896 | United States | Technology | 17,450 | $14,905,366,000 | $3,827,772,000 | Jun 30 2024 | $854,176 | $219,357 |
| 153 | Rio Tinto | $95,252,627,456 | United Kingdom | Mining | 53,039 | $53,658,000,000 | $11,552,000,000 | Dec 31 2024 | $1,011,671 | $217,802 |
| 168 | Intercontinental Exchange | $90,046,816,256 | United States | Finances | 12,920 | $9,279,000,000 | $2,754,000,000 | Dec 31 2024 | $718,189 | $213,158 |
| 114 | Union Pacific Corporation | $127,810,560,000 | United States | Industrials | 32,439 | $24,250,000,000 | $6,747,000,000 | Dec 31 2024 | $747,557 | $207,990 |
| 91 | QUALCOMM | $140,970,754,048 | United States | Technology | 49,000 | $38,962,000,000 | $10,142,000,000 | Sep 29 2024 | $795,143 | $206,980 |
| 188 | DBS Group | $82,775,599,013 | Singapore | Finances | 41,000 | $16,402,074,546 | $8,304,391,602 | Dec 31 2024 | $400,051 | $202,546 |
| 182 | Keyence | $84,147,232,152 | Japan | Technology | 12,290 | $6,160,618,580 | $2,354,235,112 | Mar 20 2024 | $501,271 | $191,557 |
| 38 | Hermès | $250,263,938,849 | France | Consumer Goods | 25,185 | $15,785,750,300 | $4,789,835,770 | Dec 31 2024 | $626,792 | $190,186 |
| 86 | Adobe | $148,773,634,048 | United States | Technology | 30,709 | $21,505,000,000 | $5,560,000,000 | Nov 29 2024 | $700,283 | $181,054 |
| 15 | JPMorgan Chase | $587,966,054,400 | United States | Finances | 317,233 | $177,556,000,000 | $56,868,000,000 | Dec 31 2024 | $559,702 | $179,263 |
| 39 | ASML | $248,138,022,912 | Netherlands | Technology | 44,027 | $29,410,091,111 | $7,878,931,244 | Dec 31 2024 | $668,001 | $178,957 |
| 64 | Verizon | $181,143,388,160 | United States | Telecommunications | 99,600 | $134,788,000,000 | $17,506,000,000 | Dec 31 2024 | $1,353,293 | $175,763 |
| 117 | Charles Schwab | $125,407,428,608 | United States | Finances | 32,100 | $19,606,000,000 | $5,478,000,000 | Dec 31 2024 | $610,779 | $170,654 |
| 142 | Palo Alto Networks | $101,678,694,400 | United States | Technology | 15,289 | $8,027,500,000 | $2,577,600,000 | Jul 31 2024 | $525,051 | $168,592 |
| 55 | Shell | $207,931,260,928 | United Kingdom | Energy | 96,000 | $284,312,000,000 | $16,094,000,000 | Dec 31 2024 | $2,961,583 | $167,646 |
| 108 | CM Bank | $132,123,687,762 | China | Finances | 117,201 | $40,708,865,000 | $19,564,970,000 | Dec 31 2024 | $347,342 | $166,935 |
| 160 | Duke Energy | $92,411,232,256 | United States | Utilities | 26,413 | $30,357,000,000 | $4,404,000,000 | Dec 31 2024 | $1,149,320 | $166,736 |
| 32 | T-Mobile US | $283,277,131,776 | United States | Telecommunications | 70,000 | $81,400,000,000 | $11,339,000,000 | Dec 31 2024 | $1,162,857 | $161,986 |
| 74 | Morgan Stanley | $161,011,826,688 | United States | Finances | 80,000 | $61,497,000,000 | $12,800,000,000 | Dec 31 2024 | $768,713 | $160,000 |
| 11 | Broadcom | $687,848,226,816 | United States | Technology | 37,000 | $51,574,000,000 | $5,895,000,000 | Nov 3 2024 | $1,393,892 | $159,324 |
| 77 | Intuit | $156,982,444,032 | United States | Technology | 18,800 | $16,285,000,000 | $2,963,000,000 | Jul 31 2024 | $866,223 | $157,606 |
| 53 | Novartis | $211,512,639,488 | Switzerland | Pharmaceuticals | 75,883 | $51,722,000,000 | $11,941,000,000 | Dec 31 2024 | $681,602 | $157,361 |
| 140 | Spotify | $103,029,030,912 | Sweden | Entertainment | 7,691 | $16,309,167,070 | $1,184,191,420 | Dec 31 2024 | $2,120,552 | $153,971 |
| 148 | Southern Company | $97,549,393,920 | United States | Utilities | 28,600 | $26,724,000,000 | $4,401,000,000 | Dec 31 2024 | $934,406 | $153,881 |
| 175 | Petrobras | $86,319,906,816 | Brazil | Energy | 49,185 | $91,416,000,000 | $7,528,000,000 | Dec 31 2024 | $1,858,615 | $153,055 |
| 28 | Coca-Cola | $300,948,652,032 | United States | Food & Beverage | 69,700 | $47,061,000,000 | $10,631,000,000 | Dec 31 2024 | $675,194 | $152,525 |
| 99 | TotalEnergies | $137,059,999,744 | France | Energy | 107,776 | $203,549,809,900 | $16,397,617,220 | Dec 31 2024 | $1,888,638 | $152,145 |
| 73 | Intuitive Surgical | $161,789,820,928 | United States | Healthcare | 15,638 | $8,352,000,000 | $2,323,000,000 | Dec 31 2024 | $534,084 | $148,548 |
| 76 | Amgen | $158,147,788,800 | United States | Pharmaceuticals | 28,000 | $33,424,000,000 | $4,090,000,000 | Feb 4, 2025 | $1,193,714 | $146,071 |
| 143 | Iberdrola | $101,371,422,808 | Spain | Energy | 40,000 | $46,554,956,010 | $5,839,791,080 | Dec 31 2024 | $1,163,874 | $145,995 |
| 199 | UniCredit | $78,698,722,151 | Italy | Finances | 69,722 | $25,852,417,960 | $10,113,494,210 | Dec 31 2024 | $370,793 | $145,055 |
| 95 | Texas Instruments | $137,752,494,080 | United States | Technology | 34,000 | $15,641,000,000 | $4,775,000,000 | Dec 31 2024 | $460,029 | $140,441 |
| 203 | Munich RE (Münchener Rück) | $77,071,056,434 | Germany | Finances | 43,584 | $63,631,037,910 | $5,915,754,150 | Dec 31 2024 | $1,459,963 | $135,732 |
| 21 | Procter & Gamble | $383,969,165,312 | United States | Consumer Goods | 108,000 | $84,039,000,000 | $14,595,000,000 | Jun 30 2024 | $778,139 | $135,139 |
| 72 | American Express | $163,835,379,712 | United States | Finances | 75,100 | $65,949,000,000 | $9,995,000,000 | Dec 31 2024 | $878,149 | $133,089 |
| 221 | Moody’s | $72,392,728,576 | United States | Finances | 15,838 | $7,088,000,000 | $2,058,000,000 | Dec 31 2024 | $447,531 | $129,941 |
| 83 | Progressive | $151,037,853,696 | United States | Finances | 66,300 | $75,372,000,000 | $8,463,000,000 | Dec 31 2024 | $1,136,833 | $127,647 |
| 233 | Bank of Communications | $68,989,476,218 | China | Finances | 93,408 | $28,362,836,000 | $11,798,714,000 | Jun 30 2024 | $303,645 | $126,314 |
| 66 | General Electric | $177,916,198,912 | United States | Industrials | 53,000 | $38,702,000,000 | $6,556,000,000 | Dec 31 2024 | $730,226 | $123,698 |
| 185 | Enel | $83,306,446,797 | Italy | Energy | 60,359 | $82,151,458,730 | $7,300,779,440 | Dec 31 2024 | $1,361,047 | $120,956 |
| 30 | ICBC | $292,131,428,143 | China | Finances | 415,159 | $111,967,908,000 | $50,123,231,000 | Dec 31 2024 | $269,699 | $120,733 |
| 34 | Bank of America | $261,460,295,680 | United States | Finances | 213,000 | $101,887,000,000 | $25,503,000,000 | Dec 31 2024 | $478,343 | $119,732 |
| 47 | China Construction Bank | $223,504,176,695 | China | Finances | 376,847 | $99,814,090,000 | $45,000,253,000 | Dec 31 2024 | $264,866 | $119,413 |
| 31 | Novo Nordisk | $283,794,341,888 | Denmark | Pharmaceuticals | 77,349 | $26,331,943,541 | $9,157,872,452 | Dec 31 2024 | $340,430 | $118,397 |
| 68 | Palantir | $173,580,091,392 | United States | Technology | 3,936 | $2,865,507,000 | $462,190,000 | Dec 31 2024 | $728,025 | $117,426 |
| 50 | Abbott Laboratories | $215,818,780,672 | United States | Healthcare | 114,000 | $41,950,000,000 | $13,351,000,000 | Dec 31 2024 | $367,982 | $117,114 |
| 75 | Royal Bank Of Canada | $158,277,435,392 | Canada | Finances | 94,838 | $37,707,947,200 | $11,085,489,800 | Oct 31 2024 | $397,604 | $116,889 |
| 49 | Cisco | $216,975,933,440 | United States | Technology | 90,400 | $53,803,000,000 | $10,320,000,000 | Jul 27 2024 | $595,166 | $114,159 |
| 89 | Commonwealth Bank | $145,410,136,185 | Australia | Finances | 53,262 | $16,242,909,839 | $5,822,049,922 | Jun 30 2024 | $304,962 | $109,310 |
| 63 | HSBC | $185,793,052,672 | United Kingdom | Finances | 211,304 | $65,854,000,000 | $22,917,000,000 | Dec 31 2024 | $311,655 | $108,455 |
| 147 | China Shenhua Energy | $97,770,868,774 | China | Mining | 83,351 | $46,357,375,000 | $8,551,677,000 | Dec 31 2024 | $556,171 | $102,598 |
| 22 | Johnson & Johnson | $369,285,431,296 | United States | Pharmaceuticals | 138,100 | $88,821,000,000 | $14,066,000,000 | Dec 31 2024 | $643,164 | $101,854 |
| 56 | Linde | $207,116,533,760 | United Kingdom | Chemicals | 65,289 | $33,005,000,000 | $6,565,000,000 | Dec 31 2024 | $505,522 | $100,553 |
| 110 | Pfizer | $130,273,206,272 | United States | Pharmaceuticals | 81,000 | $63,627,000,000 | $8,031,000,000 | $785,519 | $99,148 | |
| 58 | Bank of China | $204,442,495,856 | China | Finances | 312,757 | $72,782,346,000 | $30,351,117,000 | Dec 31 2024 | $232,712 | $97,044 |
| 98 | Caterpillar | $137,682,649,088 | United States | Industrials | 113,200 | $64,809,000,000 | $10,792,000,000 | Dec 31 2024 | $572,518 | $95,336 |
| 190 | Intesa Sanpaolo | $82,306,127,221 | Italy | Finances | 94,736 | $26,406,011,840 | $9,017,752,940 | Dec 31 2024 | $278,733 | $95,188 |
| 124 | Deere & Company (John Deere) | $116,670,021,632 | United States | Industrials | 75,000 | $51,716,000,000 | $7,100,000,000 | Oct 27 2024 | $689,547 | $94,667 |
| 46 | AstraZeneca | $230,366,527,488 | United Kingdom | Pharmaceuticals | 94,300 | $67,852,422,590 | $8,827,729,050 | Dec 31 2024 | $719,538 | $93,613 |
| 169 | Zurich Insurance Group | $89,720,691,340 | Switzerland | Finances | 63,000 | $68,718,000,000 | $5,814,000,000 | Dec 31 2024 | $1,090,762 | $92,286 |
| 94 | S&P Global | $138,467,377,152 | United States | Finances | 42,350 | $14,208,000,000 | $3,852,000,000 | Dec 31 2024 | $335,490 | $90,956 |
| 232 | TransDigm | $69,424,324,608 | United States | Industrials | 16,600 | $7,940,000,000 | $1,481,000,000 | Sep 30 2024 | $478,313 | $89,217 |
| 116 | Comcast | $126,210,449,408 | United States | Telecommunications | 182,000 | $123,731,000,000 | $16,192,000,000 | Dec 31 2024 | $679,841 | $88,967 |
| 45 | Roche | $230,799,136,469 | Switzerland | Pharmaceuticals | 103,249 | $66,967,360,050 | $9,162,556,230 | Dec 31 2024 | $648,601 | $88,742 |
| 133 | BHP Group | $106,458,135,000 | Australia | Mining | 90,000 | $55,658,000,000 | $7,897,000,000 | Jun 30 2024 | $618,422 | $87,744 |
| 60 | Wells Fargo | $199,109,443,584 | United States | Finances | 217,000 | $82,296,000,000 | $18,606,000,000 | Dec 31 2024 | $379,244 | $85,742 |
| 41 | Samsung | $239,689,965,434 | South Korea | Technology | 267,860 | $204,666,228,282 | $22,870,797,695 | Dec 31 2024 | $764,079 | $85,383 |
| 51 | Toyota | $214,821,519,360 | Japan | Automotive | 380,793 | $297,724,359,504 | $32,469,467,597 | Dec 31 2024 | $781,854 | $85,268 |
| 44 | Salesforce | $231,370,358,784 | United States | Technology | 72,682 | $37,895,000,000 | $6,197,000,000 | Jan 31 2025 | $521,381 | $85,262 |
| 42 | Agricultural Bank of China | $237,204,774,929 | China | Finances | 454,716 | $97,336,171,000 | $38,645,371,000 | Dec 31 2024 | $214,059 | $84,988 |
| 215 | Colgate-Palmolive | $74,343,964,672 | United States | Consumer Goods | 34,000 | $20,101,000,000 | $2,889,000,000 | Dec 31 2024 | $591,206 | $84,971 |
| 43 | Philip Morris International | $234,438,508,544 | United States | Tobacco | 83,100 | $37,878,000,000 | $7,034,000,000 | Dec 31 2024 | $455,812 | $84,645 |
| 211 | Thomson Reuters | $75,543,306,240 | Canada | Technology | 26,400 | $7,258,000,000 | $2,205,000,000 | Dec 31 2024 | $274,924 | $83,523 |
| 130 | Fiserv | $110,932,803,584 | United States | Technology | 38,000 | $20,456,000,000 | $3,131,000,000 | Dec 31 2024 | $538,316 | $82,395 |
| 165 | AXA | $91,093,279,542 | France | Finances | 100,041 | $114,793,726,440 | $8,206,092,740 | Dec 31 2024 | $1,147,467 | $82,027 |
| 224 | Banco Bilbao Vizcaya Argentaria | $72,216,051,712 | Spain | Finances | 124,269 | $36,921,173,790 | $10,058,342,940 | Dec 31 2024 | $297,107 | $80,940 |
| 164 | British American Tobacco | $91,117,166,592 | United Kingdom | Tobacco | 48,000 | $32,458,687,610 | $3,797,115,580 | Dec 31 2024 | $676,223 | $79,107 |
| 149 | Elevance Health | $97,095,131,136 | United States | Healthcare | 75,630 | $176,810,000,000 | $5,980,000,000 | Dec 31 2024 | $2,337,829 | $79,069 |
| 26 | AbbVie | $330,728,505,344 | United States | Pharmaceuticals | 55,000 | $56,334,000,000 | $4,278,000,000 | Dec 31 2024 | $1,024,255 | $77,782 |
| 62 | AT&T | $191,226,707,968 | United States | Telecommunications | 140,990 | $122,336,000,000 | $10,746,000,000 | Dec 31 2024 | $867,693 | $76,218 |
| 97 | Nextera Energy | $137,739,599,872 | United States | Utilities | 93,000 | $24,753,000,000 | $6,946,000,000 | Dec 31 2024 | $266,161 | $74,688 |
| 212 | Rolls-Royce Holdings | $75,320,622,422 | United Kingdom | Aerospace & Defense | 42,400 | $23,727,580,470 | $3,163,426,430 | Dec 31 2024 | $559,613 | $74,609 |
| 155 | RELX | $94,453,317,632 | United Kingdom | Industrials | 36,400 | $11,838,066,220 | $2,704,158,650 | Dec 31 2024 | $325,222 | $74,290 |
| 81 | Xiaomi | $152,940,871,680 | China | Technology | 43,688 | $50,129,176,800 | $3,241,163,262 | Dec 31 2024 | $1,147,436 | $74,189 |
| 105 | Sanofi | $132,819,812,352 | France | Pharmaceuticals | 82,878 | $42,748,477,790 | $5,977,148,960 | Dec 31 2024 | $515,800 | $72,120 |
| 181 | Nike | $84,500,430,848 | United States | Retail | 79,400 | $51,362,000,000 | $5,700,000,000 | May 31 2024 | $646,877 | $71,788 |
| 61 | L’Oréal | $196,313,091,611 | France | Consumer Goods | 95,023 | $45,251,929,212 | $6,668,829,133 | Dec 31 2024 | $476,221 | $70,181 |
| 173 | BNP Paribas | $87,214,339,555 | France | Finances | 177,952 | $50,813,050,290 | $12,162,415,920 | Dec 21 2024 | $285,544 | $68,347 |
| 193 | Analog Devices | $81,637,654,528 | United States | Technology | 24,000 | $9,427,000,000 | $1,635,000,000 | Nov 2 2024 | $392,792 | $68,125 |
| 235 | 3M | $68,444,852,224 | United States | Industrials | 61,500 | $24,575,000,000 | $4,173,000,000 | Dec 31 2024 | $399,593 | $67,854 |
| 103 | Allianz SE | $134,565,544,034 | Germany | Finances | 154,346 | $112,384,760,590 | $10,334,099,290 | Dec 31 2024 | $728,135 | $66,954 |
| 176 | Compagnie Financière Richemont | $86,019,780,435 | Switzerland | Consumer Goods | 37,117 | $21,452,803,440 | $2,457,873,580 | Mar 31 2024 | $577,978 | $66,220 |
| 220 | Sberbank | $72,527,359,477 | Russia | Finances | 210,661 | $29,536,321,815 | $13,933,303,020 | Dec 31 2024 | $140,208 | $66,141 |
| 24 | Oracle | $359,698,595,840 | United States | Technology | 159,000 | $52,961,000,000 | $10,467,000,000 | May 31 2024 | $333,088 | $65,830 |
| 96 | Sony | $137,749,004,288 | Japan | Technology | 110,000 | $87,941,236,723 | $7,215,254,667 | Dec 31 2024 | $799,466 | $65,593 |
| 126 | Ping An Insurance | $113,713,962,838 | China | Finances | 273,053 | $132,019,228,000 | $17,345,159,000 | Dec 31 2024 | $483,493 | $63,523 |
| 163 | Santander | $91,153,465,344 | Spain | Finances | 206,753 | $64,736,144,490 | $13,084,378,660 | Dec 31 2024 | $313,109 | $63,285 |
| 111 | Danaher | $130,047,344,640 | United States | Healthcare | 63,000 | $23,875,000,000 | $3,899,000,000 | Dec 31 2024 | $378,968 | $61,889 |
| 70 | PetroChina | $167,515,068,394 | China | Energy | 370,800 | $402,503,397,000 | $22,560,612,000 | Dec 31 2024 | $1,085,500 | $60,843 |
| 33 | LVMH | $279,199,736,778 | France | Consumer Goods | 215,000 | $88,120,282,970 | $13,059,404,500 | Dec 31 2024 | $409,862 | $60,741 |
| 213 | Equinix | $74,576,756,736 | United States | Technology | 13,606 | $8,748,000,000 | $815,000,000 | Dec 31 2024 | $642,952 | $59,900 |
| 145 | Toronto Dominion Bank | $100,995,596,288 | Canada | Finances | 103,762 | $37,103,081,400 | $6,161,547,700 | Oct 31 2024 | $357,579 | $59,382 |
| 180 | McKesson | $85,611,438,080 | United States | Pharmaceuticals | 51,000 | $308,951,000,000 | $3,002,000,000 | Mar 31 2024 | $6,057,863 | $58,863 |
| 69 | Deutsche Telekom | $169,360,237,972 | Germany | Telecommunications | 198,194 | $120,468,063,710 | $11,663,973,310 | Dec 31 2024 | $607,829 | $58,851 |
| 125 | Automatic Data Processing | $116,418,002,944 | United States | Technology | 64,000 | $19,202,600,000 | $3,752,000,000 | Jun 30 2024 | $300,041 | $58,625 |
| 93 | AMD | $139,328,274,432 | United States | Technology | 28,000 | $25,785,000,000 | $1,641,000,000 | Dec 28 2024 | $920,893 | $58,607 |
| 79 | Unilever | $153,582,157,824 | United Kingdom | Consumer Goods | 125,000 | $76,244,725,630 | $7,207,743,520 | Dec 31 2024 | $609,958 | $57,662 |
| 227 | Trane Technologies | $71,349,207,040 | Ireland | Industrials | 45,000 | $19,838,200,000 | $2,567,900,000 | Dec 31 2024 | $440,849 | $57,064 |
| 109 | Stryker Corporation | $131,988,045,824 | United States | Healthcare | 53,000 | $22,595,000,000 | $2,993,000,000 | Dec 31 2024 | $426,321 | $56,472 |
| 9 | Tesla | $770,131,361,792 | United States | Automotive | 125,665 | $97,690,000,000 | $7,091,000,000 | Dec 31 2024 | $777,384 | $56,428 |
| 119 | Honeywell | $124,128,026,624 | United States | Industrials | 102,000 | $38,498,000,000 | $5,705,000,000 | Dec 31 2024 | $377,431 | $55,931 |
| 52 | McDonald | $214,416,883,712 | United States | Restaurants | 150,000 | $25,920,000,000 | $8,223,000,000 | Dec 31 2024 | $172,800 | $54,820 |
| 85 | ServiceNow | $149,011,349,504 | United States | Finances | 26,293 | $10,984,000,000 | $1,425,000,000 | Dec 31 2024 | $417,754 | $54,197 |
| 27 | Alibaba | $303,513,272,320 | China | E-commerce | 204,891 | $128,940,016,000 | $10,924,517,000 | Mar 31 2024 | $629,310 | $53,319 |
| 136 | Air Liquide | $104,838,126,621 | France | Chemicals | 66,500 | $28,156,284,220 | $3,440,190,540 | Dec 31 2024 | $423,403 | $51,732 |
| 178 | Mondelez International | $85,773,967,360 | United States | Food & Beverage | 90,000 | $36,441,000,000 | $4,611,000,000 | Dec 31 2024 | $404,900 | $51,233 |
| 71 | Thermo Fisher Scientific | $165,206,360,064 | United States | Healthcare | 125,000 | $42,879,000,000 | $6,335,000,000 | Dec 31 2024 | $343,032 | $50,680 |
| 228 | CSL | $70,533,697,214 | Australia | Healthcare | 32,698 | $9,135,431,890 | $1,643,009,602 | Jun 30 2024 | $279,388 | $50,248 |
| 40 | International Holding Company | $240,151,816,683 | United Arab Emirates | Finances | 86,339 | $25,230,198,664 | $4,292,945,815 | Dec 31 2024 | $292,223 | $49,722 |
| 218 | Republic Services | $73,518,129,152 | United States | Industrials | 42,000 | $16,032,000,000 | $2,043,000,000 | Dec 31 2024 | $381,714 | $48,643 |
| 177 | UBS | $85,930,909,696 | Switzerland | Finances | 110,323 | $47,673,590,260 | $5,291,400,150 | Dec 31 2024 | $432,127 | $47,963 |
| 131 | Citigroup | $109,409,959,936 | United States | Finances | 239,000 | $81,089,000,000 | $11,458,000,000 | Dec 31 2024 | $339,285 | $47,941 |
| 172 | Cigna | $87,405,215,744 | United States | Healthcare | 73,500 | $247,121,000,000 | $3,434,000,000 | Dec 31 2024 | $3,362,190 | $46,721 |
| 202 | GlaxoSmithKline | $77,656,571,904 | United Kingdom | Pharmaceuticals | 69,305 | $39,371,546,080 | $3,231,187,250 | Mar 31 2024 | $568,091 | $46,623 |
| 127 | Marsh & McLennan Companies | $113,466,269,696 | United States | Finances | 90,000 | $24,458,000,000 | $4,060,000,000 | Dec 31 2024 | $271,756 | $45,111 |
| 167 | Waste Management | $90,605,166,592 | United States | Industrials | 61,700 | $22,063,000,000 | $2,746,000,000 | Dec 31 2014 | $357,585 | $44,506 |
| 144 | Lockheed Martin | $101,370,716,160 | United States | Aerospace & Defense | 121,000 | $71,043,000,000 | $5,336,000,000 | Dec 31 2024 | $587,132 | $44,099 |
| 37 | Nestlé | $251,075,926,079 | Switzerland | Food & Beverage | 277,000 | $101,127,964,460 | $12,048,479,160 | Dec 31 2024 | $365,083 | $43,496 |
| 229 | Northrop Grumman | $70,281,928,704 | United States | Aerospace & Defense | 97,000 | $41,033,000,000 | $4,174,000,000 | Dec 31 2024 | $423,021 | $43,031 |
| 195 | Aon | $81,164,533,760 | United Kingdom | Finances | 60,000 | $15,698,000,000 | $2,564,000,000 | Dec 31 2024 | $261,633 | $42,733 |
| 120 | Anheuser-Busch Inbev | $122,251,206,656 | Belgium | Food & Beverage | 143,885 | $62,193,983,120 | $6,092,654,450 | Dec 31 2024 | $432,248 | $42,344 |
| 48 | China Mobile | $221,684,632,535 | China | Telecommunications | 451,830 | $142,583,983,000 | $18,960,800,000 | Dec 31 2024 | $315,570 | $41,964 |
| 183 | Sherwin-Williams | $83,516,407,808 | United States | Industrials | 63,890 | $23,098,500,000 | $2,681,000,000 | Dec 31 2024 | $361,535 | $41,963 |
| 151 | Eaton | $96,578,895,872 | Ireland | Industrials | 94,000 | $24,878,000,000 | $3,794,000,000 | Dec 31 2024 | $264,660 | $40,362 |
| 171 | Fast Retailing | $87,631,592,807 | Japan | Retail | 60,000 | $19,768,207,331 | $2,369,246,751 | Aug 31 2024 | $329,470 | $39,487 |
| 134 | Medtronic | $106,296,918,016 | Ireland | Healthcare | 95,000 | $32,364,000,000 | $3,676,000,000 | Apr 26 2024 | $340,674 | $38,695 |
| 4 | Amazon | $1,812,206,583,808 | United States | E-commerce | 1,556,000 | $637,959,000,000 | $59,248,000,000 | Dec 31 2024 | $409,999 | $38,077 |
| 80 | Inditex | $153,477,660,672 | Spain | Retail | 162,000 | $40,200,072,880 | $6,104,100,940 | Dec 31 2024 | $248,149 | $37,680 |
| 186 | ABB | $82,843,647,735 | Switzerland | Industrials | 110,000 | $34,183,381,500 | $4,094,721,650 | Dec 31 2024 | $310,758 | $37,225 |
| 17 | UnitedHealth | $480,269,533,184 | United States | Healthcare | 400,000 | $400,278,000,000 | $14,405,000,000 | Dec 31 2024 | $1,000,695 | $36,013 |
| 107 | Boston Scientific | $132,672,569,344 | United States | Healthcare | 53,000 | $16,747,000,000 | $1,853,000,000 | Dec 31 2024 | $315,981 | $34,962 |
| 205 | Cintas | $76,852,781,056 | United States | Industrials | 46,500 | $9,596,615,000 | $1,565,664,000 | May 31 2024 | $206,379 | $33,670 |
| 204 | London Stock Exchange | $77,067,979,093 | United Kingdom | Finances | 26,251 | $11,115,284,140 | $859,558,550 | Dec 31 2024 | $423,423 | $32,744 |
| 59 | Pepsico | $201,047,752,704 | United States | Food & Beverage | 319,000 | $91,854,000,000 | $9,578,000,000 | Dec 31 2024 | $287,944 | $30,025 |
| 122 | Schneider Electric | $120,491,066,908 | France | Industrials | 150,000 | $39,701,630,270 | $4,442,278,710 | Dec 31 2024 | $264,678 | $29,615 |
| 29 | SAP | $297,847,128,064 | Germany | Technology | 109,973 | $35,563,203,840 | $3,250,803,160 | Dec 31 2024 | $323,381 | $29,560 |
| 25 | Home Depot | $351,787,909,120 | United States | Retail | 509,300 | $159,514,000,000 | $14,806,000,000 | Jan 31 2025 | $313,202 | $29,071 |
| 113 | Airbus | $128,364,116,976 | Netherlands | Aerospace & Defense | 156,921 | $72,040,045,700 | $4,403,776,880 | Dec 31 2024 | $459,085 | $28,064 |
| 161 | Dior | $92,338,131,311 | France | Consumer Goods | 195,831 | $88,119,242,380 | $5,419,392,720 | Dec 31 1024 | $449,976 | $27,674 |
| 118 | Lowe’s Companies | $124,976,971,776 | United States | Retail | 284,000 | $86,377,000,000 | $7,706,000,000 | Feb 2, 2025 | $304,144 | $27,134 |
| 104 | Gilead Sciences | $133,701,066,752 | United States | Pharmaceuticals | 18,000 | $28,754,000,000 | $480,000,000 | Dec 31 2024 | $1,597,444 | $26,667 |
| 231 | Midea | $70,000,260,025 | China | Furnishings & Appliances | 198,432 | $56,044,544,442 | $5,279,601,469 | Dec 31 2024 | $282,437 | $26,607 |
| 87 | Siemens | $148,443,535,940 | Germany | Industrials | 327,000 | $79,011,998,700 | $8,637,937,590 | Sep 30 2024 | $241,627 | $26,416 |
| 192 | Arthur J. Gallagher & Co. | $81,643,405,312 | United States | Finances | 56,000 | $11,554,000,000 | $1,462,700,000 | Dec 31, 2024 | $206,321 | $26,120 |
| 78 | RTX | $156,806,316,032 | United States | Industrials | 186,000 | $80,738,000,000 | $4,774,000,000 | Dec 31 2024 | $434,075 | $25,667 |
| 198 | O’Reilly Automotive | $79,556,853,760 | United States | Automotive | 93,047 | $16,708,479,000 | $2,386,680,000 | Dec 31 2024 | $179,570 | $25,650 |
| 157 | MercadoLibre | $93,348,618,240 | Argentina | E-commerce | 84,207 | $20,777,000,000 | $1,911,000,000 | Dec 31 2024 | $246,737 | $22,694 |
| 20 | Costco | $406,626,598,912 | United States | Retail | 333,000 | $249,625,000,000 | $7,367,000,000 | Sep 1 2024 | $749,625 | $22,123 |
| 84 | Walt Disney | $151,004,692,480 | United States | Entertainment | 225,000 | $91,361,000,000 | $4,972,000,000 | Sep 30 2024 | $406,049 | $22,098 |
| 54 | IBM | $210,934,005,760 | United States | Technology | 293,400 | $62,753,000,000 | $6,023,000,000 | Dec 31 2024 | $213,882 | $20,528 |
| 216 | GE Vernova | $74,207,969,280 | United States | Utilities | 76,800 | $34,935,000,000 | $1,552,000,000 | Dec 31 2024 | $454,883 | $20,208 |
| 138 | Applied Materials | $103,139,385,344 | United States | Technology | 357,000 | $27,176,000,000 | $7,177,000,000 | Oct 27 2024 | $76,123 | $20,104 |
| 226 | Amphenol | $71,604,076,544 | United States | Technology | 125,000 | $15,222,700,000 | $2,424,000,000 | Dec 31 2024 | $121,782 | $19,392 |
| 184 | Sinopec | $83,313,225,095 | China | Energy | 355,952 | $421,015,522,000 | $6,704,643,000 | Dec 31 2024 | $1,182,787 | $18,836 |
| 191 | HCA Healthcare | $81,653,227,520 | United States | Healthcare | 316,000 | $70,603,000,000 | $5,760,000,000 | Dec 31 2024 | $223,427 | $18,228 |
| 222 | Micron Technology | $72,329,134,080 | United States | Technology | 43,000 | $25,111,000,000 | $778,000,000 | Aug 29 2024 | $583,977 | $18,093 |
| 230 | Vinci | $70,000,888,270 | France | Construction | 282,481 | $75,721,653,120 | $5,060,389,170 | Dec 31 2024 | $268,059 | $17,914 |
| 170 | China Telecom | $88,516,909,853 | China | Telecommunications | 278,539 | $72,530,129,000 | $4,522,653,577 | Dec 31 2024 | $260,395 | $16,237 |
| 196 | CVS Health | $80,262,529,024 | United States | Healthcare | 300,000 | $372,809,000,000 | $4,614,000,000 | Dec 31 2024 | $1,242,697 | $15,380 |
| 100 | TJX Companies | $136,464,941,056 | United States | Retail | 364,000 | $56,360,000,000 | $4,864,000,000 | Jan 31 2025 | $154,835 | $13,363 |
| 123 | EssilorLuxottica | $120,065,397,082 | France | Healthcare | 200,000 | $27,583,959,720 | $2,454,751,810 | Dec 31 2024 | $137,920 | $12,274 |
| 187 | United Parcel Service | $82,812,354,560 | United States | Shipping & Logistics | 490,000 | $91,070,000,000 | $5,782,000,000 | Dec 31 2024 | $185,857 | $11,800 |
| 158 | Starbucks | $93,259,849,728 | United States | Restaurants | 361,000 | $36,176,200,000 | $3,760,900,000 | Sep 29 2024 | $100,211 | $10,418 |
| 65 | Accenture | $178,580,389,888 | Ireland | Technology | 774,000 | $64,896,464,000 | $7,264,787,000 | Aug 31 2024 | $83,846 | $9,386 |
| 102 | Tata Consultancy Services | $134,758,024,654 | India | Technology | 607,979 | $29,766,693,216 | $5,660,502,952 | March 31 2025 | $48,960 | $9,310 |
| 12 | Walmart | $666,921,795,584 | United States | Retail | 2,100,000 | $680,985,000,000 | $19,436,000,000 | Jan 31 2025 | $324,279 | $9,255 |
| 106 | BYD | $132,792,591,251 | China | Automotive | 900,608 | $106,463,036,335 | $5,514,845,402 | Dec 31 2024 | $118,212 | $6,123 |
| 234 | DoorDash | $68,542,865,408 | United States | Food Delivery | 23,700 | $10,722,000,000 | $123,000,000 | Dec 31 2024 | $452,405 | $5,190 |
| 189 | BP | $82,326,970,368 | United Kingdom | Energy | 100,500 | $189,185,000,000 | $381,000,000 | Dec 31 2024 | $1,882,438 | $3,791 |
| 67 | Fomento Económico Mexicano | $174,500,986,880 | Mexico | Food & Beverage | 392,000 | $37,853,724,720 | $1,365,104,352 | Dec 31 2024 | $96,566 | $3,482 |
| 219 | Brookfield Asset Management | $73,190,916,096 | Canada | Finances | 250,000 | $1,052,000,000 | $539,000,000 | Dec 31 2024 | $4,208 | $2,156 |
| 210 | Brookfield Corporation | $75,704,131,584 | Canada | Finances | 250,000 | $86,006,000,000 | $473,000,000 | Dec 31 2024 | $344,024 | $1,892 |
| 206 | KLA | $76,613,345,280 | United States | Technology | 15,230 | $9,812,249,000 | $2,761,896 | Jun 30 2024 | $644,271 | $181 |
| 197 | CrowdStrike | $79,723,388,928 | United States | Technology | 7,925 | $3,953,624,000 | -$19,271,000 | Jan 31 2025 | $498,880 | -$2,432 |
| 150 | Safran | $96,732,352,973 | France | Aerospace & Defense | 100,000 | $28,840,992,440 | -$694,073,530 | Dec 31 2024 | $288,410 | -$6,941 |
| 141 | Boeing | $102,771,269,632 | United States | Aerospace & Defense | 172,000 | $66,517,000,000 | -$11,875,000,000 | Dec 31 2024 | $386,727 | -$69,041 |
| 121 | Vertex Pharmaceuticals | $122,015,776,768 | United States | Pharmaceuticals | 6,100 | $11,020,000,000 | -$535,600,000 | Dec 31 2024 | $1,806,557 | -$87,803 |
| 174 | Intel | $86,557,712,384 | United States | Technology | 108,900 | $53,101,000,000 | -$18,756,000,000 | Dec 28 2024 | $487,612 | -$172,231 |
| 128 | Bristol-Myers Squibb | $112,522,223,616 | United States | Pharmaceuticals | 34,100 | $48,300,000,000 | -$8,948,000,000 | Dec 31 2024 | $1,416,422 | -$262,405 |
| 207 | Strategy (MicroStrategy) | $76,472,770,560 | United States | Technology | 1,534 | $463,456,000 | -$1,166,661,000 | Dec 31 2024 | $302,123 | -$760,535 |