


 Emmanuel Ifeanyi is a Financial Research and Platform Testing Analyst at BestBrokers.com, specialising in forex, stock and crypto trading. He is responsible for most of the site’s broker reviews, contributing detailed research and hands-on testing of trading conditions, fees, account types, available assets, usability and suitability for different types of traders.
Gone are the days when the mainstream media, the investing public, and financial regulators took Bitcoin as a joke. With a market cap of $1.84 trillion in April 2025 (only a few stocks are valued up to a trillion USD), Bitcoin can no longer be ignored. Its volatile nature, with double-digit percentage moves in a day, which used to be an issue, has become a major attraction for investors and the media, with many stories of sudden Bitcoin millionaires and billionaires adding to the fanfare.
Being the first cryptocurrency to grace the market, Bitcoin has become more stable compared to newer cryptocurrencies like Dogecoin and Shiba Inu. Still, it has enough volatility to entice day and swing traders who love quick profits.
You can find tons of information on Bitcoin and the cryptocurrency market online. But what you need is a detailed guide that focuses on the most important aspects of Bitcoin trading. That’s exactly what we offer you. In this guide, you will learn what Bitcoin is and the different methods of trading it.
| Bitcoin Trading Statistics | |
|---|---|
| Bitcoin Price History | |
What is Bitcoin?
Bitcoin is a cryptocurrency, a digital currency that is cryptographically secured through a decentralized peer-to-peer blockchain network. In fact, it’s the first one to emerge. It can be sent from one user to another without a middle-man, so it is not under the authority of a central bank.
Bitcoin is kept in digital wallets. A wallet consists of a public address the owner can use to receive bitcoins, and a private key acting as a password used to access the wallet. People can send bitcoins to each other via their public addresses, and each transaction is authenticated on the blockchain network by miners. What is more, miners are rewarded with new Bitcoins when validating transactions on the blockchain.

Bitcoin is traded as a security and can be exchanged for fiat currencies or other cryptocurrencies on crypto exchanges. Being a decentralized digital currency, its value against fiat currencies, such as the USD or the JPY, depends on demand and supply rather than on the policies of central banks.
Interestingly, some online merchants now accept Bitcoin as payment for their goods and services. However, due to the high volatility of cryptocurrencies, governments worldwide are still reluctant to recognize them as legal tender. Bitcoin has also been the subject of criticism due to its use for illegal transactions and high electricity consumption.
A brief history of Bitcoin
It was on October 31, 2008 that the Bitcoin whitepaper emerged online, written by “Satoshi Nakamoto” – a pseudonym used by the person or group of developers that invented Bitcoin. In January 2009, the Bitcoin source code was made public, allowing users to run nodes, mine, and send bitcoins freely.
Software developer Hal Finney, who created the first reusable proof of work system in 2004, became the first person to receive Bitcoin. He downloaded the Bitcoin software on the day it was released and received 10 bitcoins from Satoshi Nakamoto on January 12, 2009. However, the first known commercial use of Bitcoin took place in 2010 when programmer Laszlo Hanyecz paid ₿10,000 for two Papa John’s pizzas.
In early 2011, Bitcoin was trading at $0.30 per coin but later increased to $5.27 per coin. By June of the same year, Bitcoin was trading at around $31.50. However, it declined to $4.77 in the following months.
Bitcoin Foundation was created in 2012 to push for the improvement of Bitcoin and its adoption. Bitcoin has seen periods of outrageous volatility levels after its launch. Some coincided with crackdowns and criticism by the government, while others were precipitated by comments from influential social media personalities.

By 2017, the number of cryptocurrency wallets in use was over 5.8 million, and most of them were Bitcoin wallets. One key event that year was the introduction of SegWit (Segregated Witness) in August, a software upgrade that was intended to support and improve the scalability of the Lightning Network. Not everyone was satisfied with this upgrade, especially the supporters of large blocks. This led to the software hard fork that created Bitcoin Cash and Bitcoin Gold.
Bitcoin rose to an all-time high of $19,783.06 by December 2017, but with China banning its use, the price declined significantly in 2018 and 2019.
The year 2020 was a great one for Bitcoin as the Covid-19 lockdown caused many institutional investors to turn their gaze to cryptocurrencies. MicroStrategy purchased bitcoins worth about $250 million as a treasury reserve asset and inflation hedge, while the Massachusetts Mutual Life Insurance Company announced that it would invest about $100 million. Also, Block, Inc. (formerly Square, Inc.) invested 1% of its total assets ($50 million) in Bitcoin, while PayPal added Bitcoin to its services for US users.
All this led to a massive rally in Bitcoin in late 2020. By the end of November the same year, Bitcoin had broken its December 2017 high. In January 2021, Elon Musk’s tweet pushed Bitcoin prices to over $37,000. When Tesla announced on February 8, 2021 that it had purchased $1.5 billion worth of Bitcoin and planned to start accepting it as payment for its vehicles, the price of the cryptocurrency hit the roof, rising to the then all-time high of over $64,000. However, on May 12, 2021, Tesla reconsidered its decision due to concerns that Bitcoin mining was contributing to carbon emissions and climate change. This triggered a deep pullback in Bitcoin prices.
In June 2021, El Salvador’s legislature voted to make Bitcoin legal tender, and the legislation was signed into law on September 7. Another key event in June was the approval of the Taproot network software upgrade, which was installed in November.
In October 2021, the US SEC approved the ProShares Bitcoin Strategy ETF, a cash-settled futures exchange-traded fund (ETF), as the first Bitcoin ETF in the US. The ETF gained 5% during its first trading day on October 19, 2021. In May 2022, rival blockchain Terra and its native coin LUNA suffered a sudden collapse, inciting panic in the market. As a result, Bitcoin prices plummeted by a whopping 60% from their peak in November 2021, dropping to $26,000.
Resilient as ever, Bitcoin managed to recover in the following years. The world’s first cryptocurrency recently celebrated yet another milestone after the SEC okayed the first spot BTC exchange-traded funds in early January 2024. Two months later, Bitcoin rose to its highest price to date, surpassing $73,000 in value in March 2024.
The highly anticipated fourth Bitcoin halving took place in April 2024, further reducing the rewards for miners. The continued impact of the spot Bitcoin ETFs approved earlier in the year influenced market dynamics, contributing to price volatility and a rally that saw Bitcoin prices exceed $90,000 in April 2025. The success of these ETFs spurred discussions and filings for exchange-traded funds based on other cryptocurrencies, signaling a potential evolution in regulated crypto investment products.
Uses of Bitcoin
Bitcoin is a virtual currency that is not controlled by any central authority. That fact alone makes it very useful as you are soon to find out.
While there are many uses of Bitcoin, the most popular ones are as follows:
 A means of exchange – People use Bitcoin to buy goods and services from online merchants that accept it as a form of payment. The number of such merchants is increasing by the day. In fact, most users consider it a currency that can be used to pay for any product, including physical and virtual arts. However, while the use of Bitcoin as a means of exchange is gaining popularity among people, it is only El Salvador that has adopted it as legal tender.
 A tradable security – For most people, including financial regulators like the US SEC, Bitcoin is a tradable security. What this means is people can buy and sell it for speculative purposes. As with all tradable securities, the Bitcoin price rises and falls, so it offers opportunities for speculation. Expectedly, there is a growing interest in Bitcoin trading among various security traders and investors.
 A store of wealth – Many investors see Bitcoin as a store of wealth and a worthy alternative to gold. As a result, they use it as a hedge against inflation. Some use it to hide their assets from their spouses or the government. Bitcoin also makes it easy to transfer assets across borders.
The size of the Bitcoin market
According to TradingView, the cryptocurrency market is valued at $2.85 trillion at the time of publication and Bitcoin accounts for nearly half of this impressive amount. Bitcoin’s market share has risen by over 15 percentage points since April 2024 when it stood at around 48%, as investors’ interest in cryptocurrencies continues to increase. Additionally, there is a higher interest in tokens, non-fungible tokens, Decentralized Finance (DeFi), and games.
Bitcoin prices hit an all-time high in April 2025 when they exceeded $94,000. Currently trading at around $93,017 and with about 19.86 million bitcoins in circulation, the Bitcoin market capitalization is about $1.84 trillion on April 24, 2025, this is more than the market value of many US tech giants like Meta (formally known as Facebook) and Tesla.
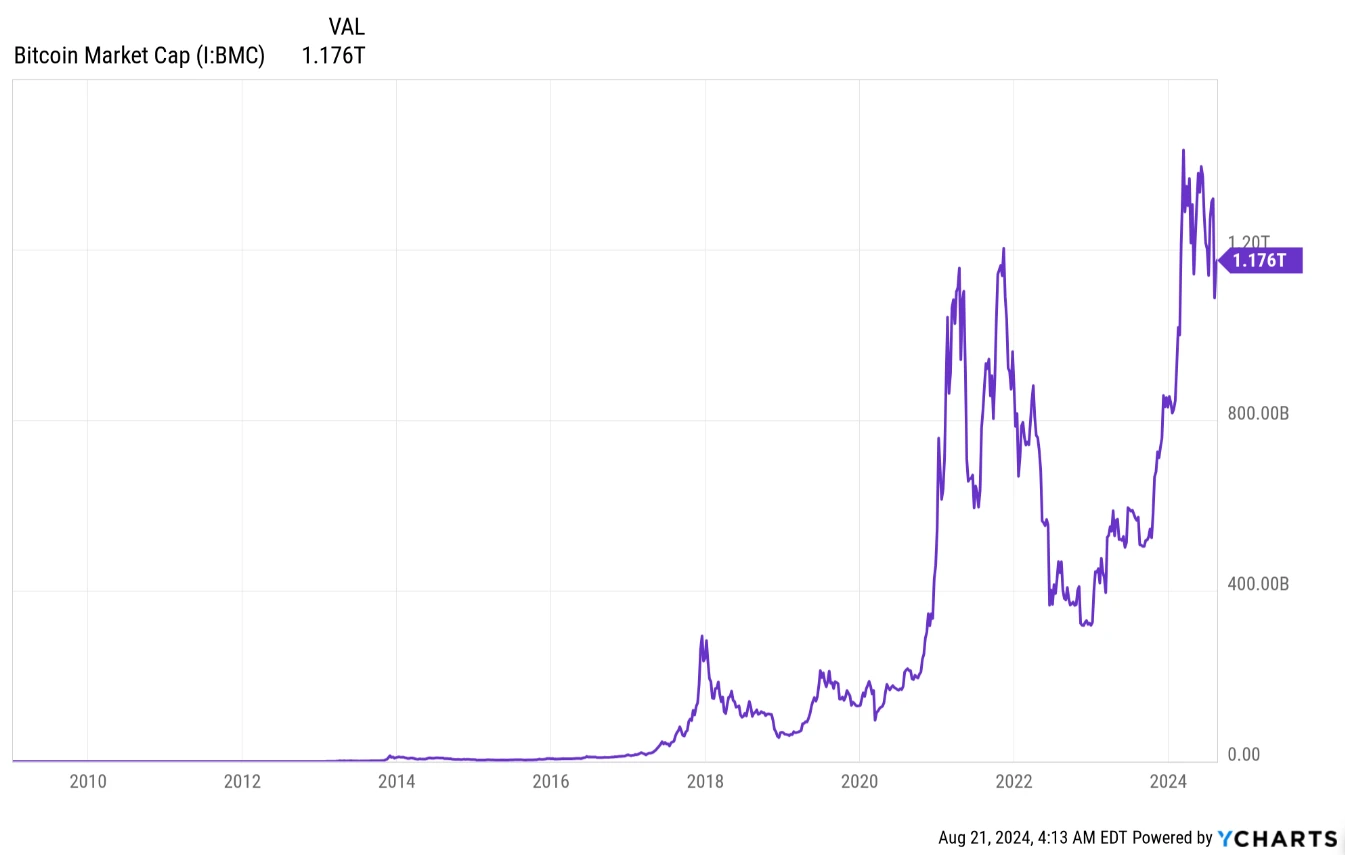
All-time data of Bitcoin’s market capitalisation. Source: YCharts.com
The market dominance of Bitcoin is hovering around 64.41% at the time of writing this guide, according to data pulled from TradingView.
How to participate in the Bitcoin market
Basically, there are two main ways to gain exposure to the Bitcoin market:
- Investing in Bitcoin
- Trading Bitcoin or any of its derivative products
What is Bitcoin investing?
Bitcoin investing, also known as HODLing (Holding on for Dear Life), refers to buying Bitcoin and holding it for a long time to benefit from a potentially huge price increase over the long term. This is different from Bitcoin trading, where the aim is to profit from short-term price movements.
Just like investing in any other asset, investing in Bitcoin requires patience and the ability to ignore short-term price movements. An investor buys with the hope that the price will increase over time, but naturally, the price can drop for some time before it appreciates. The volatility in Bitcoin can be enormous, it is not uncommon for the price to drop by 50% or more. In fact, this already happened in May 2022 when Bitcoin lost over 60% of its value compared to November 2021.
Since the price of Bitcoin tends to rise over time, despite the many booms and bursts, Bitcoin investors seek to accumulate profits by buying and holding the asset for a long time without minding what happens in the short term. They believe that mainstream financial institutions will eventually embrace Bitcoin and it will become legal tender.

Experienced Bitcoin investors use many techniques to reduce the effects of volatility in their holdings. Some practice what is known as dollar-cost averaging (DCA), they invest a certain amount every week or month, whether the price is rising or falling. Their true entry price becomes the average of the various prices at which they bought in. Another approach is buying only the dips. Those who follow this approach increase their holdings anytime the Bitcoin price declines by a certain percentage, say 30% or 50%. Many have made good money by following these techniques.
Unfortunately, some naive investors see Bitcoin as a get-rich-quick instrument. But unless one is exceptionally lucky, making money from Bitcoin investing is a long-term thing. It is just like investing in stocks or other assets; nothing is guaranteed, which is why it is advisable to invest disposable income (money that is not intended for personal upkeep or paying bills).
Advantages and Disadvantages of Bitcoin investing
There are many advantages of participating in the Bitcoin market. When planned well and done with utmost caution, it can be highly rewarding. Compared to short-term trading, HODLing offers the following benefits:
Key Pros
- It is an easy way to build wealth over time
- Little or no trading skills is required - you don’t need to know how to time the market (if that is even possible)
- It requires less screen time - you don’t need to keep analyzing the price chart
- You don’t bother about short-term price swings: less emotional engagement
- It may be more profitable over the long term.
- You have enough time to focus on your job or business
- It incurs less trading costs and commissions
- Lower or no capital gains taxes
Key Cons
- It is not suitable for the impatient and people with low risk tolerance
- Bitcoin may eventually become worthless, and you lose your trading capital.
What is Bitcoin trading?
While investing might be suitable for some people, it might not be appropriate for those who have a huge appetite for fast profits and love the buzz and thrill that come with short-term price movements. For such people, short-term trading is the only way to feel the pulse of the market.
Bitcoin trading refers to the process of frequently buying and selling coins to profit from short-term price movements. Generally, trading is a fast-paced activity, but with the kind of volatility in Bitcoin, it seems even faster and more exciting. The price can move by a double-digit percentage in a day, and the market never sleeps. Bitcoin trades round the clock, 24 hours a day and 7 days a week, on cryptocurrency exchanges around the world. So, for ultra-short-term traders (scalpers and day traders), there is never a dull moment.
The objective of every Bitcoin trader is to buy when the price is low and sell when the price is high. To elaborate on this, when traders buy Bitcoin at a lower price, it means they are paying a low amount of fiat currency (dollars, euros, or pounds) for a given amount of Bitcoin. Then, when they sell at a high price, they will receive more fiat currency. For example, let’s say a trader purchases 10 bitcoins at $92,700 per coin, so they pay a total of $927,000 for the transaction. Later in the day or the next day, the price rises to $93,400 per coin. If the trader sells all their bitcoins at that price, they will get $934,000, thereby making a net profit of $7,000 ($934,000 – $927,000 = $7,000).

As with any tradable security, Bitcoin price movements can be erratic (random walk) and difficult to predict. While many believe that Bitcoin is easier to trade than other securities, traders will find that timing the market is difficult, investing (HODLing) seems better, as it is almost impossible to find a trader that has performed better than a HODLer in Bitcoin’s 16 years of existence.
Despite the erratic nature of the price movements, one thing is clear: Bitcoin is highly sensitive to news and social media sentiments. To stand a chance at timing the market, a trader needs to follow the news, market events, and social media trends.
Most cryptocurrency exchanges allow traders to trade spot Bitcoin and derivatives like Bitcoin futures and options. People who trade the spot market cannot use leverage, but those who trade derivatives can. Leveraged trading refers to opening larger positions in Bitcoin with a smaller initial investment. Due to Bitcoin’s volatility, traders who use leverage face more risks than investors.
Key Pros
- The potential to make quick profits
- The ability to trade Bitcoin futures and options with leverage to increase profits. Keep in mind leverage can also magnify one’s losses.
- Does not require a large amount of capital to begin
- The ability to short-sell (Bitcoin futures and options)
- You can trade whenever you want – the market does not close
Key Cons
- Timing the market is a near-impossible task
- Volatility can cause you to lose more money, especially if trading with leverage.
- Gains are taxed as short-term capital gains.
Bitcoin trading vs. investing: which is better?
Trading vs. investing has always been a hotly debated topic, and it is the same when it comes to Bitcoin. While some favor investing, there are those who prefer trading. It depends on the individual’s personality and what they want. Each has its merits and demerits.
Below are some differences between trading and investing:
| Trading | Investing |
|---|---|
| Short to medium term approach | Long term approach |
| Affected by price volatility | Does not care about price volatility |
| Requires less patience | Requires a lot of patience |
| Frequent tax filing due to high-frequency trading | Less frequent tax filing because the asset is held for a long time |
| Requires less capital | Requires large capital |
| Technical knowledge is needed | Technical knowledge is not obligatory |
Types of Bitcoin markets
Whether you are a trader or an investor, you must determine what kind of market you want to involve yourself in. While there are different Bitcoin markets, the most popular one is the spot market, followed by the futures market (which comprises the perpetual and quarterly futures), and lastly, the options market.
Bitcoin spot market
In simple terms, the Bitcoin spot market is traded on the spot, you perform real-time trades with other users. When you trade in the spot market, you get immediate delivery of what you purchased in your wallet. The spot market offers you the exact value of Bitcoin you pay for, there is no leveraged size or strike price.
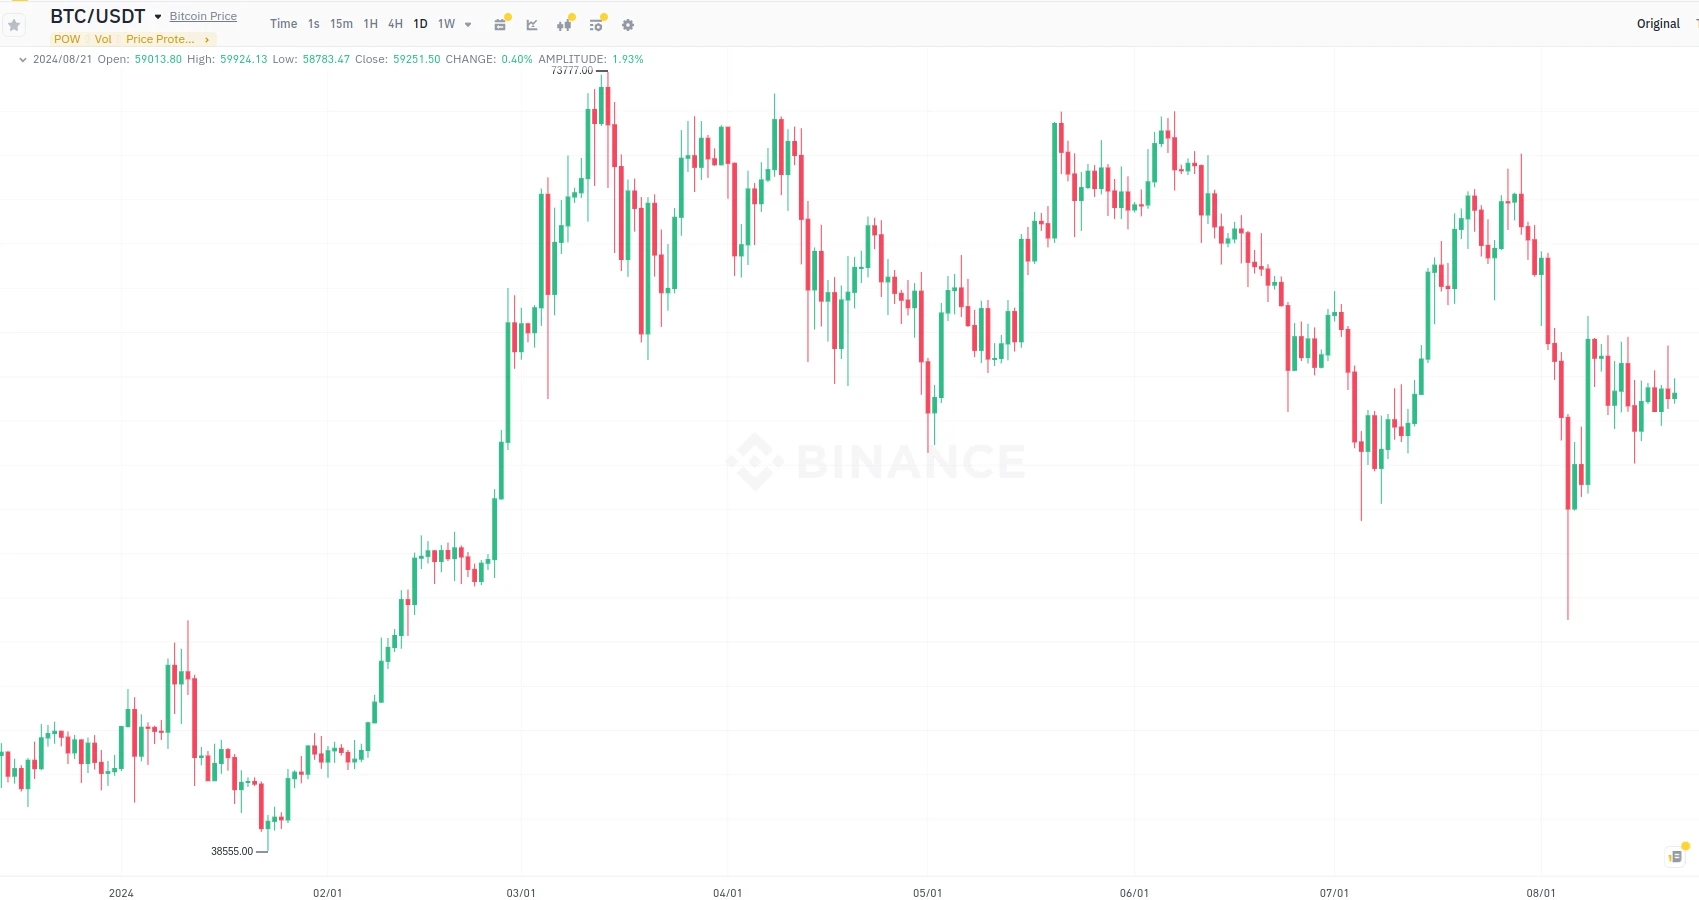
Spot market chart of Bitcoin. Source: Binance
The Bitcoin spot market is highly liquid, so the exchange matches your orders immediately, and the trade is settled at once. This is the most basic form of Bitcoin trading that involves the direct purchase of coins at current market prices. Crypto exchanges act as mediators between market participants, matching their bid and ask orders. Buying cryptocurrencies like Bitcoin on the spot with fiat currencies is also an option.
You buy Bitcoin at its current price to potentially make a profit when its value appreciates. If the asset gains, your holdings gain what the asset gained, and if the asset declines, your holdings decrease by the same amount the asset lost. In traditional spot trading without leverage, you never realize a loss unless you sell, and your holdings never get wiped out unless Bitcoin loses all its value and becomes completely worthless.
To illustrate this, let’s use the following example. Suppose you place a buy limit order for 5 Bitcoins at $91,000 per coin. If the market falls to that price mark, your order will be filled, and you will receive and own 5 Bitcoins in your spot wallet.
The value of your asset increases or decreases proportionally to the Bitcoin price. If the latter increases by 2% to $92,900, the value of your holding also increases by 2%. On the other hand, if the Bitcoin price decreases by 3.3% to $88,000, the value of your holding also declines by 3.3%, but you will not suffer a 3.3% loss unless you sell all your coins at that point. If you hold onto your Bitcoin, the price might turn around and regain all the losses and make you some profits. Also, your account will never get a margin call or get liquidated, your holdings can only get wiped out if Bitcoin makes a 100% decline (or your account gets hacked).
Bitcoin spot trading usually involves using your own assets, although trading on margin with leverage is also possible in some cases. Nevertheless, we should warn you that leverage ratios for the spot market are typically lower and you may incur higher commissions.
Note that both traders and investors use the spot market. While traders frequently open and close many trades to make quick profits, investors just accumulate positions from time to time. Trading may be profitable, but the frequency of transactions comes with higher trading costs.
Key features of the spot market
- Trades are settled at the current price, also known as the spot rate or spot price.
- Assets are delivered immediately and not delayed until a future date.
- Funds are transferred instantaneously.
- Spot traders usually use their own assets rather than borrowing extra funds with leverage, although spot trading on margin is sometimes an option.
Strategies for trading the spot market
There are different strategies for trading the spot market but none is the Holy Grail. The crypto markets are full of uncertainties, and price movements tend to be erratic most of the time.
Nonetheless, below are the two most common approaches applicable to trading Bitcoin on the spot market.
Buying the dip
This refers to buying the asset when the price makes a deep pullback. It offers a way of entering the market at a fair price instead of buying into an already-rising market. When executed properly, buying the dip can prove to be a profitable strategy.
Bitcoin daily chart. Source: Binance
Both traders and investors use this method. But traders often use many indicators to determine where and when the pullback would reverse so as to get a better entry price.
So how do you buy the dip?
Amateur traders often make the mistake of buying anytime there is a price drop. While there is no definite rule as to when to buy a dip, here are some useful tips:
First, determine if it is just a temporary market pause or a trend reversal. The market follows a pattern sometimes, a normal pullback rarely gets lower than the preceding pullback, while a trend reversal is often associated with a lower low and a lower high.
You can use indicators to support your market analysis to avoid buying into a bearish market. Indicators like the relative strength index (RSI) can be used to spot extreme conditions (oversold and overbought levels) in the market.
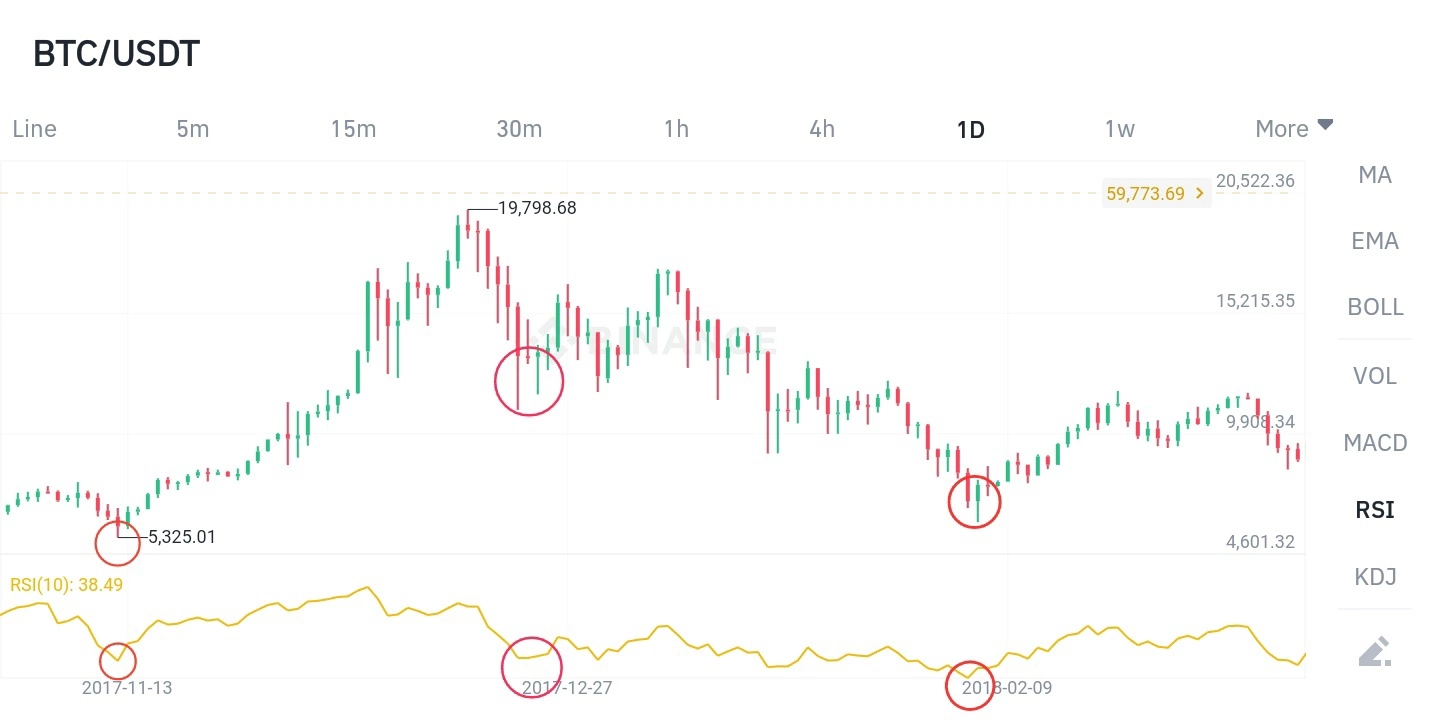
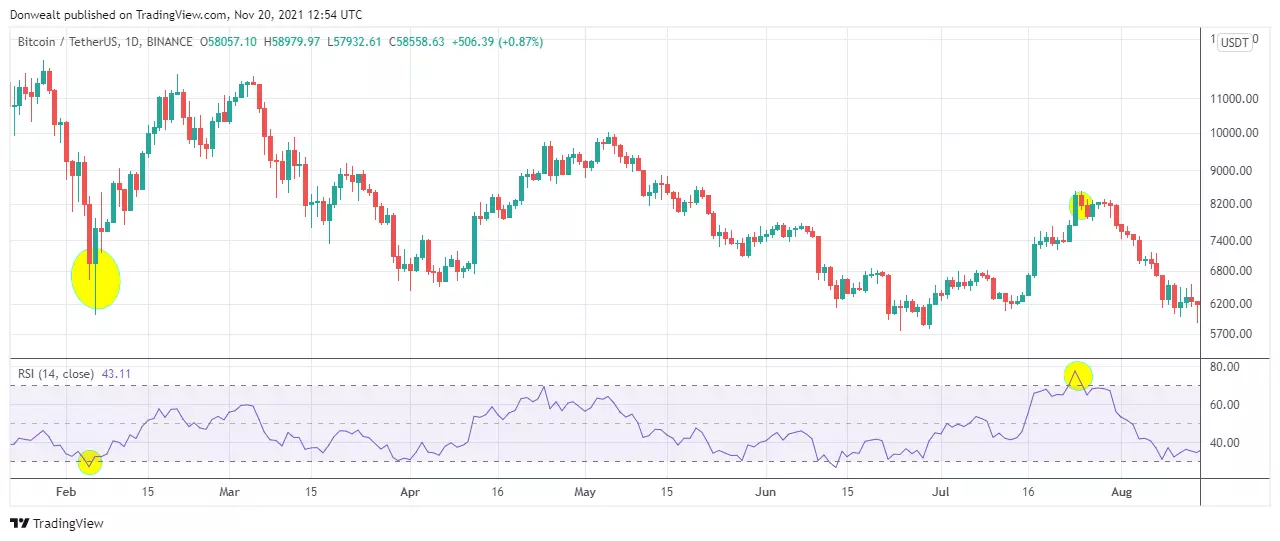
Bitcoin daily chart Source: Binance
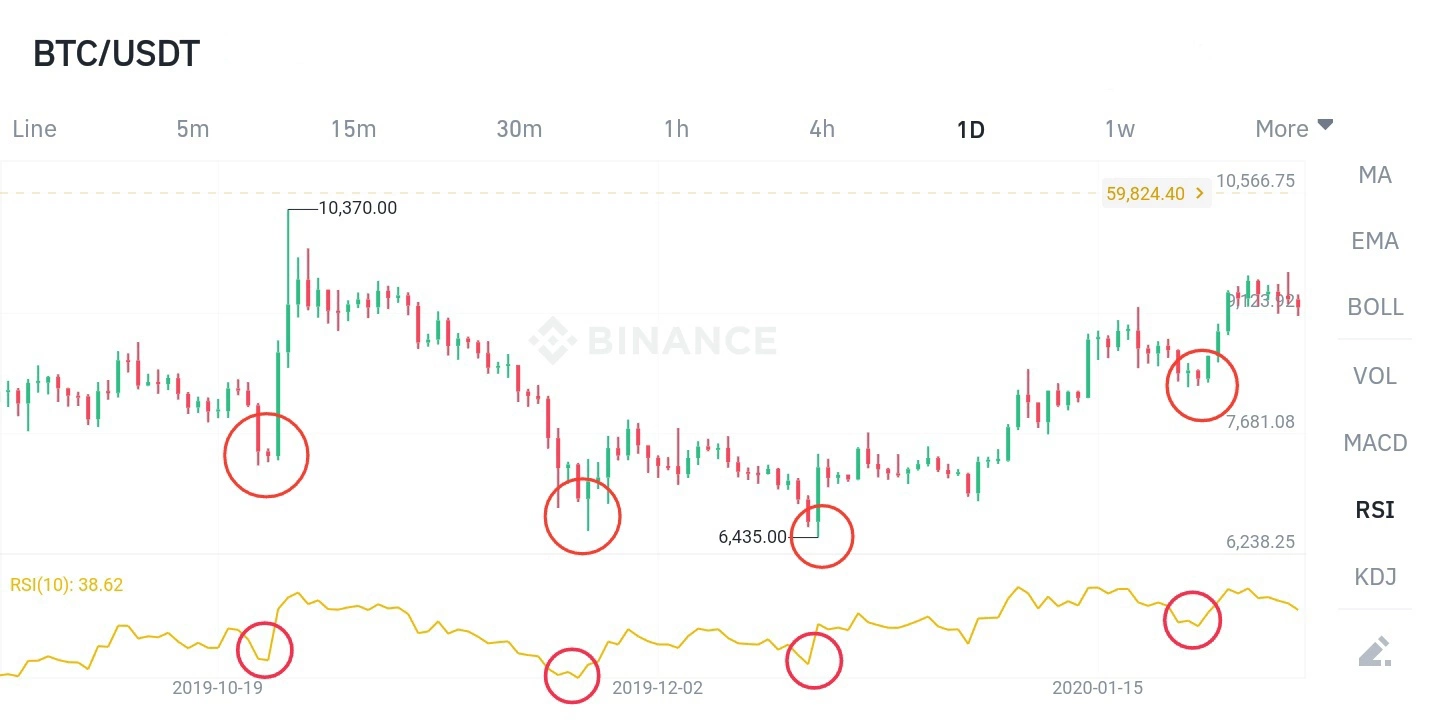
Bitcoin daily chart. Source: Binance
The above charts are Bitcoin daily charts with the relative strength index indicator. The ellipses on the price and indicators show when the price of Bitcoin dipped and the indicator reading was extreme. Some traders buy the dip when the RSI is below 30 (oversold). However, since indicators rely on past data, you must be careful as to how you use them.
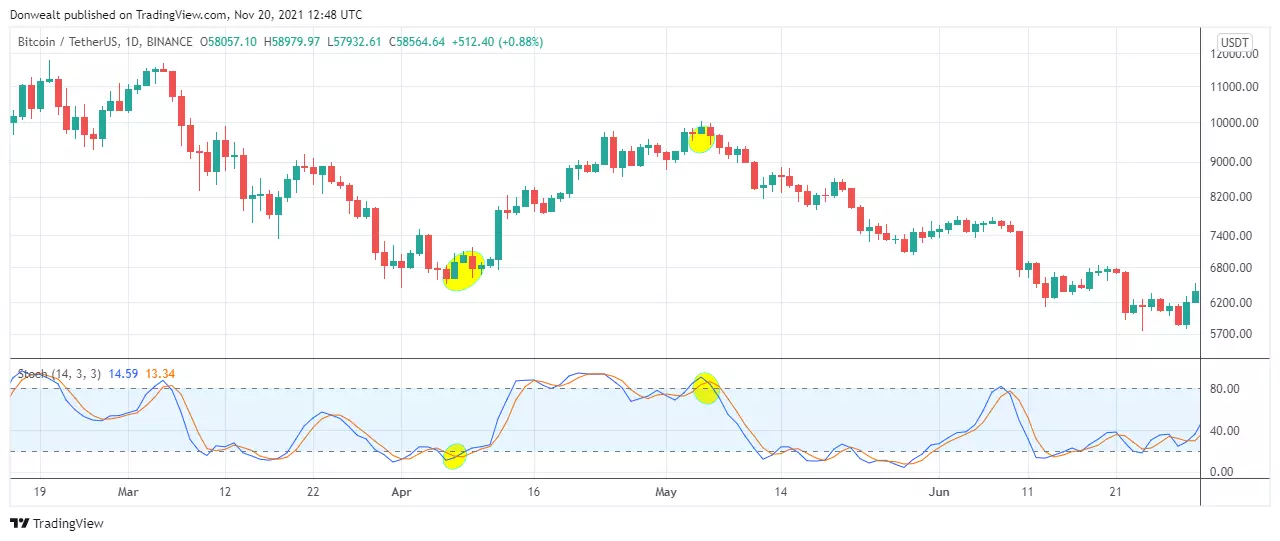
The chart below shows the stochastic. Notice that the dips reversed after the stochastic went into the oversold region. The current dip may reverse when the stochastic is in the oversold region again.
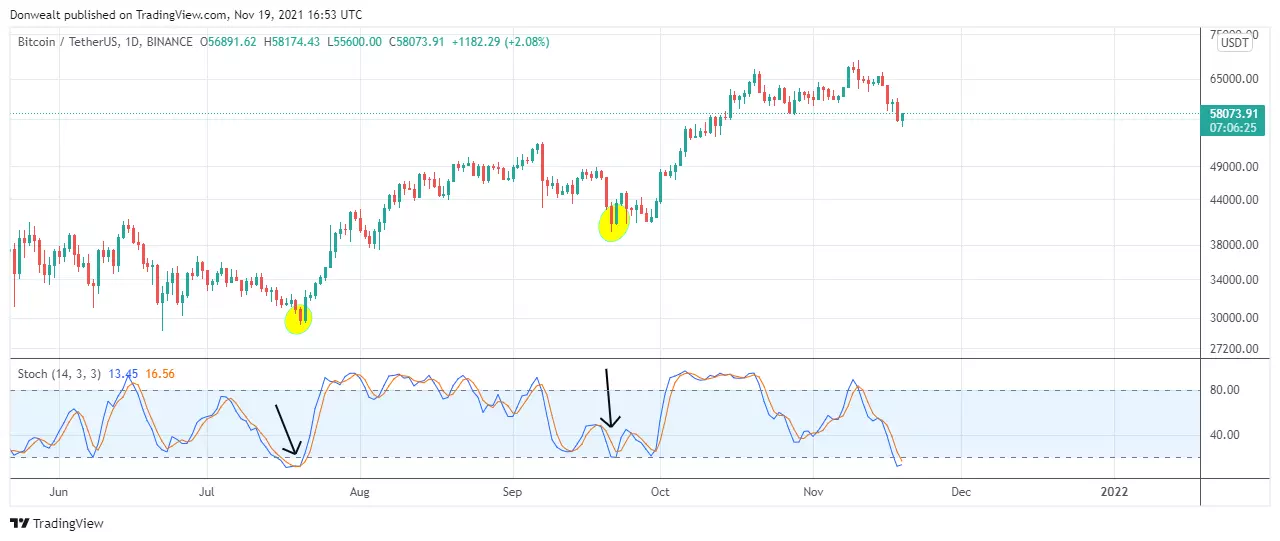
TradingView: Daily chart showing stochastic
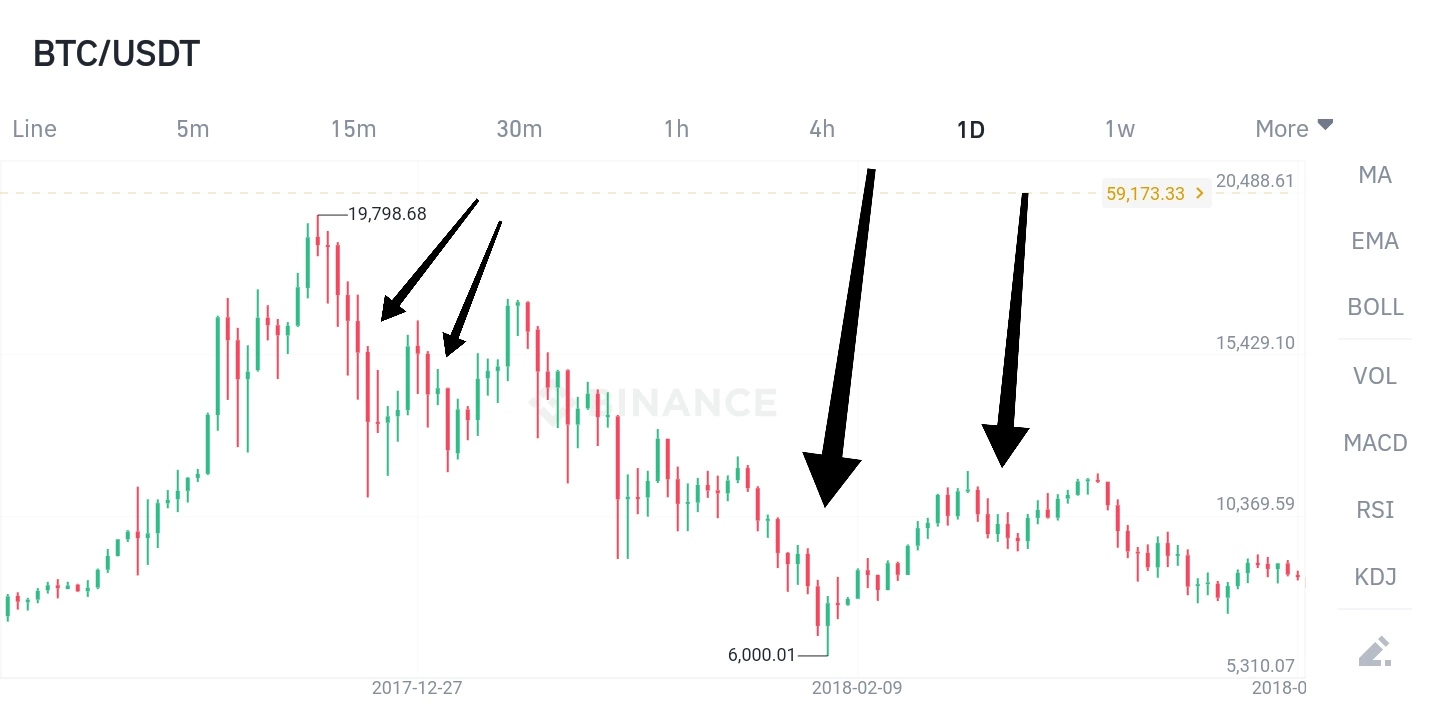
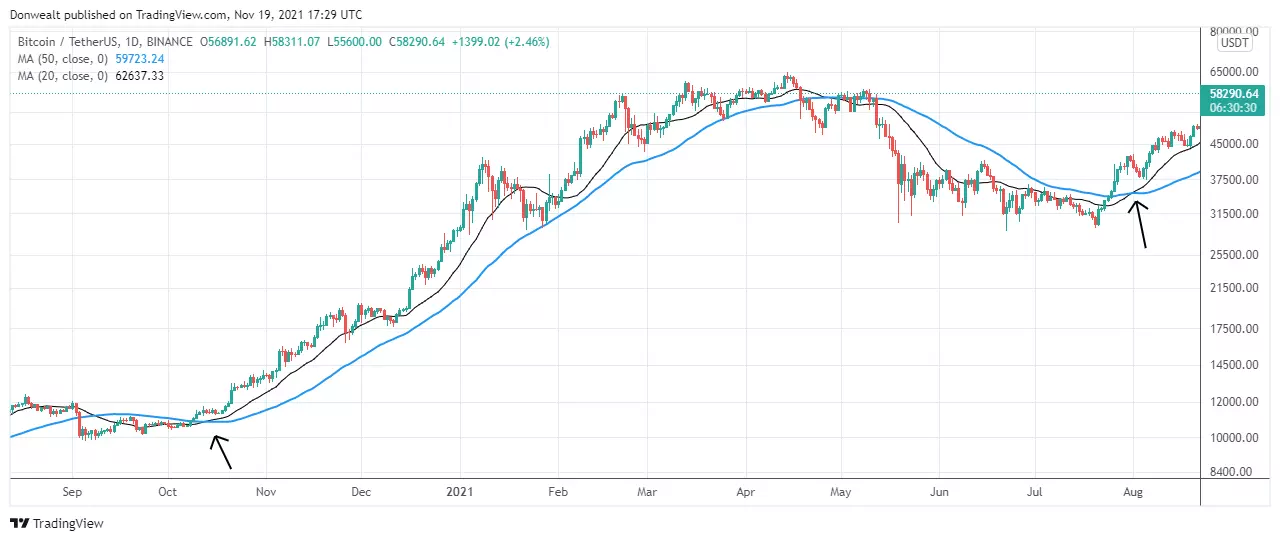
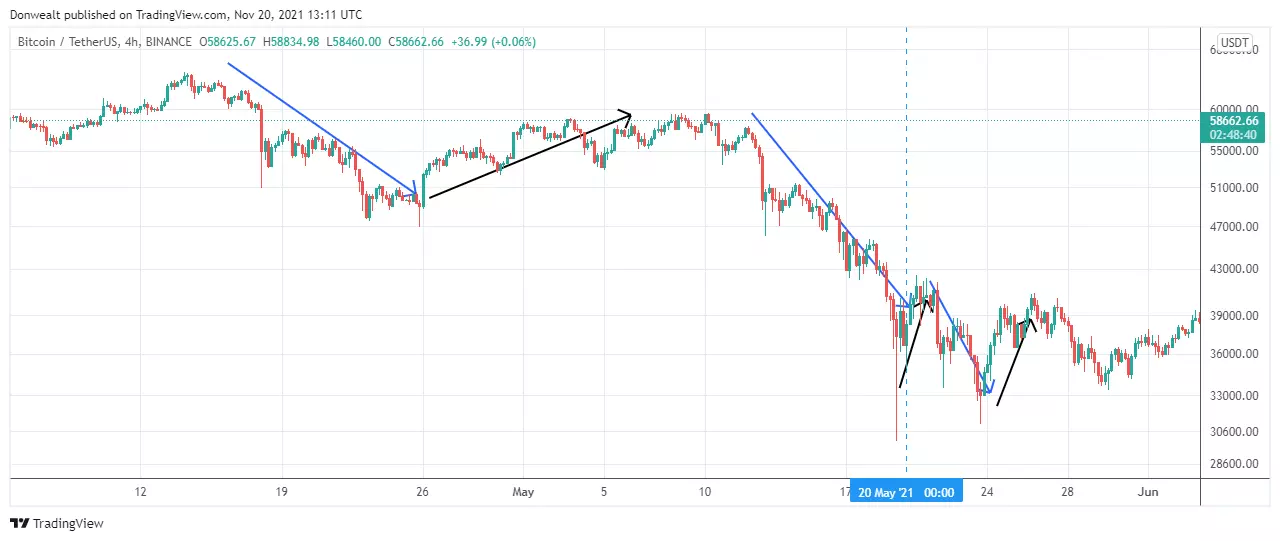
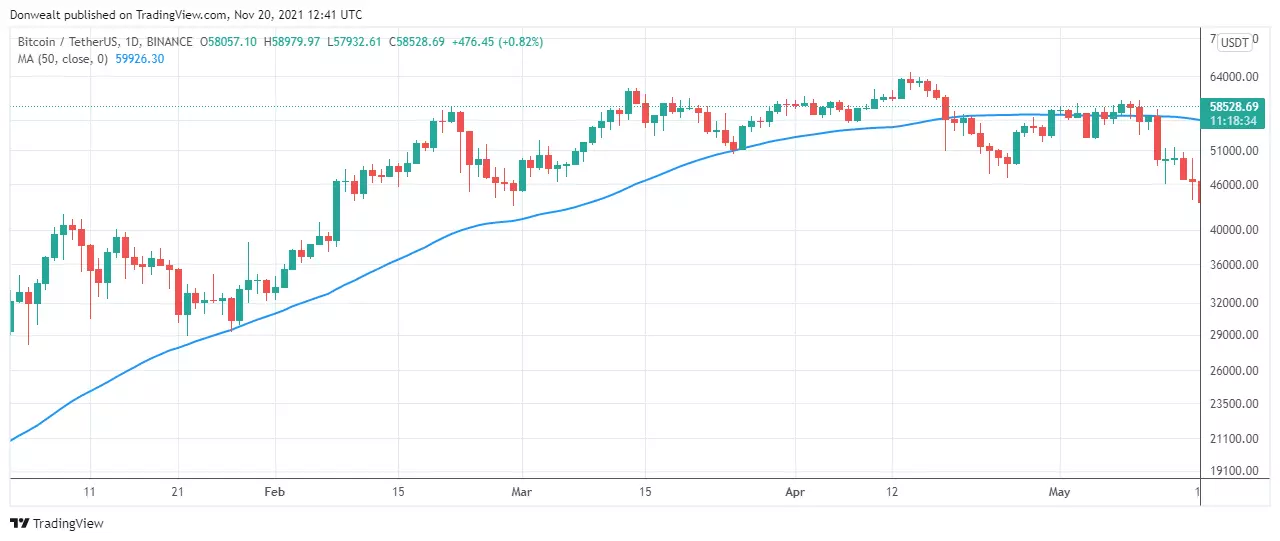
Second, you can apply trend lines or moving averages to get an idea of the trend before using the momentum indicators or oscillators to track the dips. See the chart below.
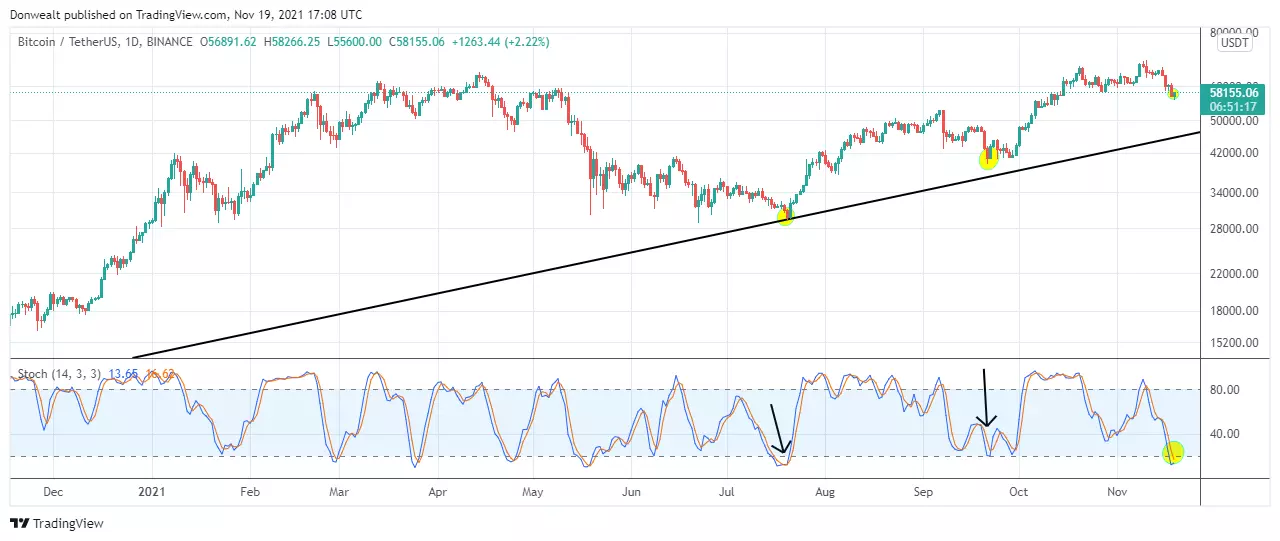
For a multi-legged pullback, you can use a countertrend line to gauge when the price has finally reversed to resume the uptrend. In this case, the price would break the countertrend line, as in the chart below (black arrow).
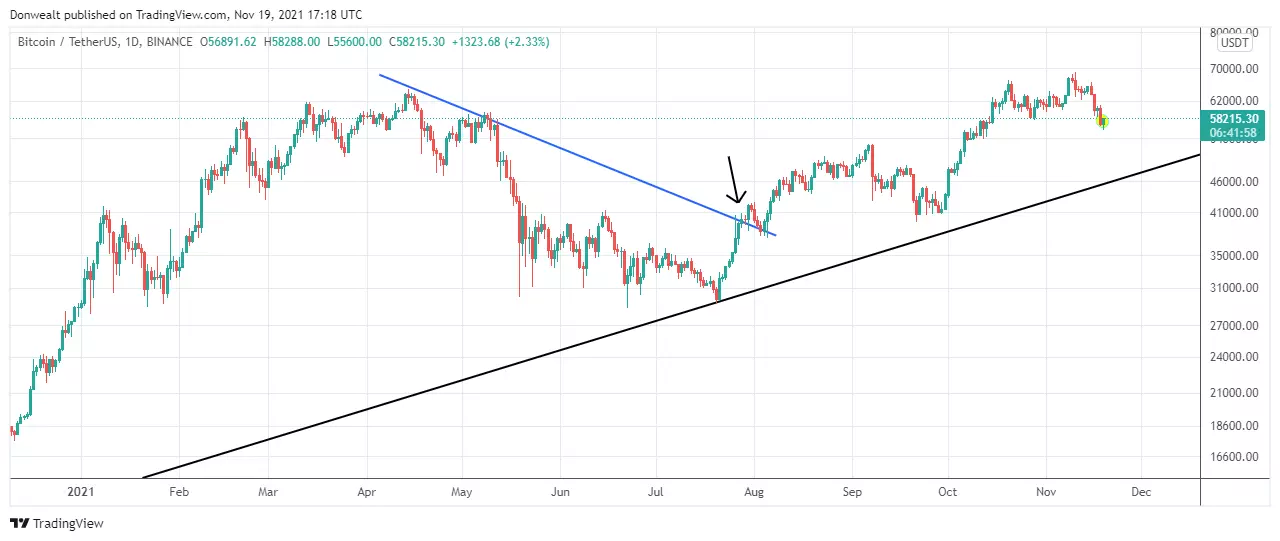
Daily chart of Bitcoin. Source: TradingView
Third, watch out for the beginning of a new trend. After a prolonged dip, it may be wise to use a moving average crossover to determine when a new uptrend is appearing. In this case, you look for a golden cross, when a shorter-period moving average crosses above a longer-period moving average. See the chart below: the 20-period (black line) moving average crossed above the 50-period (blue line) moving average. Notice that the two times it happened (black arrows), the uptrend resumed.
Selling the pump
So far we have discussed buying the dip but what happens after buying? If you are a short-term trader, you have to take profits, or sell the pump as it is popularly known. Just like buying the dip, there are also parameters or conditions a trader can use to take profit at an ideal spot price. With the help of indicators, a trader can identify a potential pause or reversal in the market and close their trade.
So what indicators can you use?
There are a handful of indicators traders use to identify a possible market top, they are not perfect though. The popular indicators for this include moving averages, the relative strength index (RSI), and Bollinger Bands. Other non-indicator strategies that can be employed are candlestick patterns, chart patterns, market structure, and trend lines.
Note that using one indicator alone might not be enough – combining indicators (as many as two or three) may be a better option. Be sure to use indicators that complement each other.
You may use moving averages and relative strength index indicators. The chart below shows the market tops and potential points to take profit.
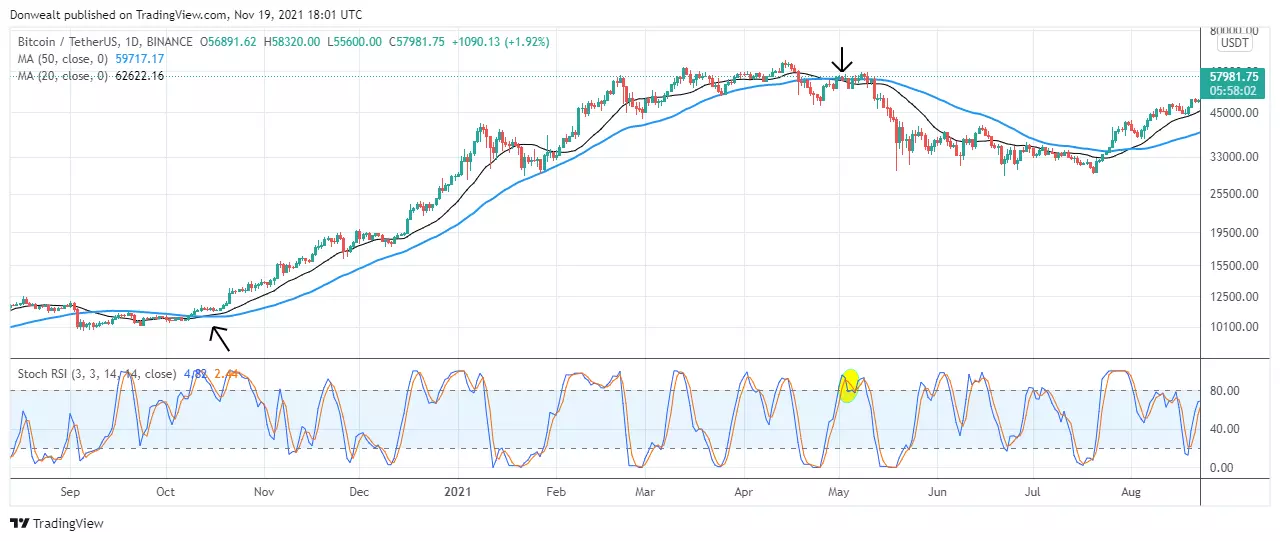
Bitcoin daily chart. Source: TradingView
The above chart shows a moving average dead cross where the shorter-period (20) moving average has crossed below the longer-period (50) moving average, signifying a potential price reversal and a possible market top. Below the price chart is the stochastic-RSI showing an overbought market (above 80). With these signals, it may be wise to sell and take profit if you are a short-term trader.
Another strategy you can use to determine the potential market top is the appearance of candlestick patterns, such as the bearish engulfing, a big bearish candlestick that engulfs the preceding day’s bullish candlestick. See the chart below.
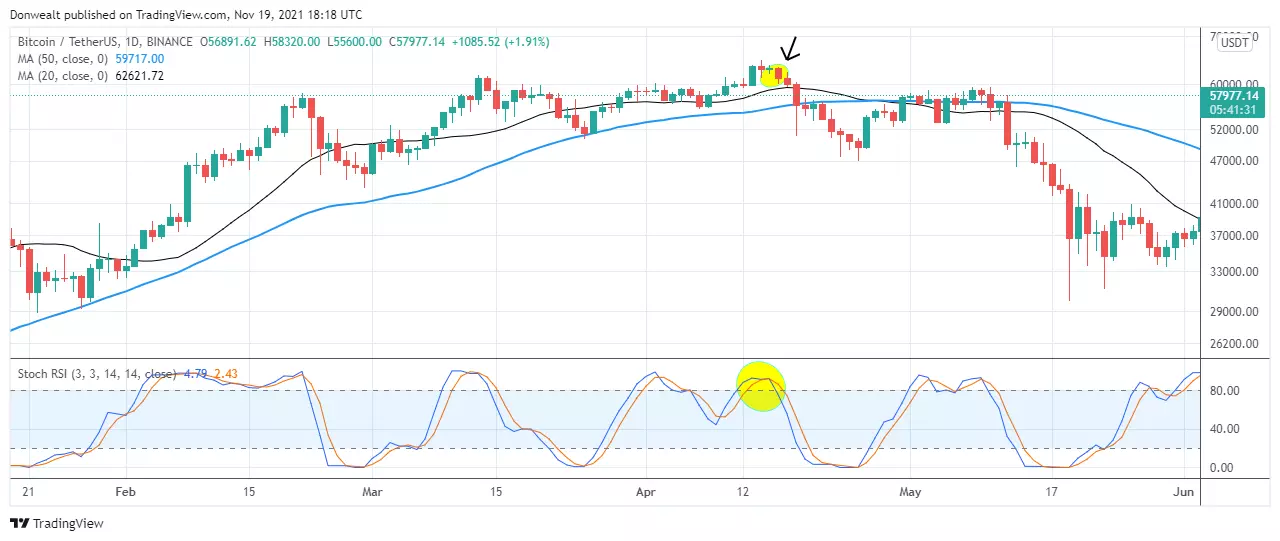
Bitcoin daily chart. Source: TradingView
Notice that the moving average dead cross was yet to occur when the engulfing candlestick pattern appeared. However, the combination of the bearish engulfing pattern (black arrow) and the overbought signal (ellipse) on the stochastic-RSI indicator is enough to assume a potential market top and take profit.
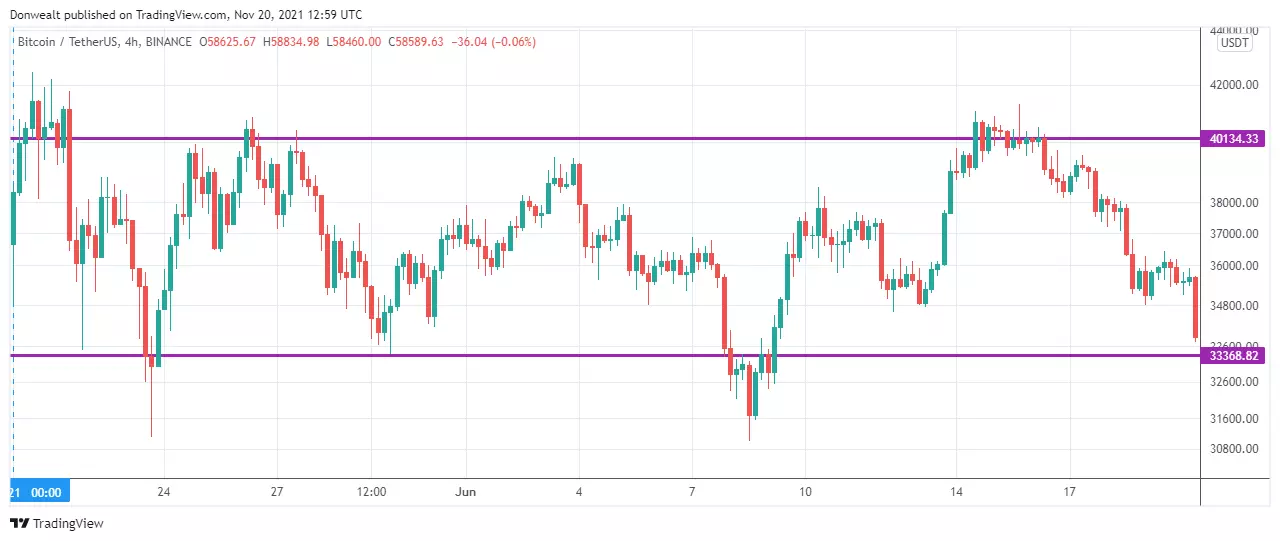
Lastly, the Bollinger Bands can be very useful in determining a potential market top. It consists of two bands (upper and lower, each 2-standard deviations away from the mean) and a middle line which is a 20-period moving average that indicates the mean. The two bands expand and contract in relation to market volatility. When the price is repeatedly touching the upper band, it is most likely that the price may be about to retrace. See the chart below.
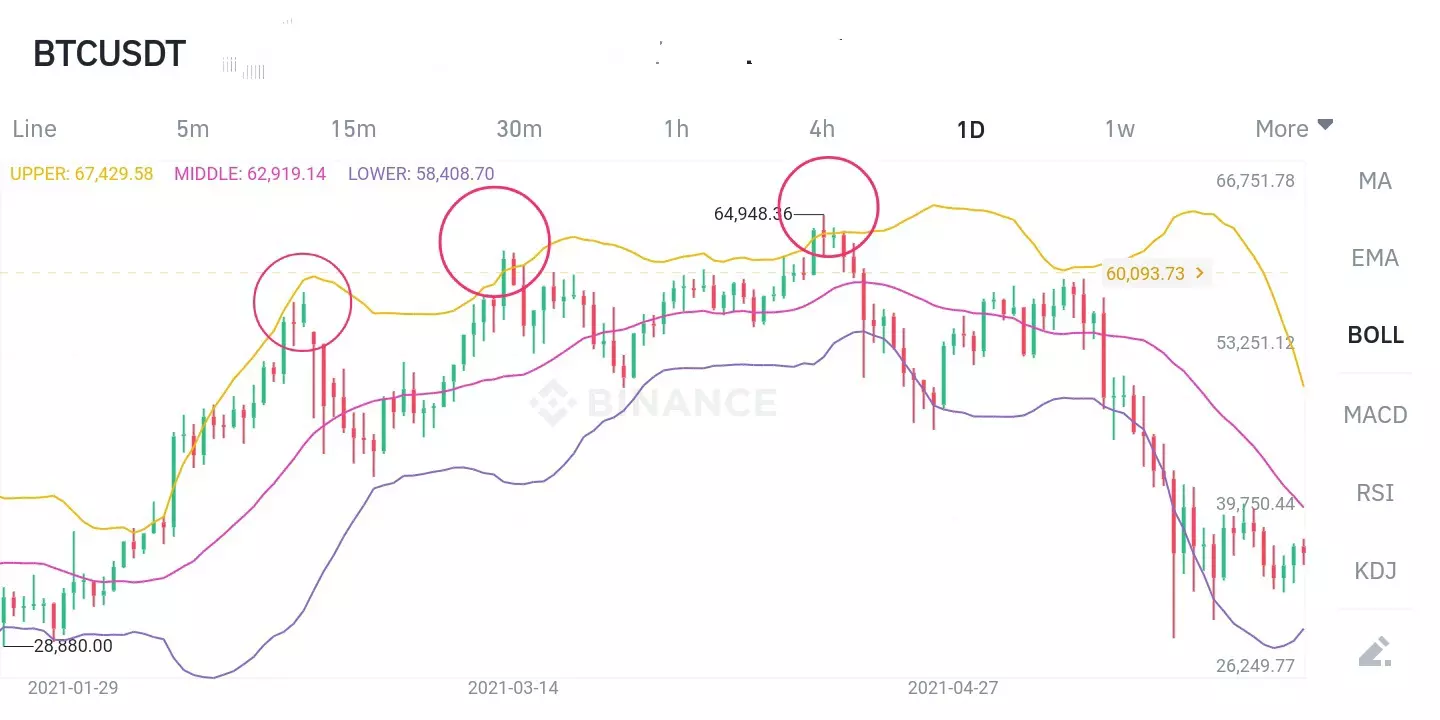
Bitcoin daily chart. Source: Binance
As you can see, indicators can be very helpful when trading the Bitcoin spot market. Having said that, let’s take a look at the pros and cons of trading the spot market. See the table below.
| Advantages of spot market | Disadvantages of spot market |
|---|---|
| There is transparency in pricing; your holding gains whatever the asset gains and declines proportionately to the asset. | It is your responsibility to keep your assets in a secure wallet to prevent the risk of theft and hacks. |
| It is easy to trade. | You can only go long, so you make profits only when the price of the asset appreciates. |
| The fear of liquidation is eliminated. | You cannot benefit from a bear market or use excessive leverage to improve profits. |
| You do not have to worry about margin calls. | The potential profit in spot trading is less than that of futures or margin trading. |
| It is less risky compared to the futures market. | It requires substantial capital to be able to make tangible profits. |
If you want to improve your profit potential and can handle huge risks, you may want to consider Bitcoin futures, which we explain in the next section.
Bitcoin futures market
The futures market allows a trader to bet or speculate on future prices without owning the underlying assets. Bitcoin futures are contracts that allow traders to trade Bitcoins without owning them. The contracts track the future price of Bitcoin. For a futures contract to be valid, two or more parties need to participate, one on the long side of the market and the other on the short side of the market.
For example, Jim places an order to buy (go long) 5 contracts of Bitcoin at $93,000 per contract. On the other side of the market, Ted places an order to sell (go short) 5 contracts of Bitcoin at $93,000 per contract. The market will automatically match these two orders, and a trade happens. If the price of Bitcoin moves to $94,000 per contract, Jim will make a profit of $5,000 ([$94,000 – $93,000] x 5 contracts). Ted, on the other hand, will lose $5,000 because the price of Bitcoin did not go as he speculated.
The good thing about the futures market is that a trader must not have the face value of the contract to initiate a trade; they only need to have a fraction of it (the initial margin), and the exchange will lend them the rest. So, the trader is using what they call leverage. With leverage, the trader can open a much larger position than what their budget can cover; the exchange lends them money to complement their available capital and open a larger position. This is unlike what happens in the spot market where the trader needs to put up the face value of the underlying asset or purchase the amount their balance can cover.
Leverage is a double-edged sword; on one hand, it can increase your profits significantly if the market conditions are in your favor, but it can also magnify your losses if the market moves against your position.
Different leverage ratios are available at crypto exchanges. Each leverage ratio has an initial margin requirement (the amount you must have in your account to be able to use that leverage), which is often inversely related to the leverage. For example, you will likely see numbers like 1:5, 1:10, 1:20 and 1:100. The table below shows what they mean in terms of the initial margin requirement.
| Leverage | Initial Margin Requirement |
|---|---|
| 1:5 | You need to deposit 20% of the face value of the futures contract. |
| 1:10 | You need to deposit 10% of the face value of the futures contract. |
| 1:20 | You need to deposit 5% of the face value of the futures contract. |
| 1:50 | You need to deposit 2% of the face value of the futures contract. |
| 1:100 | You need to deposit 1% of the face value of the futures contract. |
Types of futures contracts
On Binance, by far the largest cryptocurrency exchange with a daily spot trading volume of $17.06 billion in late April 2025, there are two types of Bitcoin futures contracts: perpetual futures and quarterly futures contracts.
Perpetual futures
These are futures contracts that do not have an expiry date. Traders with open positions pay a daily funding fee to roll over their futures contracts to the next trading day. These contracts track the physical market closely, but there is a slight price difference between the two markets.
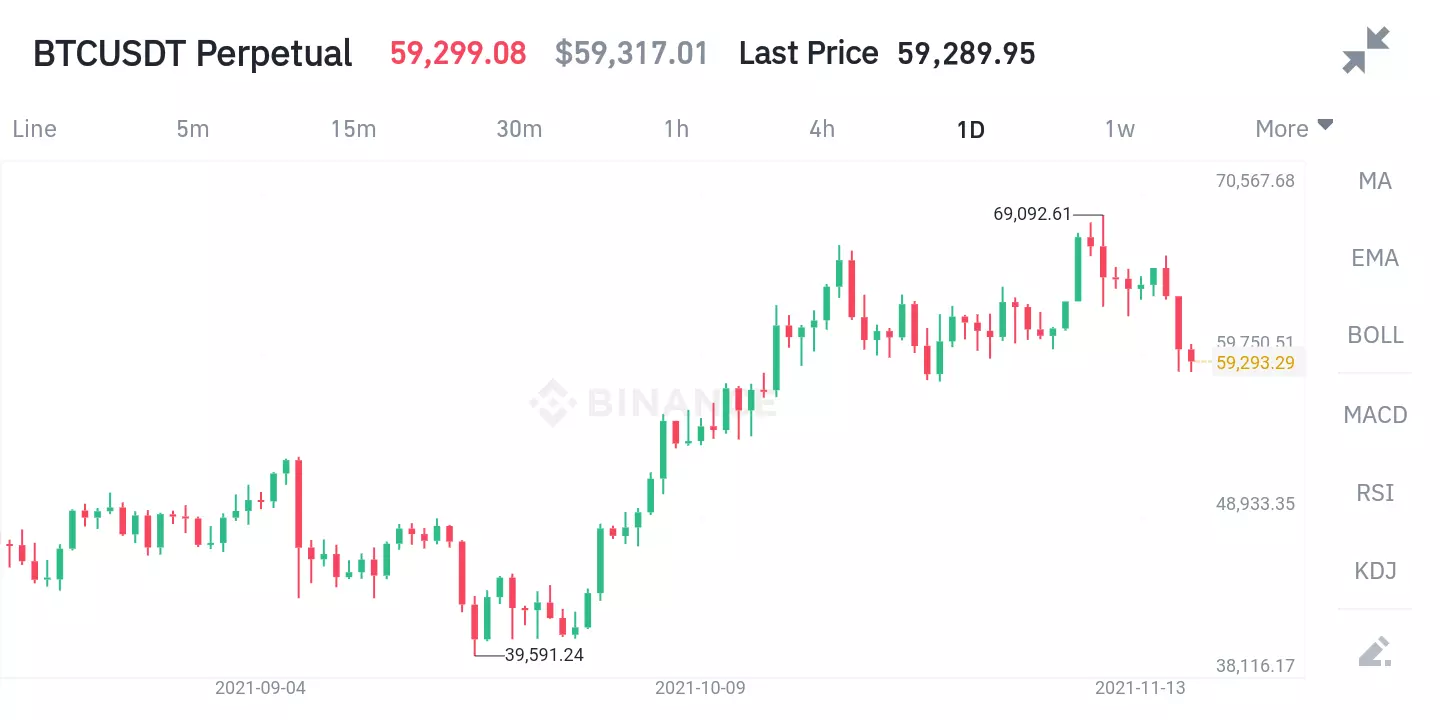
BTC perpetual futures contract chart. Source: Binance
Quarterly futures
These are futures contracts that expire after 3 months. On Binance, there are March, June, September, and December contracts. Each of these contracts expires quarterly on the last Friday of the expiration month. On the expiration day, any open position held by traders will be automatically closed and settled whether in profit or at a loss.
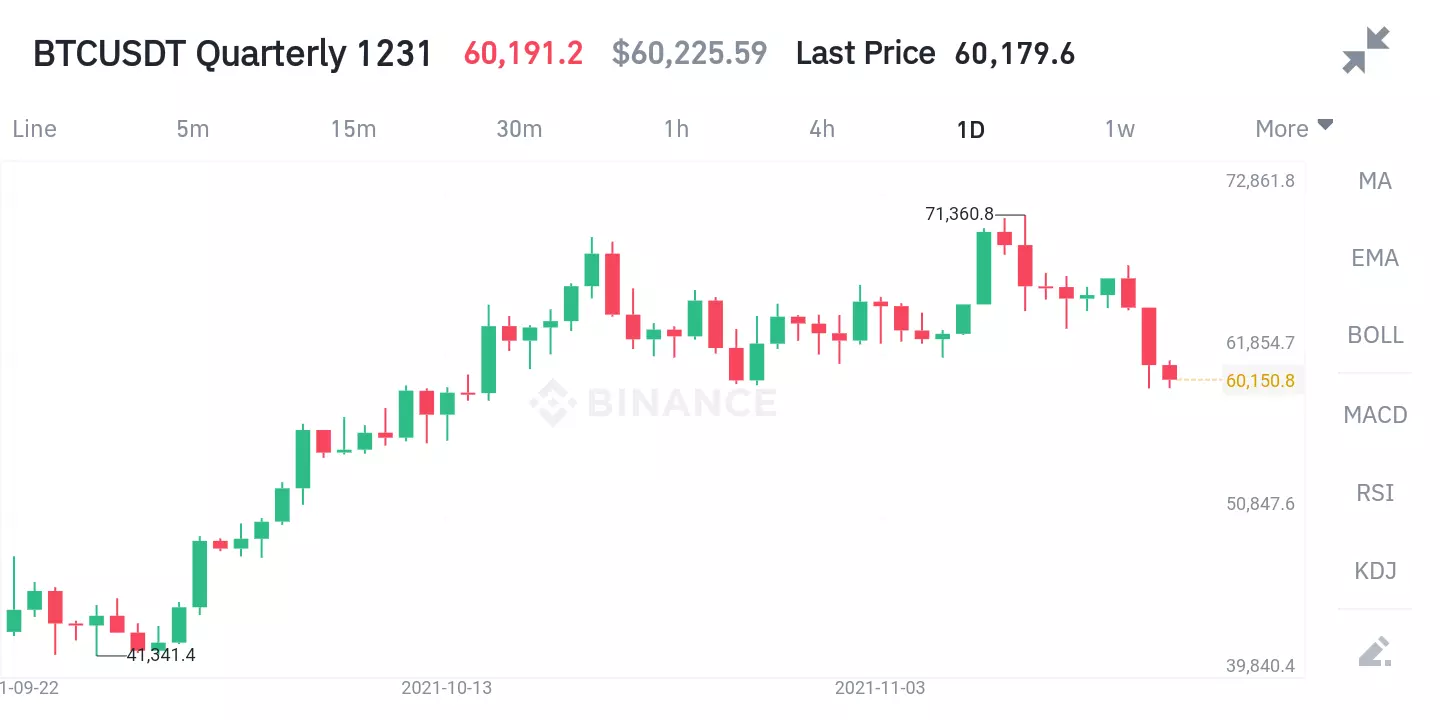
BTC quarterly futures chart 1231. Source: Binance
Key features of Bitcoin futures
The futures market allows you to trade in any direction you want – long or short. Going long (buying) means anticipating that the price of an asset will rise, while going short is when you expect an asset to depreciate in value.
The analysis is the same as with spot trading. Some traders use indicators to generate signals, while others focus mainly on price action. The key thing is that futures traders use leverage to increase their position size and profit potential, and this comes with a very significant problem: a losing trade can be liquidated by the exchange to protect the funds it lent to the trader.
In other words, while your trade on the spot market cannot be liquidated because you own the physical asset (Bitcoin), your trade on the futures market can be liquidated if your losses escalate to a specific amount.
The table below highlights the difference between the Bitcoin spot and futures markets.
Spot market
- A trader’s holding gains whatever the asset gains and declines proportionately to the asset.
- The trader owns the asset in their wallet, so there is no fear of liquidation.
- Traders buy the asset to later sell it at a higher price, so they can only benefit from bull markets.
- The trader owns what they have, so there are no margin calls.
Futures market
- Profits or losses are magnified by the leverage you are using.
- Futures are purely speculative. The trader does not own the asset, until after (and if) it is physically settled at expiration.
- You can trade in both directions, long or short and benefit from both bull and bear markets.
- The trader borrowed to hold a position, so they can get a margin call if the trade is losing.
Bitcoin options
Another method of participating in the Bitcoin market is through options contracts. A Bitcoin options contract is a type of derivative product that gives the trader the right, but not the obligation, to buy or sell Bitcoin at a specific price within a stipulated time. An options contract differs from a futures contract in that traders are not obligated to settle options contracts.
There are basically two types of options: call and put options.
A call option is an options contract that gives the buyer the right, but not the obligation, to buy Bitcoin at an agreed strike price. A trader buys a call option if they believe the price of the asset will increase.
A put option, on the other hand, is a contract that gives the buyer the right, but not the obligation, to sell Bitcoin at an agreed strike price. A trader buys a put option if they believe the price will decline.
On exchanges like Binance, Bitcoin options are cash-settled at expiry, but traders are allowed to exercise their options contracts before expiry.
The only requirements to trade options are the premiums (the deposit required to buy the contract). Unlike futures, where you need sufficient margin to keep your position open, an options contract will only terminate when it reaches expiry or when the trader exercises their right before expiry. The only money that will be lost is the premium paid for the contract.
Contract expiry varies from exchange to exchange, but generally ranges from 1 minute to 24 hours. Remember that the value of options contracts is subject to time decay, as a contract approaches expiry, its value approaches zero.
Volume options
Volume options contracts give you exposure to the asset, but rather than the price, changes in trading volume is what is considered. Here, you try to predict whether the volume will go up or down over a specific time (expiry). You profit when the volume goes higher than when you bought or sold the volume option, but you will lose your premium if the volume drops before expiry.
Bitcoin options
There are two main methods for analyzing the Bitcoin market: fundamental analysis and technical analysis. While fundamental analysis is more suitable for long-term investing, technical analysis is mostly used by short-term traders. There is also the seasonality analysis, though not commonly talked about.
Fundamental Analysis
Fundamental analysis considers the external factors that affect the value of an asset. Cryptocurrencies, including Bitcoin, are very sensitive to external factors due to their disruptive nature. Regulatory pressures from major economies like the USA, China, and the European Union always have a tremendous effect on the price of cryptocurrencies.
Market data and the external factors affecting cryptocurrencies can be found on websites like Reddit, X (formerly Twitter), Telegram, or Slack. Comprehensive data aggregators like CoinGecko, CryptoCompare, and CoinMarketCap are also valuable sources for looking up real-time data on hundreds of cryptocurrencies, Bitcoin included.
The following are some of the factors to consider when performing fundamental analysis:
- Government regulations – if the asset does not meet the regulatory requirements of a given jurisdiction, there is a negative impact on its growth. However, a favorable position by the government is seen as a welcome development – for example, El Salvador’s legislation to make Bitcoin legal tender.
- Usability – a coin’s value increases when it has more real-life users. Increased usage results in growth in the asset’s value.
- Media coverage – Promising crypto projects usually attract a large following on social media. There are lengthy discussions about all the ongoing projects and roadmaps of that asset.
Seasonality Analysis
This kind of analysis considers how Bitcoin performs in different seasons of the year. For this, analysts consider the average change in Bitcoin prices in each month of the year. See the chart below – it considers the average percentage change in the price of Bitcoin in each month over a 3-year period, from 2015 to 2018.
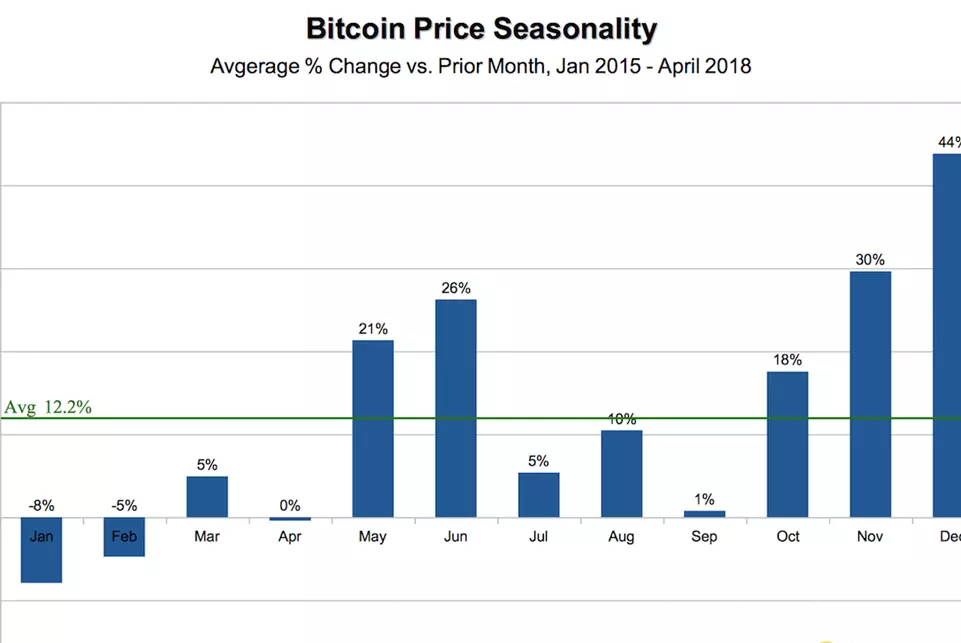
The data is quite small to make a reliable inference from it. But from the chart, you can see that Bitcoin tends to perform best in the last quarter of the year and very poorly in the first quarter.
Technical Analysis
Technical analysis is the use of indicators, graphical tools, and price action to predict the future price of an asset. It is all about using historical price and volume data to predict how the market will move in the future. Technical analysts, also known as chartists, believe that everything that can affect price movement is already reflected in the price chart and volume data.
Some common indicators for technical analysis include the RSI, stochastic, moving averages, and MACD momentum and volume indicators. We have shown many of them under the spot market section, but we will explain some of them in the next section.
How to read the Bitcoin price chart
You read the Bitcoin price chart the same way you read any other price chart. As with other assets, the price action can be visualized on any chart type, but the most common ones are the line chart, bar chart, and the Japanese candlestick.
The line chart is a continuous line graph that shows one price point, most often the closing price. Both the bar chart and the Japanese candlestick chart show four price points, Open, High, Low, and Close.
| Terms | Meaning |
|---|---|
| High price | The highest price of the trading session. |
| Low price | The lowest price of the trading session. |
| Closing price | The price at the close of the trading day or session. |

Bar chart

Japanese candlestick
Reading the price action
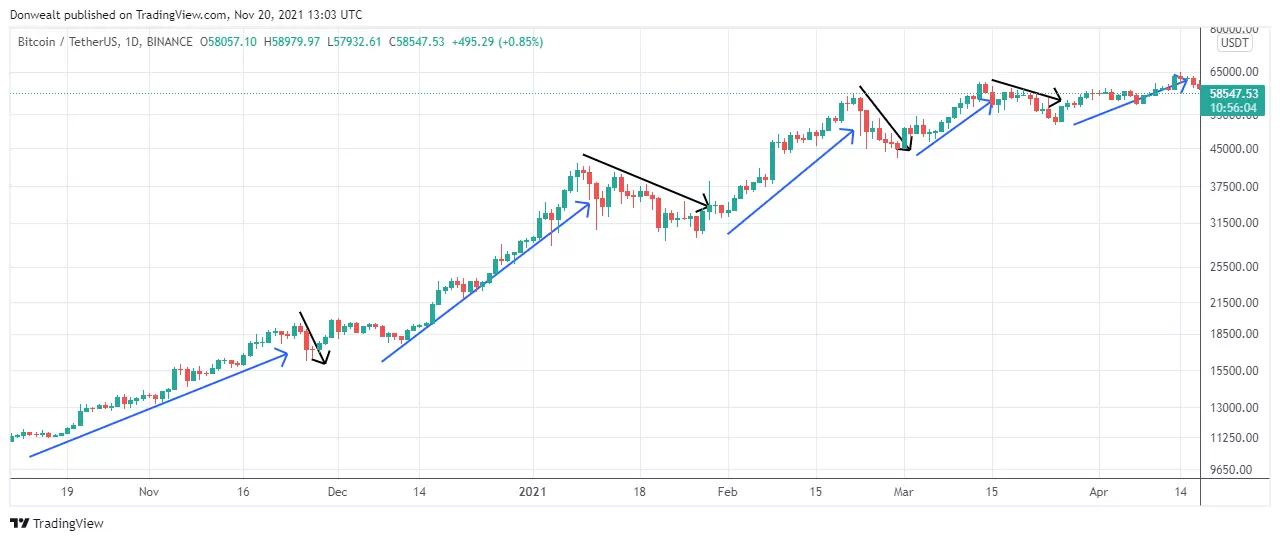
Price action refers to the history of price movement as presented on a price chart. It is the basis of technical analysis, and pure chartists rely on it alone for their analysis. The key to understanding the price action is knowing how to read the price waves and using it to identify price trends and sideways movements (range-bound price action).
Price waves are of two types: impulse waves and corrective waves (also called pullbacks or retracements). Impulse waves are bigger and move in the direction of the trend, while corrective waves are smaller and move in the opposite direction. Thus, in an uptrend, you will see higher swing highs and higher swing lows. See the chart below – note the bigger upswings (impulse waves marked with blue arrows) and smaller downswings (retracements marked with black arrows).
In a downtrend, you will see lower swing lows and lower swing highs. See the chart below – note the bigger downswings (impulse waves as indicated by the blue arrows) and smaller upswings (retracements marked by black arrows).
In a range-bound price action, the waves are almost of equal size, so the price moves sideways, as in the chart below.
Source: TradingView
Helpful indicators
Some indicators you can use to improve your results include the RSI, stochastic, MACD (moving average convergence/divergence), and moving averages.
The Relative Strength Index (RSI)
Source: TradingView
The RSI is an oscillator that shows extreme conditions in the market. A reading of 70 and above is considered overbought, while a reading of 30 and below is oversold.
Traders often take a long position when the indicator shows an oversold condition and a short position when the indicator reading is overbought. However, they usually combine it with other indicators and also read the price action.
Stochastic
Source: TradingView
Just like the RSI, the stochastic also measures extreme conditions in the market. A reading above 80 is overbought and considered bearish, while a reading below 20 is oversold and considered bullish.
Moving Average
A moving average is a trend-following indicator that continuously plots the n-period average of the price as it progresses. There are different types of moving average indicators, but the simple moving average (SMA) and the exponential moving average (EMA) are the most common ones.
Source: TradingView
The charts above and below show a 50-Day moving average. When the price stays above the moving average most of the time, it is likely in an uptrend, as in the chart above. When it is predominantly below the moving average, it is likely in a downtrend, as in the chart below.
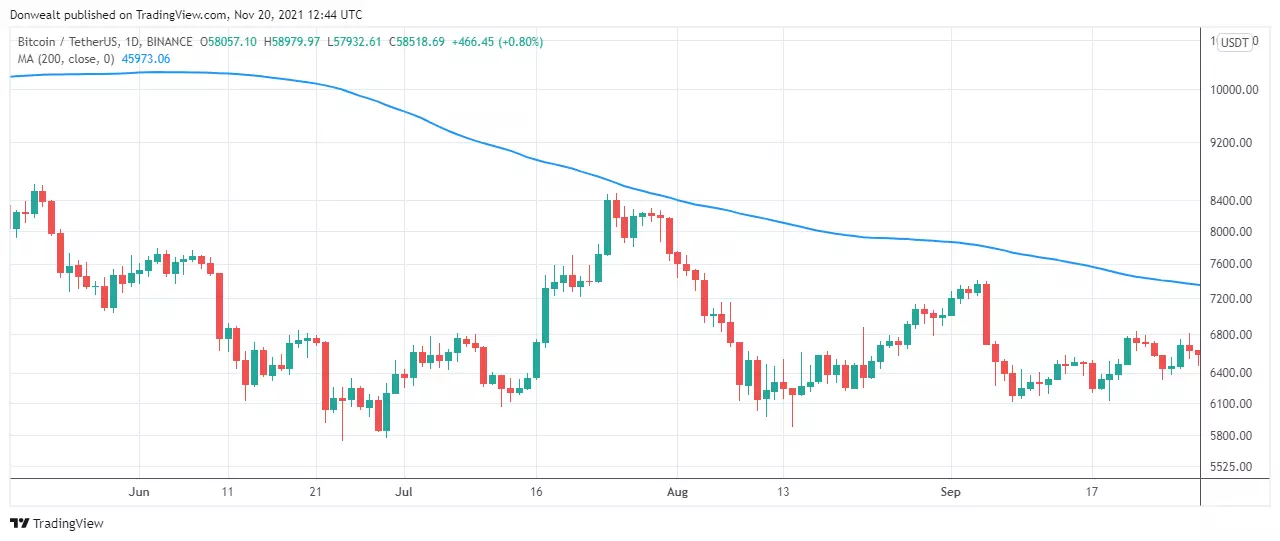
Source: TradingView
Crypto Trading Profit Calculator
Coins Purchased: 0
Final Value ( USD ): 0
Profit / Loss ( USD ): 0
Different Bitcoin trading styles
Generally, there are four trading styles: scalping, day trading, swing trading, and position/trend trading.
 Scalping – Scalping is a trading strategy that entails making multiple trades within a short period. Each trade can last from a few seconds to a few minutes. Most scalpers use trading bots due to the lightning speed required for order execution and the huge number of trades scalping involves. For clarification, trading bots are computer algorithms that constantly monitor the market for trade setups, execute and manage the trades without direct human intervention.
It is not advisable for beginners to use this method.
 Day trading – This approach aims at capturing the best price moves of the day. A trade can last from a few minutes to several hours, but the key thing is that it should be closed within that same day.
Day trading requires a lot of screen time and can be extremely stressful. It might not be suitable for a trader who has a 9 to 5 job.
 Swing trading – Swing trading is a method that seeks to capture the individual price swings on the daily timeframe. Swing traders typically trade within a range, buying at lows and selling at highs. They follow the direction of the market until it reaches a reversal point before exiting.
Swing trading requires less screen time and can be done on a part-time basis while keeping a 9 to 5 job or running a business.
 Trend trading – Also known as position trading, trend trading is a long-term approach. Position traders often buy at the start of a major trend and exit their positions when the trend reverses. This method also requires less screen time. Many consider it a form of investing.
Other things you should know
Here are some other things you need to know about Bitcoin trading.
Types of trade orders
These are the common order types you can use when trading cryptos.
 Market order – A market order is a trade order to buy or sell an asset at the current market price. This is most useful when trading in a stable market. It is not advisable to use it in a volatile market, like Bitcoin, as the execution price might be far worse than that at the time of placing the order.
 Limit order – A limit order is an order to buy or sell at a specified price. The order stays in the market order book until the prices reach the specified level and trigger it. A limit order is most useful when you want to buy lower or sell higher than the current market price.
A buy limit order is placed below the current market price, while a sell limit order is placed above the current market price. For example, if Bitcoin is trading at $90,000 and a trader believes there will be a pullback to $88,000, they can set a buy limit order at $88,100. If the price eventually retraces to that level, their order will be triggered.
The problem with a limit order is that the market may not retrace to your specified price level before reversing, which might cause you to miss out on the anticipated move.
Position or contract sizing
Position size or contract size is the amount of an asset a trader is willing to trade. It goes beyond just choosing any amount and then hitting the buy or sell button. Choosing the right position size for your trading capital requires skill and a good knowledge of your risk and money management parameters.
Position size in Bitcoin is calculated as follows:
Position Size = (Account Size x Percentage Risk per Trade) / Stop Loss (as a decimal)
Where:
Account size = your equity balance
Percentage risk per trade = the amount you are willing to risk on the trade
Stop loss = invalidation point
For example, let’s say you have an account size of $10,000, and your money management policy is to risk only 2% of your account size. This means that you are willing to risk no more than $200 on a single trade.
Now, let’s say that after your analysis, you decided to put your stop loss at 5% from your entry point. Using the above formula, your position size will be calculated as follows.
Position size = $10,000 X 0.02 / 0.05
Position size = $4,000
What this means is that you have to trade $4,000 to risk only $200 (2% of your account size) with a 5% stop loss. A proper position sizing strategy will ensure you sustain your account in the event of a streak of losses.
Leveraged trading
Leveraged trading means trading a large position with a smaller initial investment. Leverage helps you gain greater exposure to an asset without having to deposit the face value of the underlying asset.
It is a great way to maximize profits. However, leverage should be used with caution as small price swings can cause you to lose more money.
Common Bitcoin trading terms
| Terms | Meaning |
|---|---|
| Bull | A bull is a trader who believes the price of Bitcoin will rise. |
| Bear | A bear is a trader who believes the price of Bitcoin will decline. |
| ATH | All-time-high |
| ATL | All-time-low |
| Arbitrage trading | Buying on one exchange and selling on another to profit from the difference in Bitcoin prices on those exchanges |
| HODL | Hold on for dear life |
| FOMO | Fear Of Missing Out |
| FUD | Fear, Uncertainty, and Doubt |
How to start your journey in Bitcoin trading
To stand a chance of succeeding in your Bitcoin trading journey, you need to do the following:
 Have a trading plan and strategy – Having a great plan is the first step to a successful Bitcoin trading experience. You need to choose the type of strategy you will use, how often you will trade, and your risk management approach.
 Open an account with the right exchange – Many exchanges offer competitive fees. But before you sign up on any exchanges, check their requirements and also read some online reviews about them. This way, you can choose a reliable exchange that suits your needs.
 Start small – You have read and watched tons of resources but this does not mean your first few trades will be successful. To reduce your risk, start small and gradually grow. In the trading world, practice makes perfect. It is better to practice mock trading with a demo account or start with a small deposit until you master the art.
Avoid these common mistakes of Bitcoin traders
- Trading out of greed or fear.
- Not following your trading plans.
- Revenge trading.
- Risking more than you can afford to lose.
Conclusion
Bitcoin trading can be fun if you know what you are doing. Bitcoin’s high volatility provides great opportunities for making money but can also bite hard when you are on the wrong side of the market. The key to succeeding in Bitcoin trading is to understand your personality and trading style and then devise the plan that suits you the most. You may find that HODLing may be your best approach.