


 Richard Perry is a Financial Research and Platform Testing Analyst at BestBrokers.com, specialising in technical analysis, market strategy and the evaluation of trading platforms across forex, stock, crypto, CFD, gold and bitcoin markets.
People hold different perceptions of the stock market and stock trading in general. Some are confident they can land a fortune after a single trade, while others cannot stomach the risk of trading this highly dynamic segment of the securities market. The first group of traders may often be driven by greed, while fear is what commonly hinders the second type of people from dipping their toes in stock trading.
While trading stocks indeed entails some risk, adopting a disciplined approach may help you gradually grow your trading bankroll. In this guide, we look closely at how the stock market works and tackle the principal aspects of equity trading at the world’s largest stock exchanges. But first, let’s get back to basics with some fundamental terms.
| Stock Trading Statistics | |
|---|---|
| Stock Market Statistics | Stock Trading Demographics |
| Most Traded Sectors in Global Equity Markets | |
What do Shares/Stocks actually represent?
Stocks, also known as equity shares, are financial instruments that enable traders to take ownership in a particular company (corporation) and enable their owner to have a proportionate claim on that company’s assets and earnings. In other words, every shareholder (stock owner) owns a piece of the company equal to the number of shares he/she holds as a proportion of total outstanding shares. For example, if a person or an institutional investor owns 25,000 shares of a company that has 2,000,000 outstanding shares, then they own a 1.25% stake in it.
What types of Shares/Stocks are there?
Two types of shares exist in the corporate world – common shares and preferred shares. Common shares give their owner the right to vote at corporate meetings (for example, the annual general meeting of shareholders) on a variety of matters (for example, electing members of the corporate board of directors).
Most frequently, common shares give their owners equal voting rights (1 vote for each share owned). However, some companies may have multiple classes of shares with different voting rights. For example, XYZ Corporation may have a dual-class share structure where Class A shares grant owners ten votes per share while Class B shares grant a single vote per share. These dual or multiple-class share structures exist mainly to enable the founders of a given company to maintain control over its assets, revenue, and strategic direction.
On the other hand, preferred shares do not give their owner voting rights. They are named this way because they give preference to their owner over common shareholders in the company when it comes to dividend payments and when it comes to receiving assets in the event of business liquidation.
Nowadays, when we use the term “equities”, we usually refer to common shares since their combined market value and trading volumes are considerably higher than those of preferred shares.
What does Initial Public Offering (IPO) mean?
To begin business operations, every startup company requires a considerable amount of capital. The latter can be raised in two ways – through a bank loan (funding through debt), or through selling shares (funding through equity). As the business expands, the company may require access to more capital than what it can generate from daily operations or bank loans. Therefore, the company may decide to go public – to sell shares to the public via an Initial Public Offering (IPO).
By doing so, the company will transform from a privately held entity (with only a few shareholders having control over it) to a publicly traded entity (where numerous members of the public will be holding its shares).
IPOs provide early investors in a particular company with the opportunity to cash out a portion of their stake and generate decent gains as a result.
As soon as the company’s shares are listed on a stock exchange and trading in those shares begins, their price will start fluctuating as market participants assess and revise their assessment of the shares’ intrinsic value.
What does intrinsic value of a stock mean?
Financial analysts implement different models to estimate the intrinsic value of a particular company’s stock. The intrinsic value can be described as the fundamental, objective value of a financial instrument (stock). The discrepancy between the stock’s current market price and the intrinsic value calculated by a financial analyst could translate into an investing opportunity.
Generally speaking, it is a good time to buy a stock when its current market price is below the estimated intrinsic value. If the current market price is above the estimated intrinsic value, it may be a good time to sell the stock.
To evaluate the intrinsic value of a stock, market analysts may employ models such as:
- Dividend Discount Models
- Residual Income Models
- Discounted Cash Flow Models
How can Stocks be classified?
Stocks are typically classified based on market capitalization and sector. When we talk about market capitalization, we refer to the overall market value of the outstanding shares of a particular company. Market capitalization can be calculated when we multiply the total number of listed shares by the current market price per share.
Companies with market capitalization between $300 million and $2 billion are usually considered small-cap companies. Companies with market capitalization between $2 billion and $10 billion are regarded as mid-cap companies, while those with a market capitalization of more than $10 billion are considered large-cap companies.
When it comes to stock classification by sector, we usually refer to the Global Industry Classification Standard (GICS), introduced by MSCI and S&P Dow Jones Indices in 1999. This industry classification system comprises 11 sectors and 25 industry groups, reflecting the breadth, depth and evolution of different industries. GICS includes the following sectors:
- Industrials
- Materials
- Energy
- Health Care
- Financials
- Consumer Staples
- Consumer Discretionary
- Communication Services
- Information Technology
- Real Estate
- Utilities
More conservative investors usually give preference in their portfolios to sectors whose constituent stocks offer attractive dividends and have better price stability. Common examples include consumer staples, utilities, and health care. Conversely, investors with higher risk tolerance prefer sectors with more volatile prices such as energy, financials, and information technology.
What is a Stock Market Index?
Apart from individual shares, market participants pay close attention to Stock Indices. A Stock Index represents the aggregated prices of the different stocks constituting it. The movement of a Stock Index reflects the net effect of the movements of every individual stock it includes. Some of the largest stock market indices include the S&P 500, the Dow Jones 30 Industrial Average, and the FTSE 100, among others.

We can say that Stock Indices are valuable indicators of the performance of a particular stock market. The majority of indices are market capitalization-weighted, which means the weight of every index component (stock) is proportional to its market capitalization. There are price-weighted indices as well, such as the Dow Jones 30 Industrial Average, which includes the shares of 30 major blue-chip companies in the US.
Here are some of the most important stock indices investors should watch closely:
- US S&P 500
- Dow Jones 30 Industrial Average
- NASDAQ 100
- S&P/TSX Composite Index in Canada
- FTSE 100 in the UK
- CAC 40 in France
- DAX 40 in Germany
- IBEX 35 in Spain
- IBOVESPA in Brazil
- Hang Seng in Hong Kong
- Nikkei 225 in Japan
- TOPIX in Japan
- CSI 300 in China
- Shanghai Composite in China
- S&P ASX 200 in Australia
- SENSEX in India
- KOSPI in South Korea
What is a Stock Exchange?
A stock exchange represents a secondary market, where existing shareowners can make deals with potential buyers. We should note that publicly traded companies do not sell shares on their own. Investors purchase shares of the company’s stock from existing shareholders rather than from the company itself. Conversely, when investors sell back their shares on the stock market, they sell them to other investors and not to the publicly traded company itself.
You may ask how stock buyers and sellers are matched since they may not find each other at any given moment. On many exchanges, there are professional traders, known as market makers or specialists, who maintain continuous bids and offers. Bids are on one side of the market, representing the highest price a buyer is willing to pay for a stock. On the other side of the market we have ask offers, representing the lowest price sellers are willing to accept for their stock. The difference between the bid and ask prices is called a spread. The tighter the bid-ask spread and the bigger the bids and offers (or the amount of shares on each side of the market), the higher the liquidity of a particular stock. Good market depth occurs when a stock sees high trading volumes with nominal differences between the bid and ask prices. When the stock market is in good shape, it usually has narrow bid-ask spreads, sufficient depth, and high liquidity.
Back in the day, stock buyers and sellers were matched manually on an exchange via a system known as “open outcry”. Traders used verbal and hand signals to purchase and sell “blocks of stocks” on the floor of the stock exchange. The system was later replaced by electronic trading systems at the majority of stock exchanges. This way stock buyers and sellers can be matched faster and more efficiently, while trading costs were reduced and trade execution was greatly accelerated.
In many developed countries, stock exchanges are self-regulatory, non-governmental organizations, empowered to issue and enforce industry regulations and standards. Stock exchanges’ major objective is to ensure investor protection through rules promoting ethics and equality. Notable self-regulatory organizations in the United States include the National Association of Securities Dealers (NASD) and the Financial Industry Regulatory Authority (FINRA).
Nowadays, stock exchanges across the globe are linked electronically, which ensures greater efficiency and higher liquidity of the stock market.
Which are the largest stock exchanges worldwide?
The signing of the Buttonwood Agreement in 1792 by 24 New York City stockbrokers and merchants laid the foundation of the New York Stock Exchange (NYSE). Before the incorporation, brokers and traders used to hold unofficial meetings under a buttonwood tree on Wall Street where they purchased and sold shares. In 1817, New York stockbrokers operating under the agreement introduced significant changes and reorganized as the New York Stock and Exchange Board.
The NYSE facilitates trading Monday through Friday from 9:30 am to 4:00 pm ET but is closed on official holidays like New Year’s Day, Martin Luther King, Jr. Day, Washington’s Birthday, Good Friday, Memorial Day, Independence Day, Labor Day, Thanksgiving, and Christmas. The exchange closes early on the day before Independence Day and the days after Thanksgiving and Christmas Eve. The NYSE operates 253 days per year on average.

The NYSE and NASDAQ are the two biggest stock exchanges in the world based on the total market capitalization of their listed companies. The United States alone currently has 20 stock exchanges registered with the Securities and Exchange Commission (SEC), most of which are owned by the NYSE, NASDAQ or CBOE.
Based on data published by the World Federation of Exchanges in February 2025, the 19 largest stock exchanges worldwide by total market capitalization as of December 2024 were the following:
| Rank | Stock Exchange | Location | Market Capitalization (in trillion USD) | Monthly Trade Volume (in trillion USD) |
|---|---|---|---|---|
| 1 | New York Stock Exchange | United States | 31.6 | 2.7 |
| 2 | NASDAQ | United States | 30.6 | 2.7 |
| 3 | Shanghai Stock Exchange | China | 7.2 | 1.9 |
| 4 | Japan Stock Exchange | Japan | 6.56 | 0.65 |
| 5 | Euronext | Europe | 5.44 | 0.19 |
| 6 | National Stock Exchange of India | India | 5.13 | 0.29 |
| 7 | Shenzhen Stock Exchange | China | 4.5 | 2.8 |
| 8 | London Stock Exchange | United Kingdom | 3.52 in £ (about 4.5 in $) | 0.065 in £ (about 0.0815 in $) |
| 9 | Toronto Stock Exchange (TMX Group) | Canada | 3.55 | 0.20 |
| 10 | Saudi Exchange | Saudi Arabia | 2.6 | 0.03 |
| 11 | Taiwan Stock Exchange | Taiwan | 2.26 | 0.22 |
| 12 | Deutsche Boerse AG | Germany | 2.04 | 0.077 |
| 13 | Tehran Stock Exchange | Iran | 1.99 | 0.04 |
| 14 | SIX Swiss Exchange | Switzerland | 1.97 | 0.054 |
| 15 | ASX Australian Securities Exchange | Australia | 1.89 | 0.09 |
| 16 | Nasdaq Nordic and Baltics* | Europe | 1.79 | 0.047 |
| 17 | Korea Exchange | South Korea | 1.56 | 0.05 |
| 18 | Indonesia Stock Exchange | Indonesia | 0.83 | 0.014 |
| 19 | Abu Dhabi Securities Exchange | Abu Dhabi | 0.82 | 0.0006 |
*Includes Copenhagen Stock Exchange, Stockholm Stock Exchange, Helsinki Stock Exchange, Tallinn Stock Exchange, Riga Stock Exchange, Vilnius Stock Exchange and Iceland Stock Exchange.
The table below contains information about the number of companies listed on the 10 largest exchanges by market cap for the end of 2024. The data is accurate as of April 2025.
| Stock Exchange | Number of listed companies |
|---|---|
| New York Stock Exchange | 2,132 |
| NASDAQ | 3,289 |
| Shanghai Stock Exchange | 2,278 |
| Japan Stock Exchange Group | 3,966 |
| National Stock Exchange of India | 2,668 |
| Euronext | 1,858 |
| Hong Kong Stock Exchanges | 2,631 |
| Shenzhen Stock Exchange | 2,852 |
| London Stock Exchanges | 1,681 |
| TMX Group | 3,569 |
Now, let us take a look at the 50 companies with the largest market capitalization worldwide based on data from April 2025. Note that the table contains publicly traded companies only.
| Rank | Company Name | Market Capitalization | Country |
|---|---|---|---|
| 1 | Apple | $3.07 trillion | USA |
| 2 | Microsoft | $2.78 trillion | USA |
| 3 | NVIDIA | $2.51 trillion | USD |
| 4 | Amazon | $1.92 trillion | USA |
| 5 | Alphabet (Gooogle) | $1.91 trillion | USA |
| 6 | Saudi Aramco | $1.66 trillion | Saudi Arabia |
| 7 | Meta Platforms | $1.31 trillion | USA |
| 8 | Berkshire Hathaway | $1.14 trillion | USA |
| 9 | Broadcom | $831.82 billion | USA |
| 10 | TSMC | $818 billion | Taiwan |
| 11 | Tesla | $807.62 billion | USA |
| 12 | Walmart | $761.28 billion | USA |
| 13 | Eli Lilly | $744.81 billion | USA |
| 14 | JPMorgan Chase | $669.42 billion | USA |
| 15 | Visa | $645.00 billion | USA |
| 16 | Tencent | $559.39 billion | China |
| 17 | Mastercard | $483.21 billion | USA |
| 18 | Exxon Mobil | $464.40 billion | USA |
| 19 | Netflix | $446.67 billion | USA |
| 20 | Costco | $432.96 billion | USA |
| 21 | United Health | $389.53 billion | USA |
| 22 | Procter & Gamble | $388.61 billion | USA |
| 23 | Johnson & Johnson | $374.44 billion | USA |
| 24 | Oracle | $368.47 billion | USA |
| 25 | Home Depot | $354.25 billion | USA |
| 26 | ICBC | $324.93 billion | China |
| 27 | SAP | $320.04 billion | Germany |
| 28 | Coca-Cola | $315.45 billion | USA |
| 29 | AbbVie | $313.19 billion | USA |
| 30 | T-Mobile | $294.79 billion | USA |
| 31 | Bank of America | $292.95 billion | USA |
| 32 | Alibaba | $285.47 billion | China |
| 33 | Hermes | $277.51 billion | France |
| 34 | LVMH | $276.52 billion | France |
| 35 | Novo Nordisk | $275.90 billion | Denmark |
| 36 | Nestle | $269.82 billion | Switzerland |
| 37 | Kweichow Moutai | $267.20 billion | China |
| 38 | Agricultural Bank of China | $263.49 billion | China |
| 39 | Philip Morris International | $261.66 billion | USA |
| 40 | ASML | $258.71 billion | Netherlands |
| 41 | Samsung | $256.01 billion | South Korea |
| 42 | Roche | $248.50 billion | Switzerland |
| 43 | Salesforce | $240.71 billion | USA |
| 44 | International Holding Company | $239.55 billion | UAE |
| 45 | Chevron | $238.74 billion | USA |
| 46 | Toyota | $236.45 billion | Japan |
| 47 | Palantir | $236.45 billion | USA |
| 48 | China Mobile | $228.88 billion | China |
| 49 | McDonald’s | $227.73 billion | USA |
| 50 | IBM | $227.62 billion | USA |
What is a “block”?
When we talk about “blocks” in stock trading, we refer to large orders containing shares of the same stock, or orders that have a considerable notional value. A single block usually contains at least 10,000 shares of a company stock, or has a total market value of at least $200,000-$250,000.
According to market data, block trading accounts for nearly 20% of the trading volume on the NASDAQ.
Asset managers at large mutual funds, hedge funds, banks, and insurance companies usually employ block trading to aid their long-term decision making or increase their stock market exposure.
Massive stock buybacks by large corporations can also be conducted via block trading.
We should note that block trades are sometimes conducted outside the open market, so that the impact on the stock’s price is less pronounced.
How is the Stock of a company priced?
There are several ways to price a company’s shares on the stock market but most commonly this is done via auctions with bids and ask offers. A bid represents the price level, at which a market participant is willing to buy shares. The offer represents the price, at which another participant is willing to sell. When the bid and ask levels coincide, we say that a trade is secured.

Millions of traders and investors engage in stock trading and they usually have different ideas about the valuation of a given stock. Respectively, the price levels at which they are willing to buy or sell said stock also differ. They carry out thousands of buy and sell transactions, causing constant fluctuations in stock prices during the daily trading session.
The difference between the bid and ask price of a stock is known as a spread. It reflects the difference between the highest price a buyer is willing to pay for a stock and the lowest price a seller is willing to accept. A transaction takes place when the buyer accepts the ask price, or when the seller accepts the bid price.

We should note that the stock market is an excellent representation of the laws of supply and demand. When the number of buyers for a particular stock exceeds the number of sellers, the stock’s price will increase. When sellers outnumber buyers, the stock’s price will decrease. If there are more buyers than sellers, buyers may raise their bids to obtain that stock. As a result, sellers will demand higher prices for the stock, driving the stock’s price upward. When sellers outnumber buyers, the former may be willing to accept lower ask prices for a stock. In turn, buyers will decrease their bids for the stock, pushing its price downward.
Stock exchanges act as platforms for matching the orders of stock buyers and sellers. Retail investors can gain access to a stock exchange by using the services of stockbrokers acting as intermediaries between buyers and sellers.
Stock Trading Profit Calculator
Total Buy Cost: $0.00
Total Sell Proceeds: $0.00
Profit / Loss: $0.00
What does a Stockbroker do?
Stockbrokers are professionals, who carry out orders on behalf of their clients. They usually work for a particular broking firm and manage the transactions of its retail and institutional clients. In exchange for their services, stockbrokers receive payment in the form of commissions. However, there are other compensation methods depending on the brokerage firm.
These days, broking firms themselves are commonly referred to as stockbrokers. They are either discount or full-service brokers. Discount brokers usually only buy and sell financial assets on clients’ behalf. By contrast, full-service brokers offer a wider range of financial services, including research, investment advice, or portfolio management. Nowadays, the majority of online brokers are actually discount brokers who execute client trades either free-of-charge, or for a small fixed commission. We should also note that there are online brokers offering premium services for a higher commission.
As we said earlier, stockbrokers act as middle-men between the stock market (the exchanges) and market participants. Once brokers receive a trade order from their clients, they attempt to fill it at the best possible price. The advent of online trading platforms and mobile apps has made it more convenient than ever for retail clients to place orders on their own, causing many stockbrokers to transition to providing financial advice and portfolio management services. The relentless competition in the online trading industry has forced online brokerages to reduce their commissions (in some cases even to zero). Against that backdrop, discount brokers have started offering additional services like research and education, on top of order execution.
To buy and sell shares on major stock exchanges such as the NYSE, one must either be a member of the exchange itself, or work for a member firm. Member firms and the individuals working for them are authorized as brokers or broker-dealers by the Financial Industry Regulatory Authority (FINRA).
When it comes to broker licensing regimes for stock exchanges across the globe, we should note that:
- In the United States, registered stockbrokers are required to have the FINRA Series 7 and Series 63 or 66 licenses, while they have to be sponsored by a registered investment firm;
- In the United Kingdom, stockbrokers must obtain approval from the Financial Conduct Authority (FCA);
- In Canada, stockbrokers must successfully complete the Canadian Securities Conduct and Practices Handbook Course as well as the 90-day Investment Advisor Training Program;
- In Singapore, to become a stockbroker, one needs to pass several exams – Modules 1A, 5, 6 and 6A, which are administered by the Institute of Banking and Finance. Licenses are provided by the Monetary Authority of Singapore (MAS) and the Singapore Exchange;
- In Hong Kong, to become a stockbroker, one should be employed by a licensed brokerage firm and pass three exams administered by the Hong Kong Securities Institute. Once they pass the exams, candidates must seek approval from Hong Kong’s financial regulatory authority to obtain a broker license.
Today, brokers working for discount brokerage firms are either over-the-phone agents or work at a physical office branch. Some stockbrokers are employed by investment banks or specialized brokerage firms, offering services mostly to institutional investors and high-net-worth individuals. Another recent innovation in this field are the so-called robo advisers, robots facilitating algorithmic trading.
Until recently, it was extremely expensive for the average investor to access the stock market. On the other hand, high-net-worth individuals and large institutional investors could access the exchange by using full-service brokerages, as they could afford to pay huge commissions for order execution.
However, technological progress has made it possible for discount brokers to provide quicker and less expensive access to the stock market. Nowadays, there are also brokerages like Robinhood that cater to the needs of micro investors by facilitating fractional-share trading. Today, retail stock traders manage their trading accounts on their own without resorting to intermediaries.
What are the advantages and disadvantages of Stock Exchange listing?
A company listed on a reputable stock exchange will certainly benefit from:
- Access to liquidity for shares that its shareholders own;
- Opportunity to set up stock options plans more easily. Such initiatives are crucial for luring highly coveted professionals to work in the company;
- Opportunity to raise more funds by issuing additional shares.
- A publicly traded company can use listed shares to make acquisitions, where part or the entire amount is paid in stock;
- A publicly traded company becomes “more visible” in the marketplace. The price of its shares can rise as a result of analyst coverage or higher demand from institutional investors.
There are, of course, certain disadvantages associated with stock exchange listing:
- Initial public offerings (IPOs) are associated with considerable expenses for a company, including listing fees and reporting costs;
- Second, exchange regulations may be too stringent and affect the company’s ability to run its business operations;
- And third, the majority of investors tend to focus more on short-term outcomes. As a result, many companies allocate most of their resources for objectives such as exceeding analyst estimates for quarterly earnings and revenue, for example, instead of focusing on their long-term corporate strategy.
Next, let us discuss some practical considerations, which you may take into account before you begin trading stocks. Note that to be successful in stock trading, you must have an adequate market approach, sufficient knowledge, and discipline.
Day Trading and Swing Trading
There are two popular ways to approach the stock market – either by trading on a daily basis, or by taking advantage of medium-term fluctuations in stock prices. There is also a distinction between active stock trading and stock investing. Investing in stocks is a process that unfolds over the long term (months and even years). On the other hand, actively trading stocks is associated with taking a short-to-medium term approach. In this line of thought, day trading and swing trading are two popular ways to actively trade the stock market.
Day trading involves executing intraday trades in a particular stock. A day trader will open and close their market positions within the same trading day (trading session). Trade duration often ranges from several seconds to several hours, depending on daily price volatility. Day traders employ mostly technical analysis in their strategies. They aim to identify price trends with the help of technical indicators like moving averages, the RSI, the MACD or Bollinger Bands. Day traders also tend to closely examine price chart segments for possible “chart setups” or formations that could indicate either a trend continuation or trend reversal.

By contrast, swing trading is a more medium-term approach. Swing traders maintain their positions open for several days to several weeks (sometimes up to a few months). Swing traders usually use a combination of technical and fundamental analysis. The latter includes closely following macroeconomic and political developments, reading corporate news, and financial reports released by different companies.
To choose between the two approaches, you should consider the following aspects:
- your total investment objectives
- the time horizon required for achieving those objectives
- your risk tolerance
- the type of strategy that best suits your current lifestyle
- the time you need to spend educating yourself.
Creating a trading account with a stockbroker
Retail investors should open a brokerage account to gain access to tradable asset classes such as stocks, bonds, mutual funds, and so on. Like traditional bank accounts, a brokerage account allows you to transfer funds in and out of your balance, but it also gives you access to the stock market.
Opening an online trading account is a quick and hassle-free process. New traders and retail investors are welcome at leading discount brokers like TD Ameritrade, Interactive Brokers or eToro. These platforms have a reasonable minimum deposit requirement to open an online trading account and offer stock trading with zero commissions.
Now let us discuss the specific steps of opening an account with an online brokerage.
First, you have to decide how much assistance you will require from your stockbroker. There are different types of trading accounts on offer and each has its advantages and drawbacks. You should properly research the brokerage, its account types, trading platforms and trading conditions to determine if it suits your financial objectives. More specifically, you should pay attention to the fees associated with opening and using the brokerage account, whether its online trading platform has a user-friendly interface and features, whether it has a minimum deposit requirement and, if it does, whether this minimum corresponds to your budget. Also, you should look into the stockbroker’s educational and research materials. Nowadays, most leading brokerages tend to offer highly competitive and interactive educational content on their websites or in dedicated blogs.

Stockbrokers will usually offer both self-managed and managed trading accounts. A self-managed account is one you can entirely manage on your own. If you consider your skill level and knowledge of the stock market sufficient to begin day trading with real money, then this may be the right account for you. A managed brokerage account is a trading account managed by a professional, usually a registered investment advisor working for the brokerage. If you lack the confidence to start trading on your own, then this account type may be a good option for you.
Second, after you have selected a broker to work with, you must register a trading account. The registration process normally takes no more than 10 to 15 minutes. You must provide the following information:
- personal information such as full name, mailing address, phone number, social security number, current financial situation and assets;
- information about your tax status – in the application form, the brokerage may require you to answer questions such as whether you are opening the account as an individual or as a business entity, whether you are filing individually or jointly with your spouse and so on;
- information concerning your personal risk tolerance – the application form may include questions about your investment experience, investment strategy and investment objectives as well as knowledge of risk management;
- You must also prepare copies of your identity documents to pass the obligatory identity verification check.
Once you register, you must fund your brokerage account. If the broker has a minimum initial amount requirement, you must satisfy it. Since no gains are guaranteed when trading stocks, you should carefully assess what amount you can afford to invest so that your monthly budget is not disrupted. Also, bear in mind that you should not invest an amount that you cannot afford to lose.
Detecting “the best” Stocks to buy in the market now
You should always be looking for Stocks that have the highest possibility to make a significant move. This is where a reliable “stock screener” tool may prove quite useful. Today the majority of leading stockbrokers offer either built-in or fully customizable screener tools, allowing you to view a selection of Stocks based on particular parameters (market cap, analyst rating, price movement in percentage, region, industry and so on). TD Ameritrade’s Thinkorswim trading software is one of the good options, for instance. Still, a good stock screener is just the first step of the trading process.
High Volume as indicator in Stock trading
Experienced stock traders will probably tell you that volume is the first key indicator they pay attention to when selecting what stocks to invest in. Volume means a higher potential for price volatility and volatility provides numerous trading opportunities for active traders. High volume enables traders to enter and exit their positions in the stock market at optimal price levels.
When a stock is exhibiting above-average or unusual volume, there probably is a catalyst (“unusual” event) that has caused it. That catalyst may not necessarily be a specific corporate event or financial report, but rather some news of industry-wide importance, which led to a surge in volume. For example, in 2020 there was enormous bullish speculation surrounding the electric vehicle industry. During the price rally, the majority of electric vehicle stocks gained in value, despite the absence of a catalyst for any particular company from the sector.
Identifying unusually high volume in a stock or in a sector opens the door for potential trading opportunities, which inexperienced traders may fail to detect. Some stock screeners can visualize top “unusual volume” Stocks.
Stock market news
Stock news, be it events or reports concerning a particular company or news concerning the entire industry, can also be a strong catalyst behind share price movement. Mergers and acquisitions or FDA approvals are very likely to drive the prices of a company’s stock up. In other cases, if a stock is showing considerable movement with no real catalyst, this is probably due to market speculation.
The VWAP technical indicator
Both day traders and swing traders use the volume-weighted average price (VWAP) as a technical analysis indicator. It reflects the average price level at which a particular stock has traded throughout the trading session, while the indicator takes into account both price and volume. This indicator helps traders detect stocks that are trading in proximity to their VWAP. If you use the VWAP indicator in combination with a volume indicator, you will be able to focus only on trending stocks which are testing VWAP levels.
The VWAP indicator is commonly incorporated in intraday charts, allowing you to see the average price of a stock throughout the day, considering the volume of trading. If the price of the stock hovers above the VWAP line, then we can conclude that the market is bullish. On the contrary, a price below the VWAP value indicates a bearish market.
High float and Low float Stocks
Stock float is another key day trading term that concerns every publicly traded company. It reflects the number of outstanding shares of stock available to trade minus the shares held by company employees or insiders. The stock float comprises all shares of a company that investors can trade in the open market.
Stock traders usually use the stock float to determine the supply and demand for a particular stock. When a stock has a high stock float, there are more shares available to trade in the market and it would require more buying and selling activity for the stock to move. On the other hand, if a stock has a low stock float and if a surge in volume occurs, this would lead to a more considerable price movement because of supply and demand.
Next, let us discuss some chart patterns (technical analysis studies) you can use when employing day trading or swing trading strategies to buy stocks. These patterns may help you profit when stock prices are trending up. In order to buy stocks at low price levels and sell them at high price levels, you must learn to identify bullish (uptrend) chart patterns.
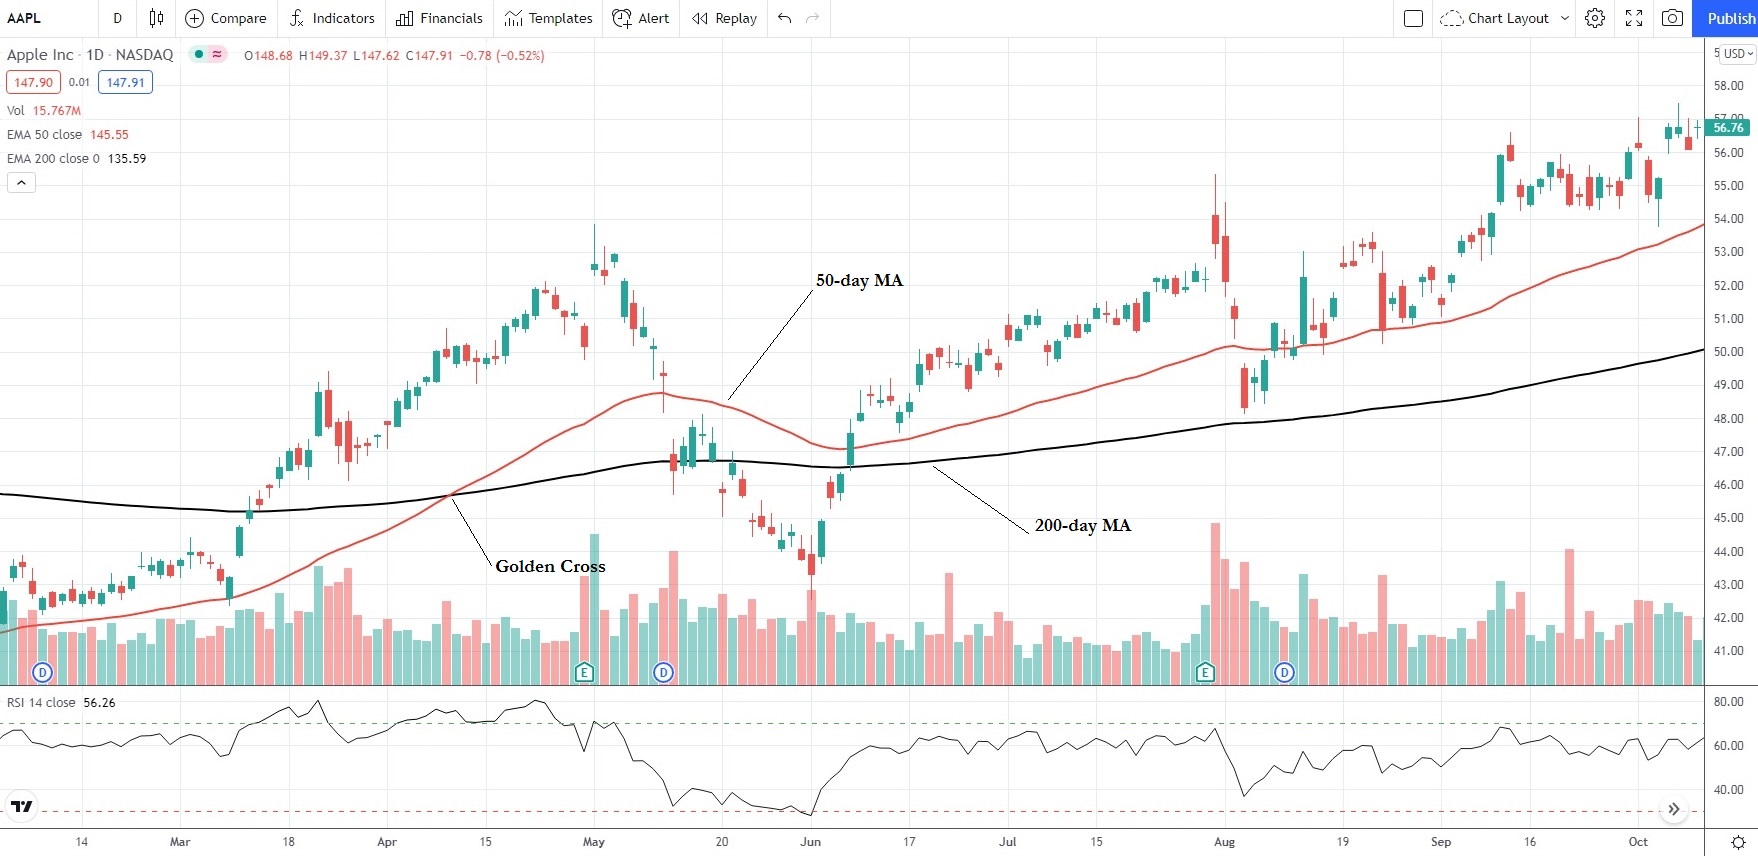
The Golden Cross Pattern
This is perhaps one of the most popular chart setups among active traders. For this pattern, we use two technical indicators on the price chart – a short-term moving average (MA) and a long-term moving average. Most traders use the 50-day MA and the 200-day MA for this purpose. The so-called “Golden Cross” occurs when the short-term MA (50-day) of the stock surpasses the long-term MA (200-day). If you use larger timeframes with daily or weekly charts, the Golden Cross pattern will indicate stronger bullish breakouts that last for longer stretches of time.
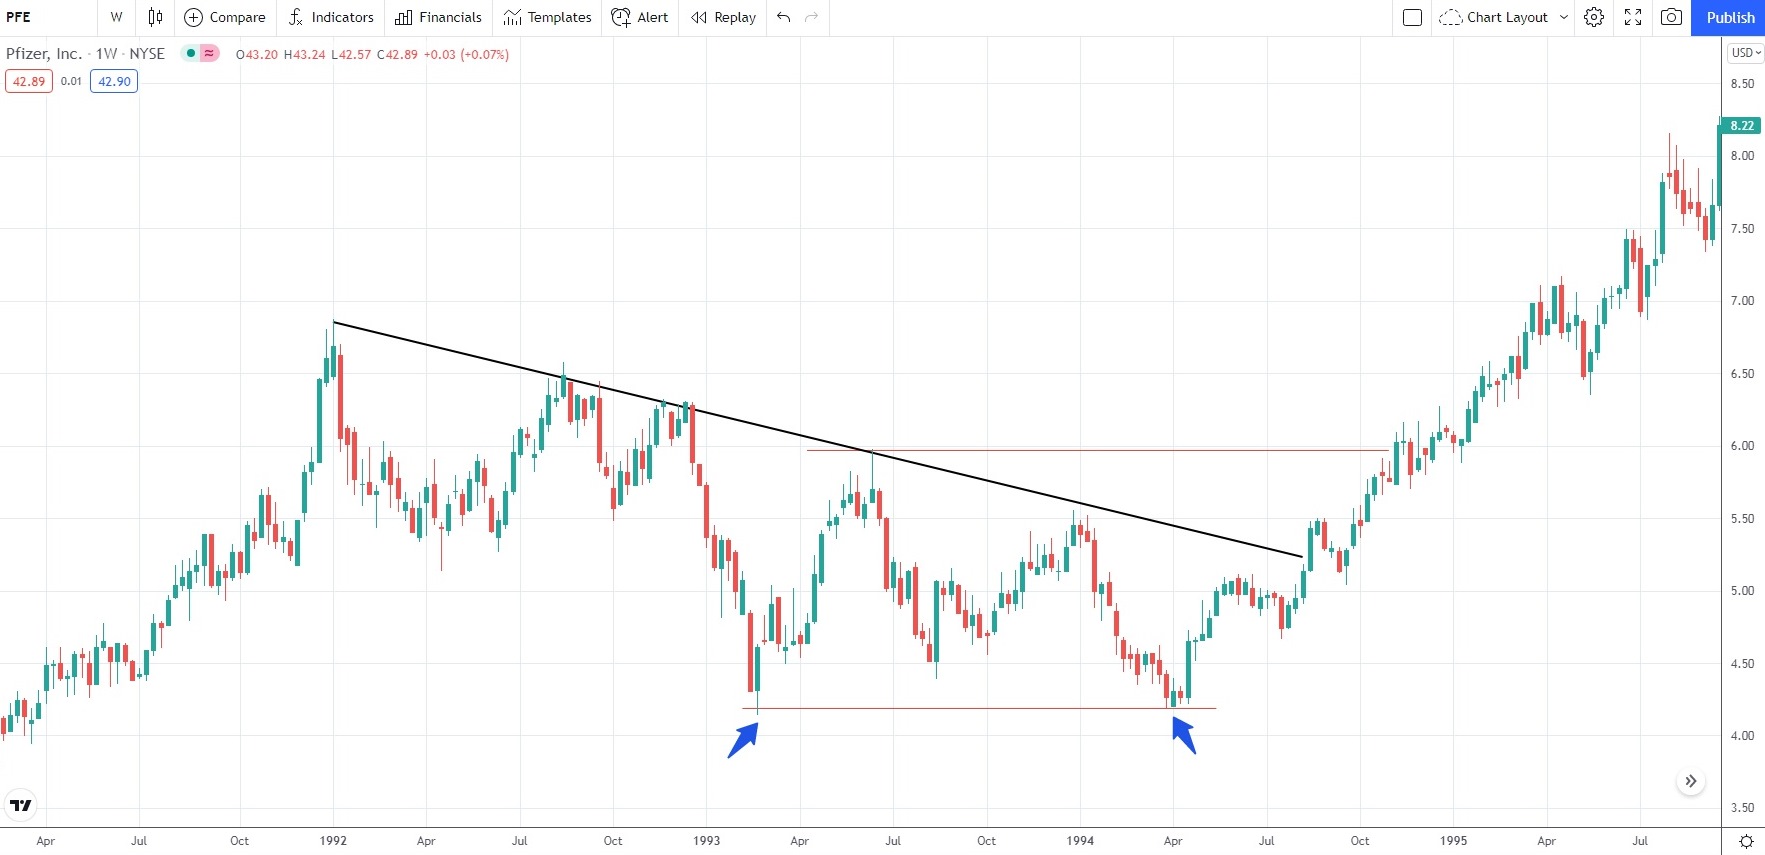
The Double Bottom Pattern
Also known as a “W-shaped” pattern, the Double Bottom setup indicates a trend reversal in a stock’s price movement. The setup occurs on the price chart when the stock’s price hits roughly the same trough (notable low level) two times and then bounces up. When the price reaches roughly the same low level twice and immediately rebounds, this indicates a strong support for the stock at those levels. Traders will usually enter the market as soon as the stock rallies after hitting the second low level. This setup may occur on various chart timeframes, but it tends to be more reliable if detected on larger charts.
Risks associated with stock trading
Stock trading can be profitable but is also extremely risky, unlike other market instruments like government bonds that usually have a low-risk profile. Stock investors typically face the following risks.
First of all, there is a market or systematic risk. The stock market can experience periods of exceptionally high volatility and be quite unpredictable, as it is affected by various global and local economic factors. A specific market can be heavily influenced by macroeconomic, geographical, political, social, and other factors.
Second, there is a global risk. Since most of the stock exchanges worldwide are open, they can be affected by disruptions in all major markets. Therefore, investors are exposed to economic and other events that occur around the world and this should always be factored into their risk assessment.
Third, there is an interest-rate risk. Changes to central banks’ interest rate policies may influence stocks to different extent. Let us take the Hong Kong Stock Exchange, for example. Due to the USD/HKD exchange rate peg, interest rates in Hong Kong may be directly affected by the interest rates in the United States. As a result, Hong Kong shares may track the performance of US shares.
Fourth, there is a business risk. A publicly traded company you decide to invest in could experience a considerable drop in revenue or even file for bankruptcy. The reasons for such outcomes could vary, but usually they are related with poor management, intense competition or a slowdown in the particular industry.
Fifth, there is a risk of inadequate corporate governance. An exchange-listed company may be managed poorly or get involved in transactions that could affect the interests of its shareholders, for instance, the acquisition of an overvalued asset. The regulatory authorities usually are not concerned with the commercial decisions of a listed company as long as they do not violate regulations.
Sixth, there is a liquidity risk. Low-cap stocks are usually less liquid than high-cap stocks. You should be aware of the additional risk of getting tied up in stocks that may be too difficult or too costly to dispose of.

Seventh, there is a risk of a particular stock being suspended from trading. This measure aims to prevent any uneven information dissemination as well as insider trading opportunities and to ensure trading in the stock is conducted on a fully informed basis. Buying and selling the stock will not be accessible during the period of suspension, but there is a chance that its price changes due to shifts in market and business risk.
And finally, there is a policy risk. Any notable shifts in government policies and regulations may deeply affect the stocks of companies in the relevant industries.
We should note that stock trading risk cannot be avoided completely, but can certainly be managed. You should always be mindful of your risk exposure and align it with your investment goals and risk tolerance. Determine what amount you are willing to allocate to stock trading and what amount you feel comfortable to lose. After that, restrict your exposure to an acceptable extent. Also, it is crucial to consider if a particular listed company has the ability to deliver consistent profits and, therefore, underpin its stock price rally in the long term. And finally, be very cautious when you are trading a stock driven by rumors or speculation. If the speculations turn out to be incorrect, there is a high possibility that the stock’s price reverses direction.
Some additional considerations – researching Stocks, trade orders, trade costs, taxes
If you are completely new to the stock market, selecting individual stocks to add to your portfolio may not be the most appropriate way to start. A good choice of individual stocks is based on a profound analysis of financial ratios to determine how a particular company is faring compared to its competitors. You may dabble into exchange-traded Funds (ETFs), which enable you to operate with a bundle of Stocks at once. There are several types of ETFs, but ETFs replicating major stock market indices (S&P 500, for example) are the most suitable for beginners since they give them broad stock market exposure.
Buying and selling stocks or ETFs usually requires placing different types of orders. Market orders and limit orders are the most common types. Market orders are executed immediately at the best price level available at the moment. Limit orders, on the other hand, do not necessarily ensure immediate execution, but give you a better control over buy and sell prices. Limit orders allow you to set a specific price level at which you are willing to buy or to sell a particular stock or ETF. This way you will be able to get the most out of your trade. Once you have purchased a Stock or ETF, you may place a Trailing Stop sell order. This will allow you to keep the asset as long as the market is trending up and automatically sell when the market reverses direction and the price moves down beyond a certain point.

Trading costs are another key aspect to consider if you want to be successful in stock trading. Most frequently, those costs are the commission fees charged by the stock brokerage. You may take your time researching different brokers and select the one with the lowest commissions. Some brokers do not charge commissions for stock trading. When trading ETFs, you should be aware of expense ratios. ETFs are usually managed by a professional who receives annual compensation in the form of a percentage of the fund’s assets. If the expense ratio for a particular ETF is 0.2%, you must pay $0.20 per year for every $100 you invest.
Finally, when you trade Stocks actively, the profits you earn will be taxed as capital gains. Generally, you pay higher taxes if you hold a stock for a period of less than 1 year. This tax structure aims to encourage long-term investments.
Conclusion
The stock market is associated with a high level of risk, but if approached smartly, it can help you build value over time. In this guide, we discussed some key aspects related to stock trading and the market itself. However, if you want to be a successful stock trader, you must invest in adequate educational resources and consistently work to hone your skills.
A good way to practice what you learned in this guide is to open a free demo account with an online stock broker. This will enable you to practice risk-free with virtual credits until you build enough experience and expertise in stock trading to transition to a live account.