
As 2026 begins, global markets find themselves at a crossroads shaped by a year of unexpected milestones and shifting narratives. In 2025, gold pushed into all-time highs as investors sought safety in hard commodities, while tech behemoths remained market leaders, with notable moments like NVIDIA reaching a valuation of $5 trillion, the U.S. introducing trade tariffs, and central banks starting to cut interest rates. As analysts and investors look ahead to 2026, the big question is not just which sectors will outperform, but why, and which narratives will define the next chapter of global markets.
Amid the surge of record-breaking valuations and sectoral growth, the team at Best Brokers set out to examine global market performance through the lens of several major indexes, namely the Morgan Stanley Capital International all country world indexes (MSCI ACWI indexes). Our analysis spans a wide array of sectors – from Information Technology and Semiconductors to Energy, Health Care, and Consumer Discretionary – capturing not only market capitalisations but also the average size and number of companies within each sector, alongside gross returns over periods ranging from three months to ten years. To offer deeper insight, we identified leading companies in each sector, providing a clear view of the firms driving market trends. The result is a data-driven snapshot of market dynamics that delivers a concise yet comprehensive framework for interpreting sectoral performance and corporate influence in 2025.
We found that over the past year, sectors tied to precious metals and technology saw the strongest returns, reflecting investor appetite for both safe-haven assets amid market uncertainty and high-growth tech opportunities, while more traditional industries report moderate performance, suggesting a slower recovery or limited upside in established markets.
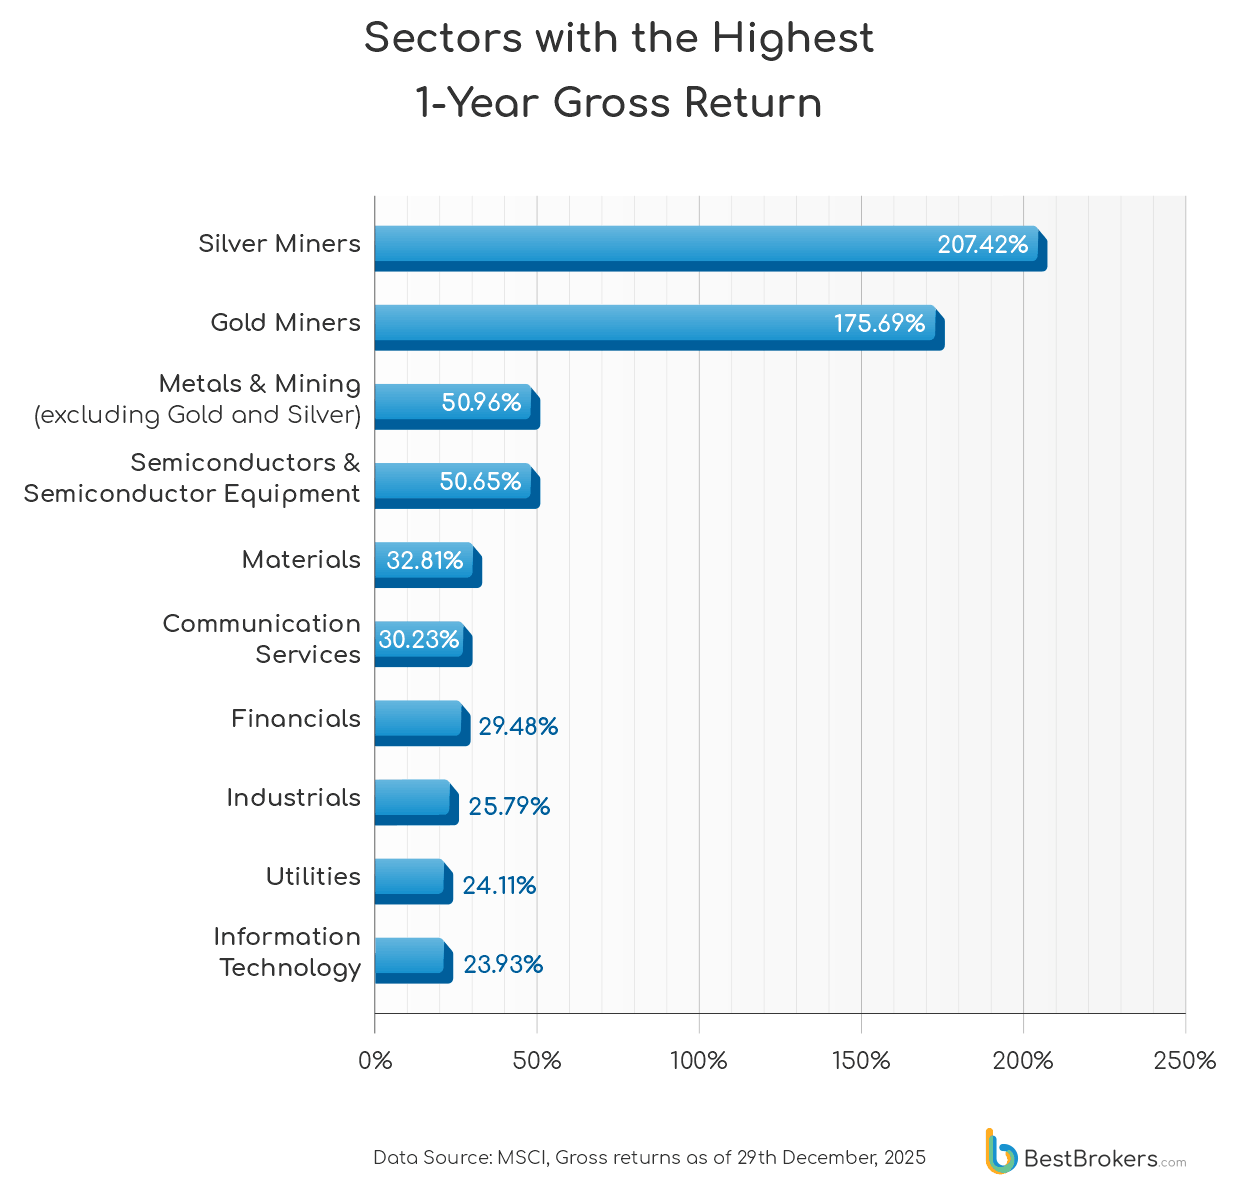
The past year produced an unusually concentrated rally at the intersection of scarcity and strategic importance. The explosive gains in silver (+207.42%) and gold miners (+175.69%) point less to broad risk aversion and more to a repricing of supply-constrained assets at a time when mining costs, permitting delays, and national stockpiling became central talking points. Meanwhile, the gains in the semiconductors and semiconductor equipment sector reflect a market recalibrating around compute capacity as a finite resource, with AI deployment, data-centre expansion, and onshoring initiatives reshaping capital flows. The strong showing of materials, financials, and industrials suggests investors were not simply chasing momentum but were selectively backing sectors positioned closest to physical infrastructure, balance-sheet leverage, and real-world production, resulting in a year where tangible inputs quietly outperformed abstract growth narratives.
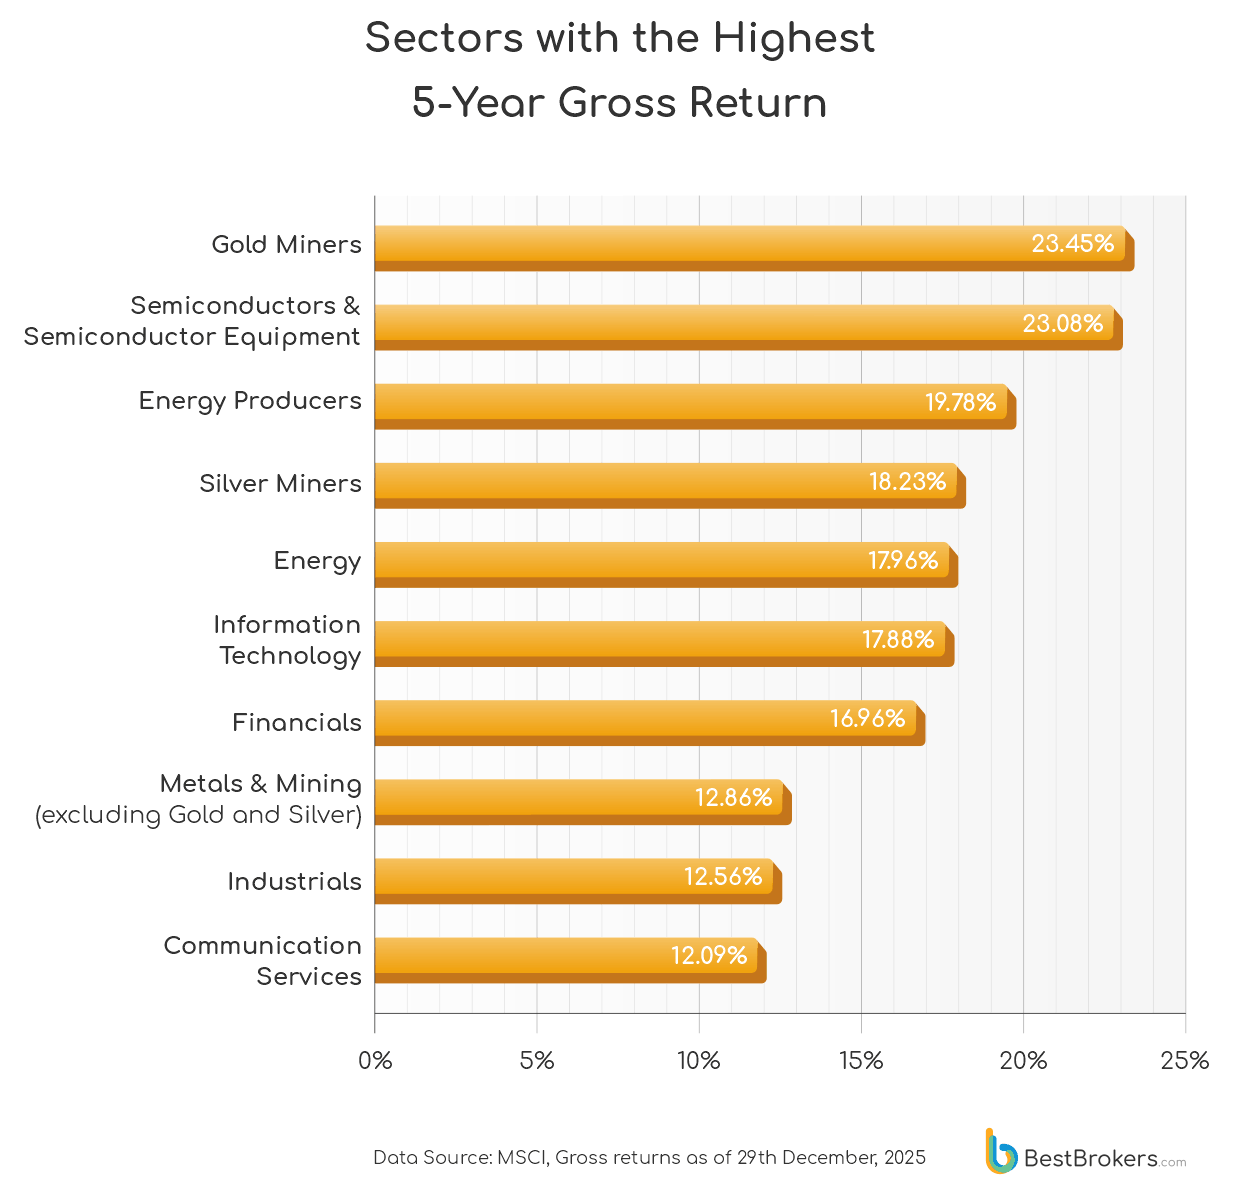
The five-year return rankings offer a different perspective from the outsized one-year gains, helping distinguish sectors driven by long-term compounding from those benefiting from recent momentum. While precious-metal miners remain near the top, their longer-term returns suggest much of the recent surge is cyclical. By contrast, semiconductors and information technology continue to show durable growth across time horizons. The presence of energy producers and financials points to sectors that have strengthened profitability over time, while communication services and industrials appear more oriented toward stability than acceleration.
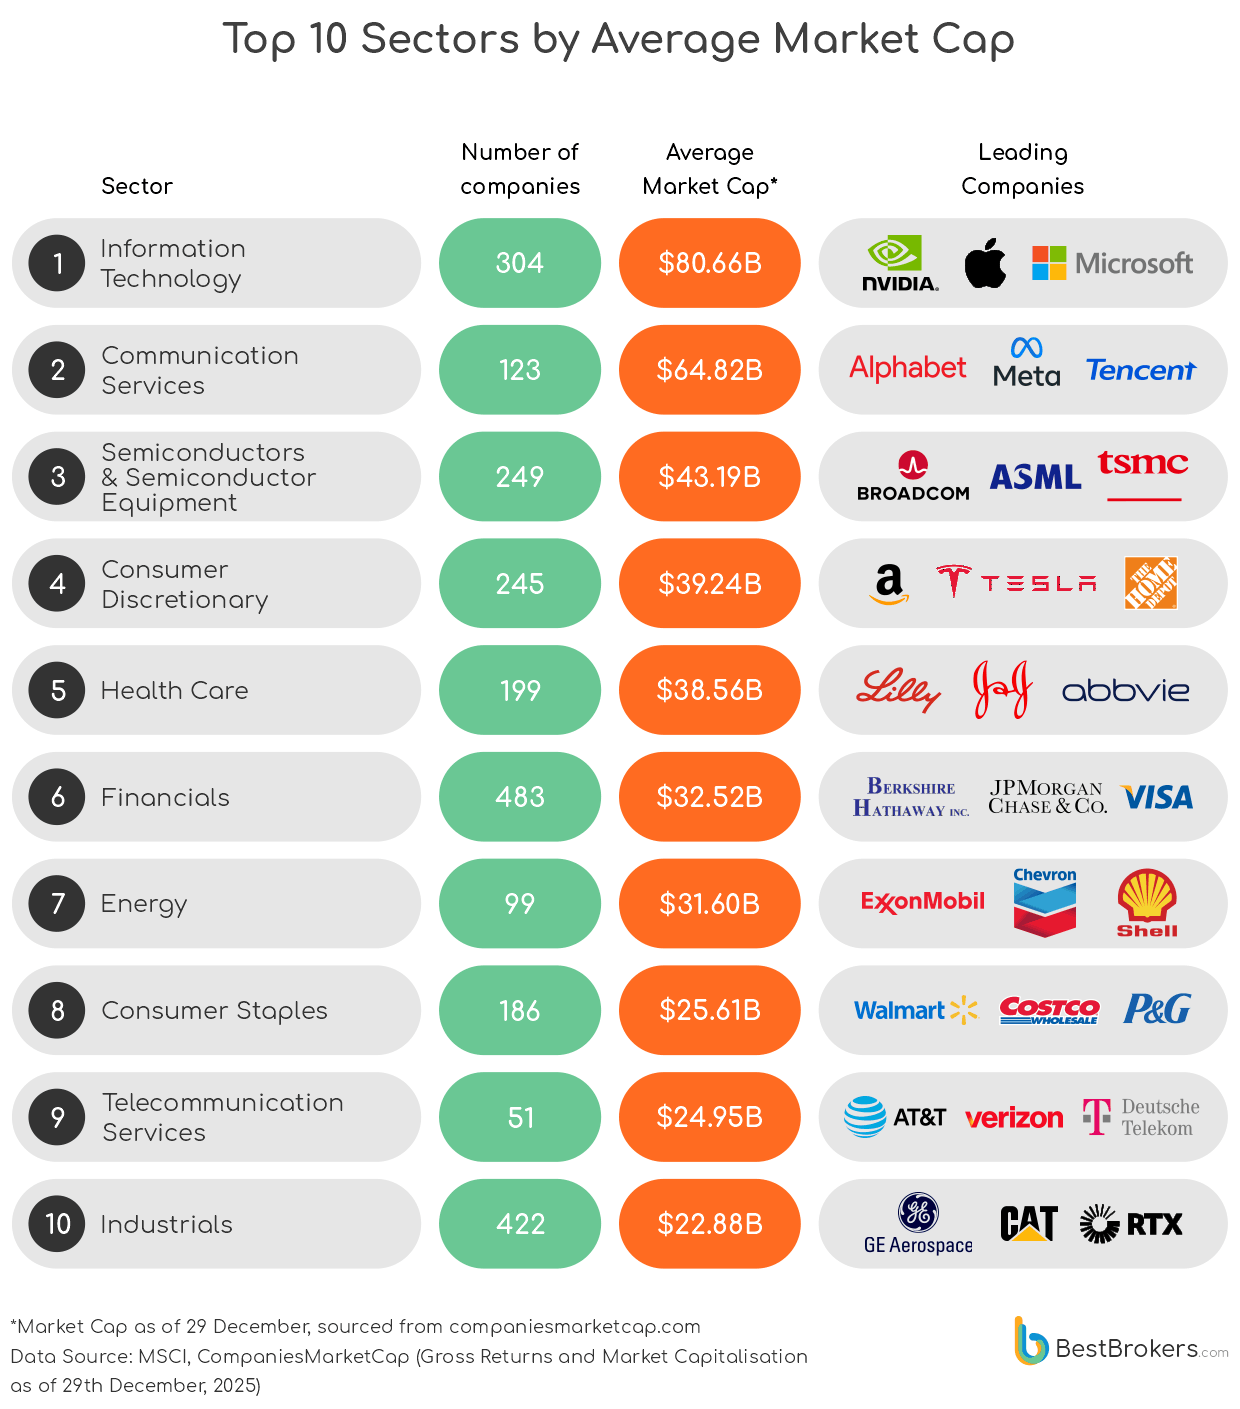
Cross-sector comparisons are informative, but they could be misleading if they are based solely on aggregate market valuations since each of the sector indices in our analysis covers a different number of companies. To make this comparison more meaningful, our team adjusted for the fact that MSCI ACWI sector indexes differ widely in the number of constituent companies. Using each index’s free-float-adjusted total market capitalisation and constituent count, we estimated the average market cap per company for each sector, and we also identified the largest constituents to highlight which companies dominate their respective sectors.
The hierarchy of average market capitalisations in 2025 reflects a year when strategic scale and geopolitical positioning mattered as much as earnings. Technology and communications giants such as NVIDIA, Apple, Alphabet, and Meta were not just the biggest by valuation; they became infrastructure bets for the AI decade, buoyed by multi-trillion-dollar milestones and continued demand for advanced chips amid global tech competition. Emerging trade-policy shifts and pauses in tariff escalation also helped reinvigorate semiconductor stocks, underscoring how policy moves directly shaped capital flows into hardware ecosystems. Meanwhile, sectors like energy and financials held their place near the top, suggesting that capital allocators still prize balance-sheet strength and resource control in a world shaped by tech-led growth and shifting global trade dynamics.
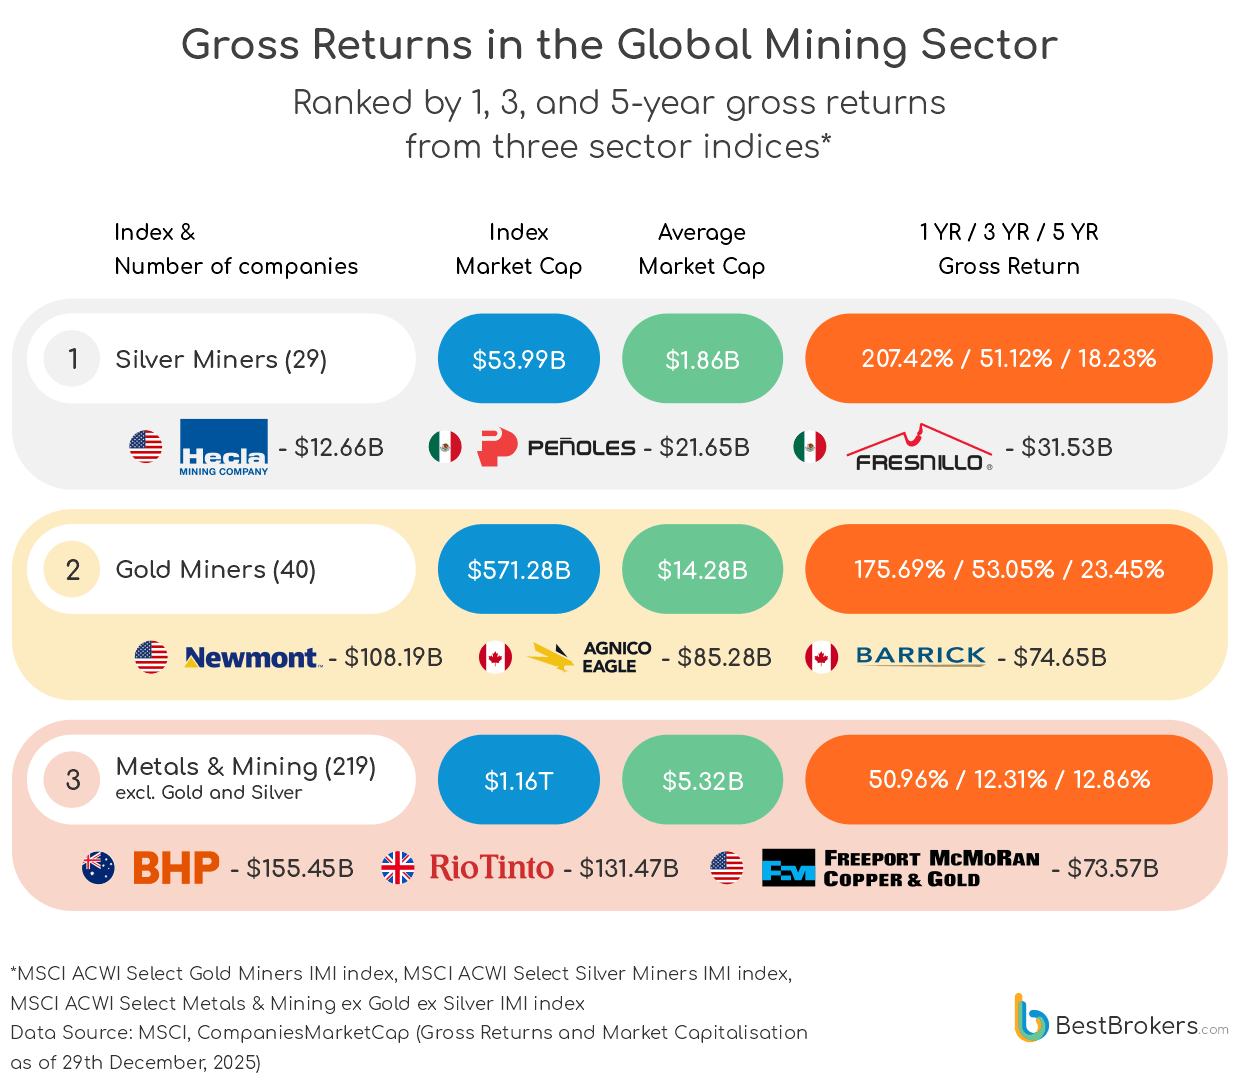
The spectacular returns in silver and gold mining last year were not abstract – they played out against record precious metals prices and strategic supply shifts that made these raw materials headline news. Silver supply shortfalls and historic rallies helped lift companies like Hecla, Industrias Peñoles, and Fresnillo, which saw strong production and pricing support amid tight inventories and surging industrial demand. Meanwhile, major gold producers such as Newmont expanded output and free‑cash‑flow strength, and Barrick’s strategic rebranding toward a broader mining portfolio showed how top miners repositioned amid evolving demand. These dynamics suggest investors were not just chasing safe havens, but betting on firms at the centre of supply constraints and structural market developments.
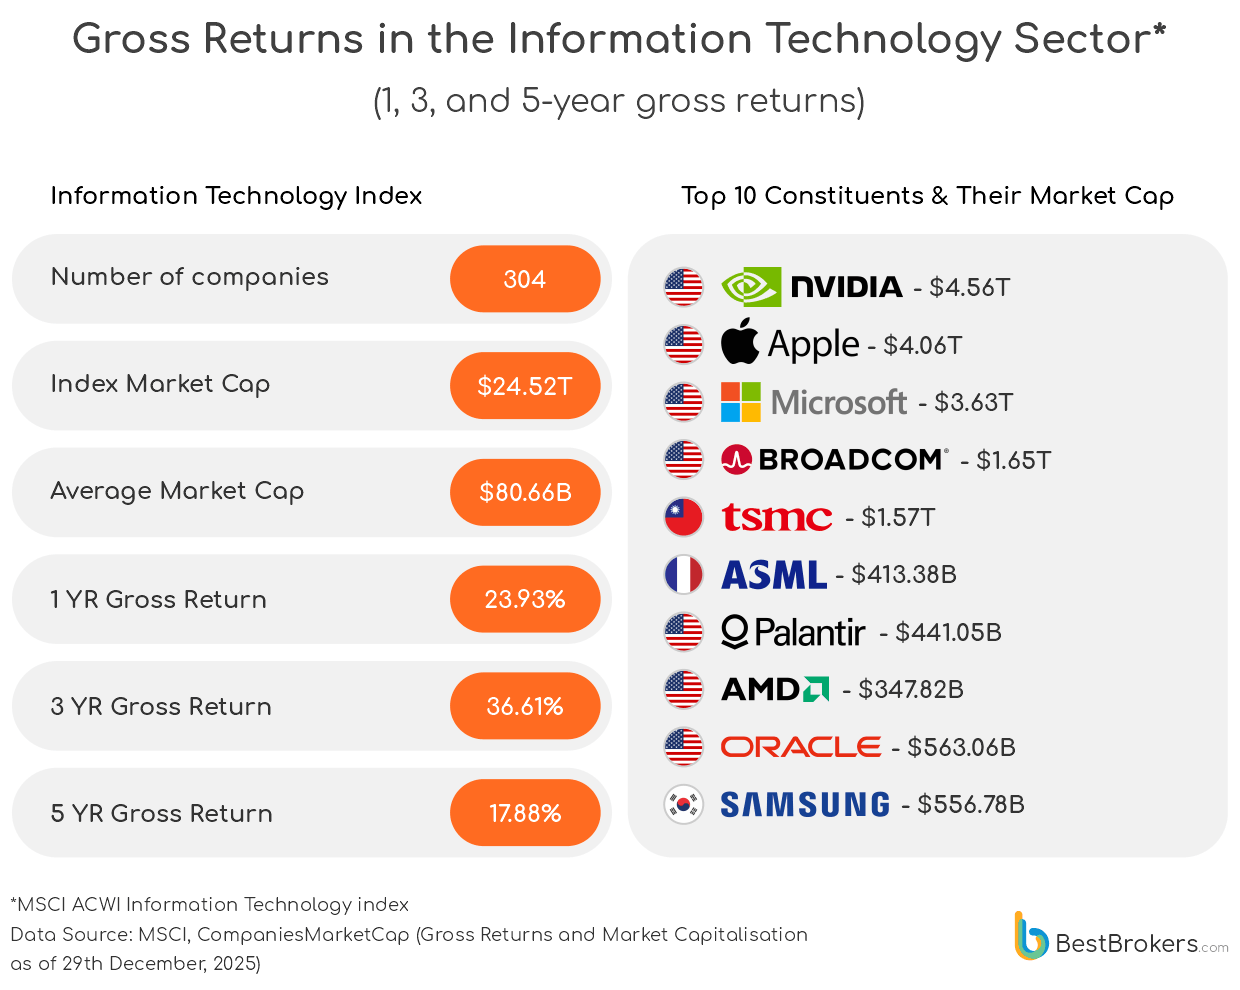
In 2025, the dominance of mega‑cap technology names mirrored the transformative rush into AI and advanced computing that defined the year. NVIDIA’s repeated milestone runs – briefly topping a $5 trillion valuation – symbolised the market’s obsession with next‑generation AI silicon and data‑centre demand, even as debates over valuation and geopolitical chip access simmered. At the same time, heavyweights like Apple and Microsoft remained valuation anchors, with Apple’s device ecosystem and services resilience sustaining investor confidence amid tightening hardware margins. Behind the scenes, chip foundry leaders such as TSMC advanced production of cutting‑edge nodes, reinforcing their role as indispensable infrastructure partners in the global tech stack, while equipment suppliers like ASML saw surging demand for next‑generation lithography systems that underpinned the industry’s growth outlook. The sector’s concentration at the top thus tells a story not merely of size, but of strategic positioning within the AI‑led reconfiguration of global technology supply chains.
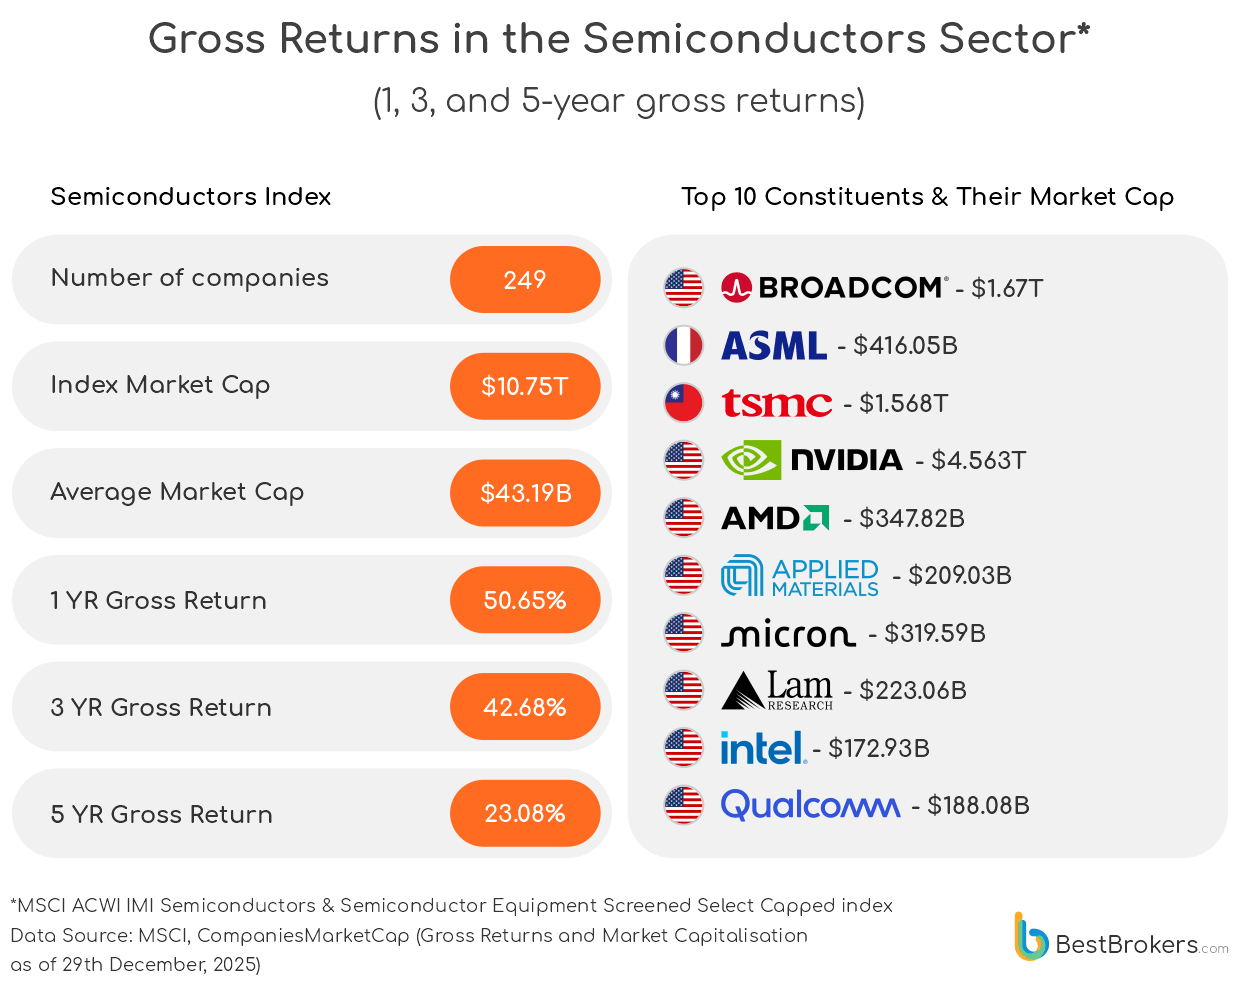
While the broader Information Technology sector remained a bastion of scale in 2025, the Semiconductors & Semiconductor Equipment index told a story shaped by the global race for compute capacity and manufacturing indispensability. Semiconductors outpaced IT’s one‑year return by more than double, reflecting how supply‑chain realignment, AI acceleration, and onshoring efforts redirected capital toward the companies that physically build the brains of modern digital infrastructure. Valuations of giants like NVIDIA, Broadcom, and TSMC benefited not just from software demand but from critical shortages and strategic prioritisation of advanced nodes. Meanwhile, equipment makers from ASML to Applied Materials rode heightened investment in next‑generation fabrication, reinforcing that 2025’s growth narrative was not only about what technology does, but how and where it’s made.
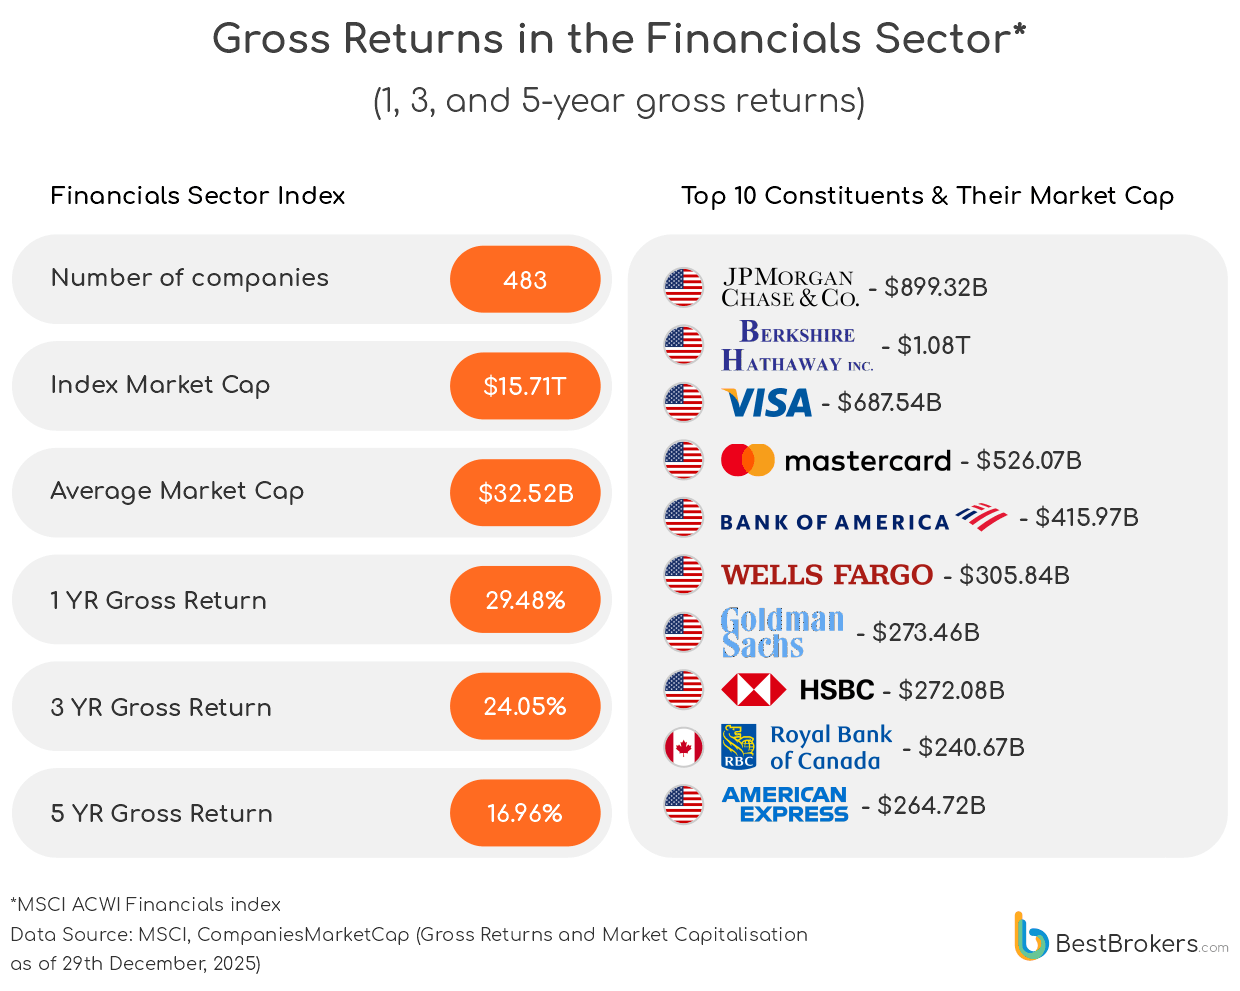
The Financials sector stood out for blending traditional banking resilience with continued growth in digital payments and fee‑based businesses. Major players such as JPMorgan Chase and Berkshire Hathaway, buoyed by strong loan growth and expanding investment portfolios, attracted attention as rising interest rates widened net interest margins and supported earnings. At the same time, Visa and Mastercard continued to benefit from sustained consumer spending, cross‑border travel recovery, and ongoing innovation in real‑time payments and cybersecurity frameworks, making payments infrastructure a standout within financials. The performance pattern last year suggests that while classic banking metrics still matter, the biggest financial gains were tied not just to balance‑sheet strength but to firms that have successfully adapted to the digital and data‑driven era.
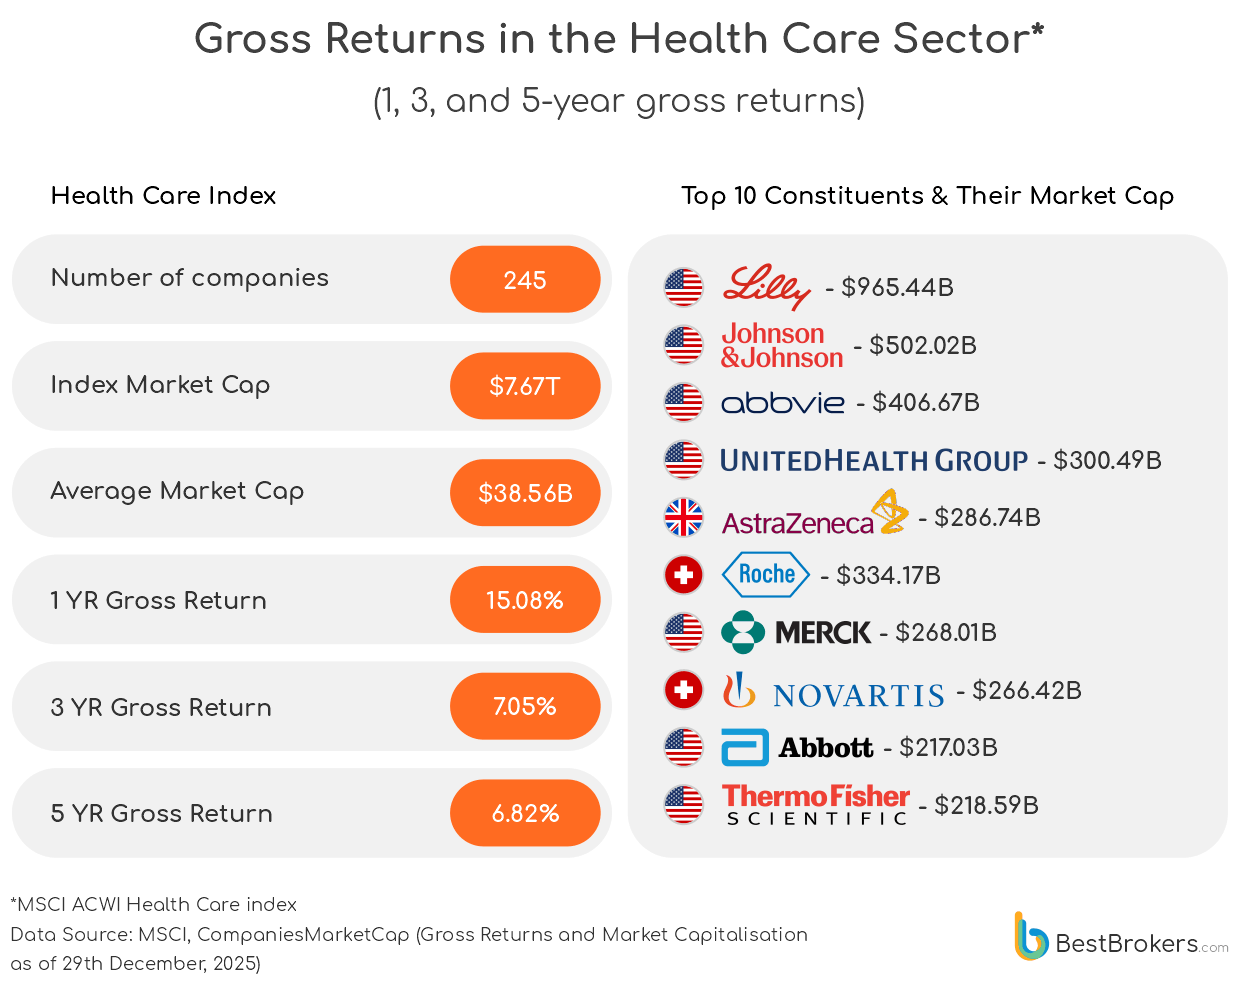
While Health Care didn’t match the blistering pace of tech or metals in 2025, the sector demonstrated resilience amid pricing pressures, regulatory scrutiny, and pandemic-era tailwinds. Eli Lilly and AbbVie captured headlines with blockbuster drug approvals and strong pipeline execution, while giants like Johnson & Johnson and Roche reinforced the steady cash flow that underpins long-term sector stability. Growth was concentrated not in volatility but in strategic innovation and M&A activity, highlighting that in Health Care, 2025’s returns were a product of scientific breakthroughs and portfolio management rather than market hype.
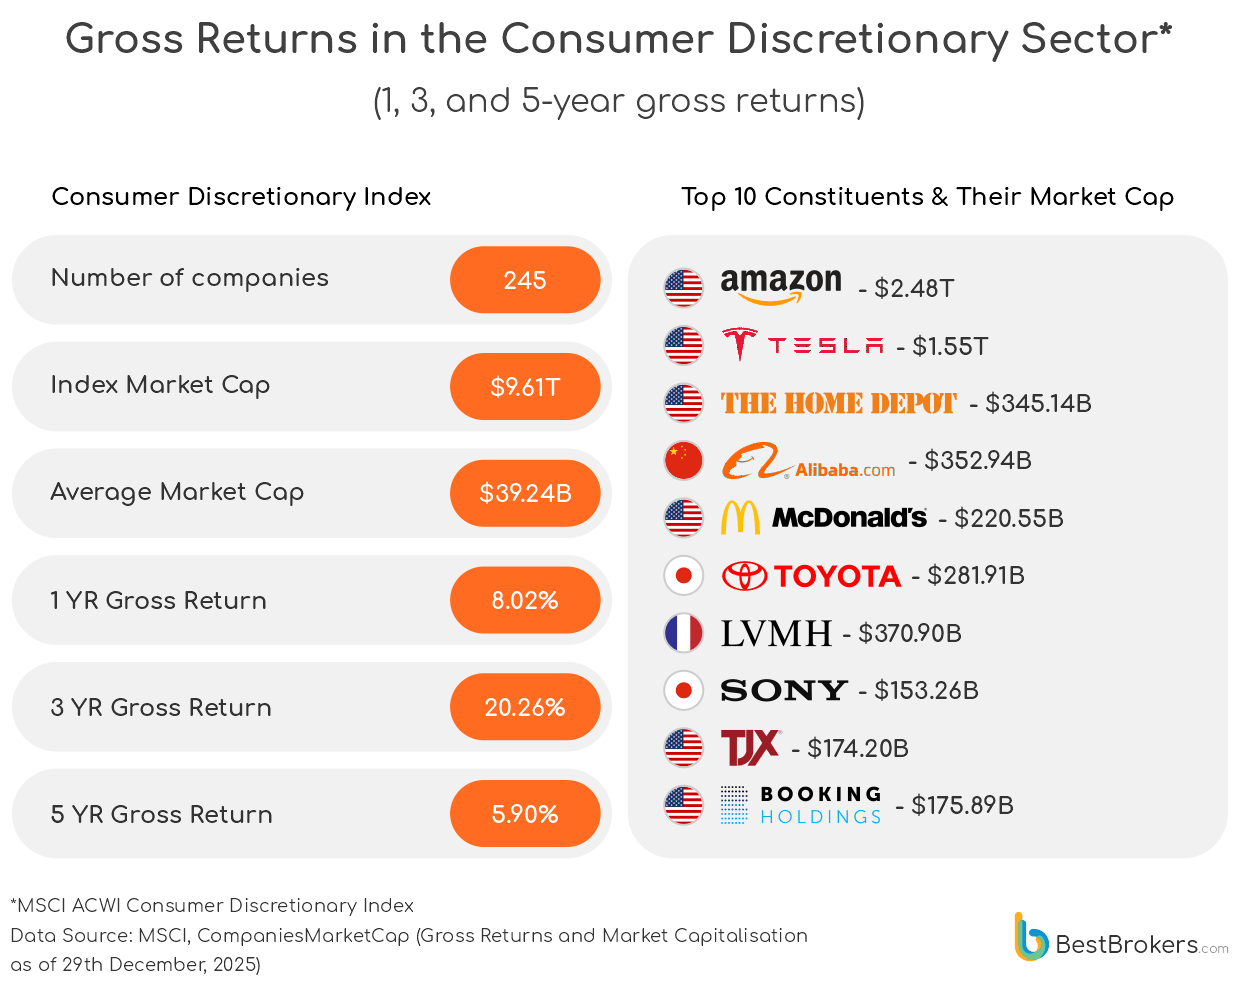
The Consumer Discretionary sector, home to companies that flourish when people spend on lifestyle, travel, and premium experiences, displayed uneven but captivating growth in 2025. Amazon and Tesla captured headlines with continued innovation and record-breaking sales, while retail stalwarts like Home Depot and TJX proved the resilience of everyday consumer demand. Meanwhile, luxury and travel icons such as LVMH and Booking Holdings, alongside global consumer favourites like restaurant chain McDonald’s, highlighted how global spending spans both everyday indulgences and aspirational purchases. Asian players, including Alibaba, Sony, and Toyota, proved that discretionary spending has become a truly international affair. Last year made clear that success in this sector hinged less on broad trends and more on each company’s unique combination of innovation, brand strength, and global reach.
2025 was a year that portrayed how structural depth and asset scarcity can outweigh cyclicality in shaping returns. Firms with ownership of key production capacities – from advanced node chip fabrication to constrained precious metals reserves – captured outsized performance, while diversified franchises with scale in payments, consumer platforms, and healthcare pipelines delivered quietly resilient outcomes. Heading into 2026, the investment landscape will likely prioritise companies that can monetise strategic rigour – whether through proprietary production moats, differentiated technology stacks, or defensible global supply footprints – as well as those capable of absorbing tightening financing conditions and evolving policy regimes. The challenge for markets in the year ahead will be distinguishing durable competitive advantage from episodic re‑rating, and allocating capital accordingly.
Methodology
For this analysis, we relied on MSCI ACWI Indexes, which comprehensively track large, mid, and small-cap companies across developed and emerging markets in 49 countries, providing a global perspective. We focused on sector-level indexes to capture performance across key industries, extracting information on the number of constituent companies, total and average market capitalisation, and gross returns over multiple horizons, from three months to ten years. To provide additional insight, we identified leading companies within each sector by market capitalisation, with individual company market caps sourced from CompaniesMarketCap as of 29 December 2025. Note that MSCI market-cap and constituent figures are not based on raw market capitalisation, but reflect free-float-adjusted market capitalisation of eligible securities, reviewed on a fixed schedule, while CompaniesMarketCap provides data on full market capitalisation of separate companies. All calculations use gross returns, reflecting total market performance before dividends, to enable consistent comparison across sectors and geographies. This methodology offers a data-driven view of market dynamics, capturing both structural and cyclical factors behind sectoral and corporate performance in 2025.