
As the world has entered the final quarter of 2025, national economies are navigating a complex mix of recovery, financial pressures, energy market shifts, and geopolitical uncertainty. Headlines often focus on nominal GDP, but these figures can be misleading, as inflation and price changes can distort the true value of economic output. Real GDP, which adjusts for these factors, provides a clearer picture of which economies are genuinely growing and which are struggling.
Over the past decade, these measures have highlighted countries that successfully adapted to global crises, as well as those that fell behind, making them particularly relevant today as policymakers and investors consider future strategies. To shed light on these dynamics, the team at Bestbrokers sourced International Monetary Fund (IMF) data from 2016 to 2025 (figures for 2025 are estimates), covering 135 countries, and calculated the real GDP, using the latest Gross Domestic Product figures and the so-called deflator indexes, which allowed us to adjust for inflation.
It comes as no surprise that global economic performance turns out to differ significantly: small nations such as Liechtenstein and Malta lead in ‘real’ per capita wealth, while major economies like the United States, China, and India continue to grow strongly, albeit with uneven internal distribution. Extreme inflation and currency fluctuations triggered sharp real GDP declines in Türkiye and Argentina, whereas nations such as Ghana and Ireland experienced rapid expansion.
What is Real GDP?
Real GDP measures the total value of all goods and services produced in an economy, adjusted for changes in prices over time. By accounting for inflation using a GDP deflator, real GDP reflects the actual growth of economic output rather than price increases. This adjustment allows for meaningful comparisons across years and reveals the underlying performance of an economy. Unlike nominal GDP, which can be skewed by rising prices, real GDP provides a more accurate picture of long-term trends and living standards. It is calculated by dividing the nominal GDP by the deflator, which is also published by the IMF on a regular basis.
2025 in Numbers: Real Output vs. Paper Wealth
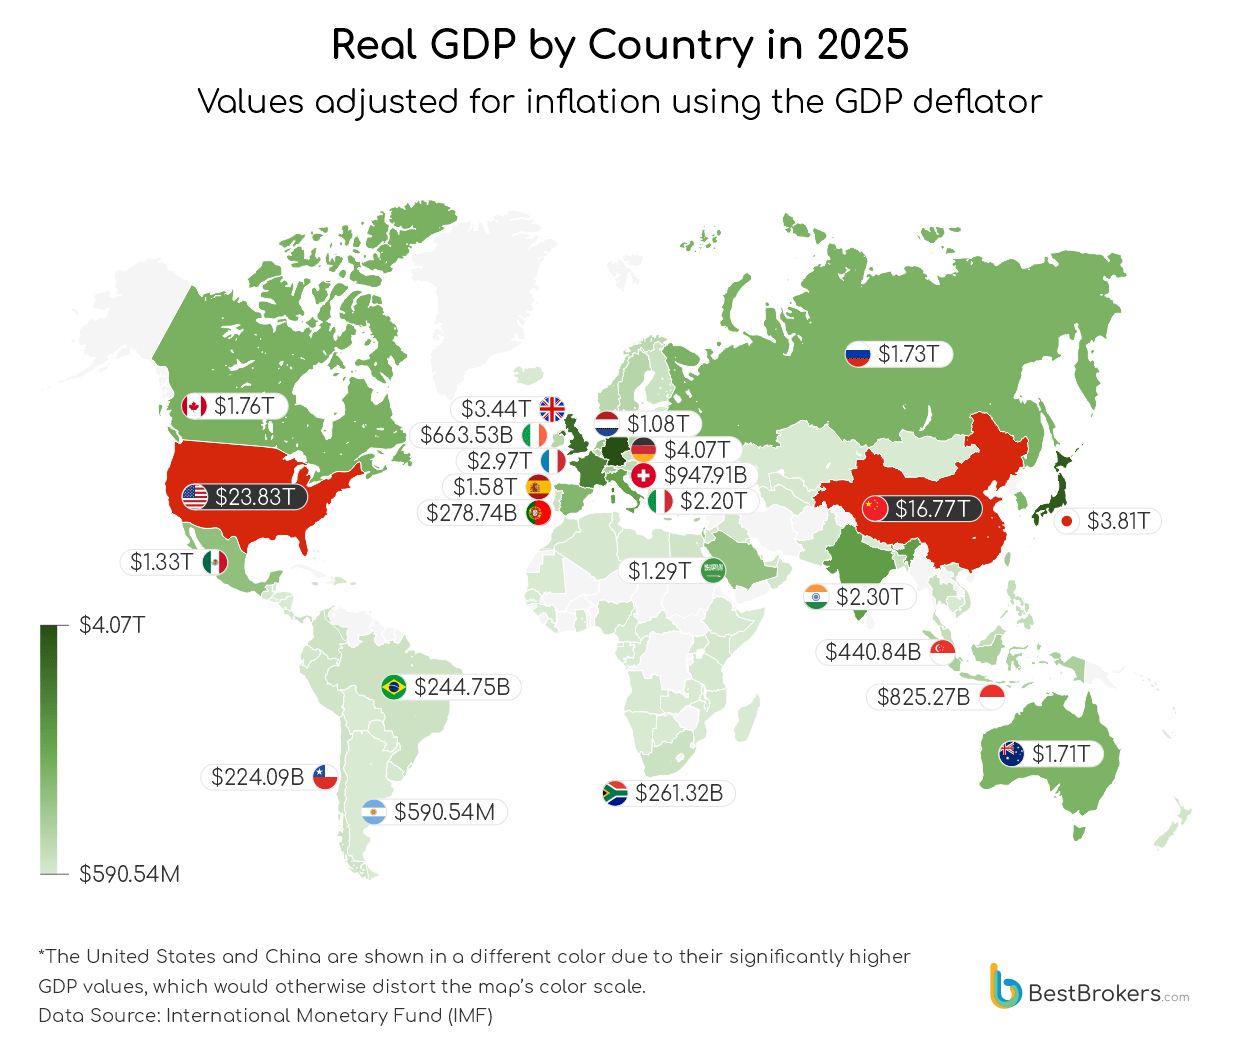
With a real GDP of roughly $23.8 trillion, the United States remains the world’s largest economy, though its momentum is clouded by political gridlock and rising price pressures. The federal government shutdown, which began on October 1, has left hundreds of thousands of federal workers without pay and shaken market confidence, while inflation expectations have edged upward. A myriad of federal employees remain unpaid, likely curbing consumer spending and weighing on economic growth, while the suspension of government programs and discretionary spending further constrains fiscal support at a time when market confidence is already fragile.
Across the Pacific, China, with a real GDP of about $16.8 trillion, faces the opposite challenge: persistent deflation and weak consumer sentiment, despite new stimulus measures to stabilise the property market and revive exports. In Europe, Germany, at $4.1 trillion, is struggling with structural stagnation even as a modest rebound in industrial output and easing energy costs suggest cautious optimism. Each of these economies is expanding in real terms, yet they are constrained by domestic vulnerabilities that reveal just how fragile post-pandemic growth remains.
India, often seen as a growth champion, tells a different story when prices are stripped out, its real GDP sinks to $2.3 trillion, nearly half its nominal value, revealing how rising prices and a weaker rupee have inflated success on paper. Saudi Arabia, by contrast, offers rare stability: steady oil exports, restrained inflation, and prudent fiscal policy have allowed its real output to slightly exceed nominal GDP, a sign of genuine resilience. Russia’s wartime economy moves the other way, its real GDP sliding to $1.7 trillion as sanctions and surging prices erode any nominal gains. Across Africa, Nigeria’s real GDP is roughly half its nominal value, while Ghana’s stands at about one-seventh and Ethiopia’s at around one-fifth of their respective nominal figures.
Per-Capita Reality Behind Big Numbers
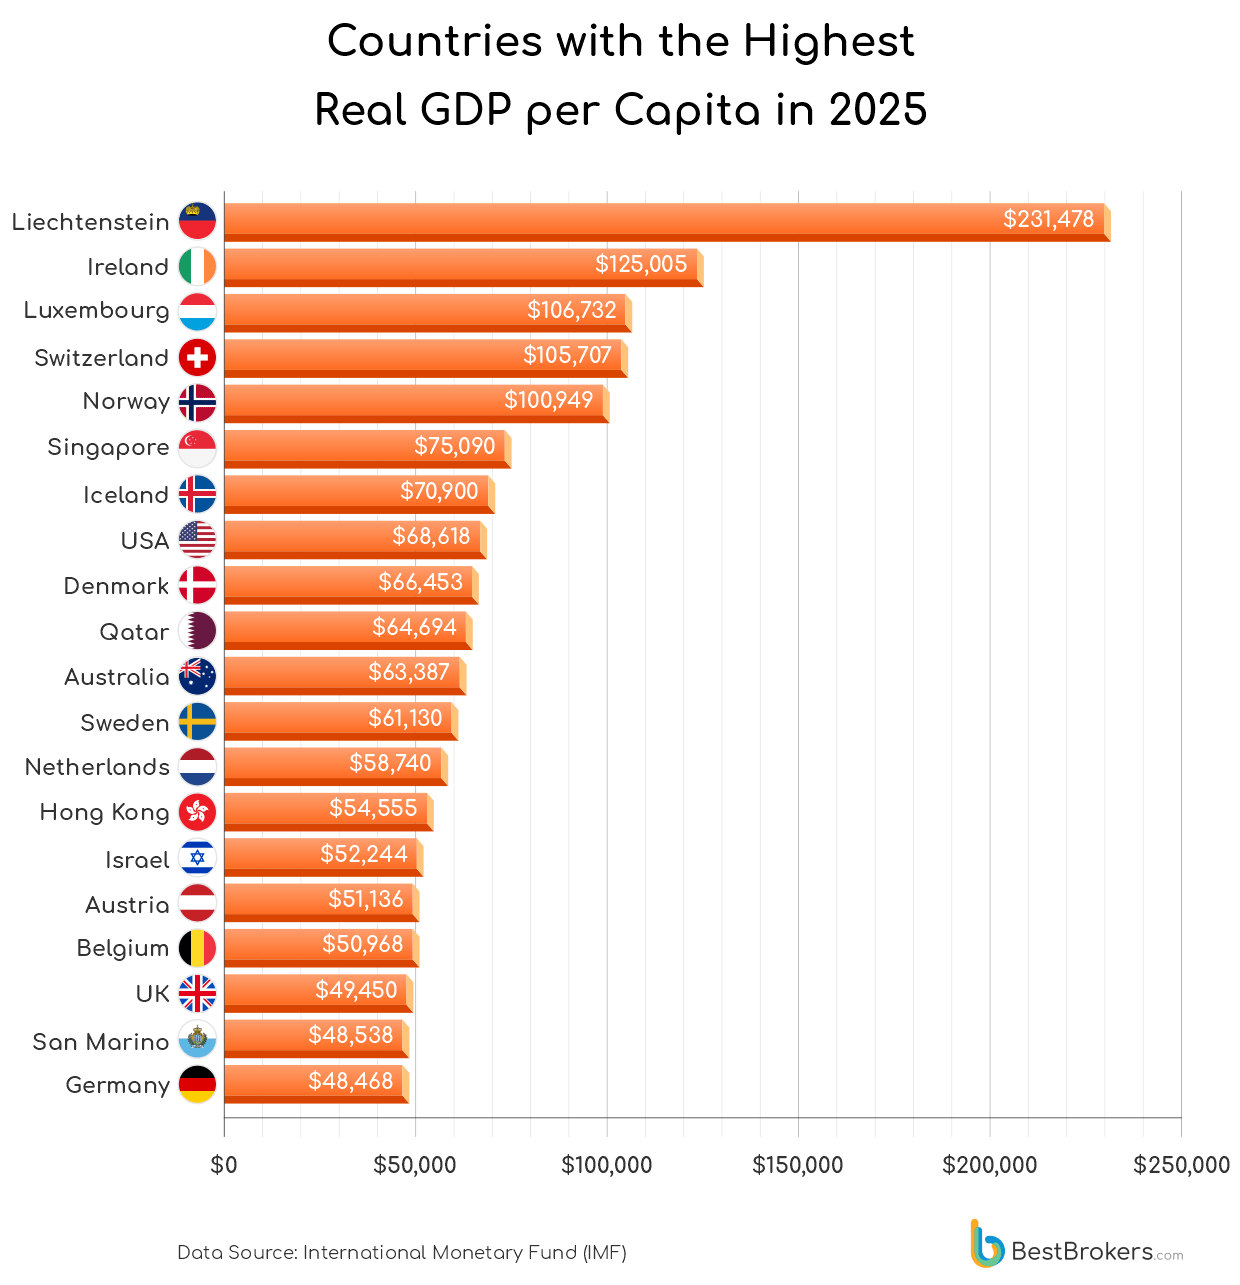
In Liechtenstein, the typical citizen’s share of economic output exceeds $231,000, a testament to a concentrated financial sector and low population. This makes the European microstate the wealthiest nation in the world when measured by real GDP per capita. Nearby, Ireland and Luxembourg convert their respective strengths in the technology sector and global finance into impressive per-person wealth and rank as the second and third-richest countries on this list. Following in fourth and fifth place, Switzerland and Norway demonstrate the quiet power of steady policy, resource management, and disciplined markets.
China’s enormous real GDP, the second-highest in the world at $16.77 trillion, masks the reality for its citizens, even as Beijing rolls out fresh stimulus to prop up consumption and support faltering exports. In Singapore and Australia, despite strong per capita results, debates over wage growth and cost-of-living adjustments are at the forefront, pointing to how per-person prosperity turns out to be inseparable from the daily pressures felt in stores, workplaces, and homes.
Small economies saw both the fastest growth and the steepest contractions in 2025
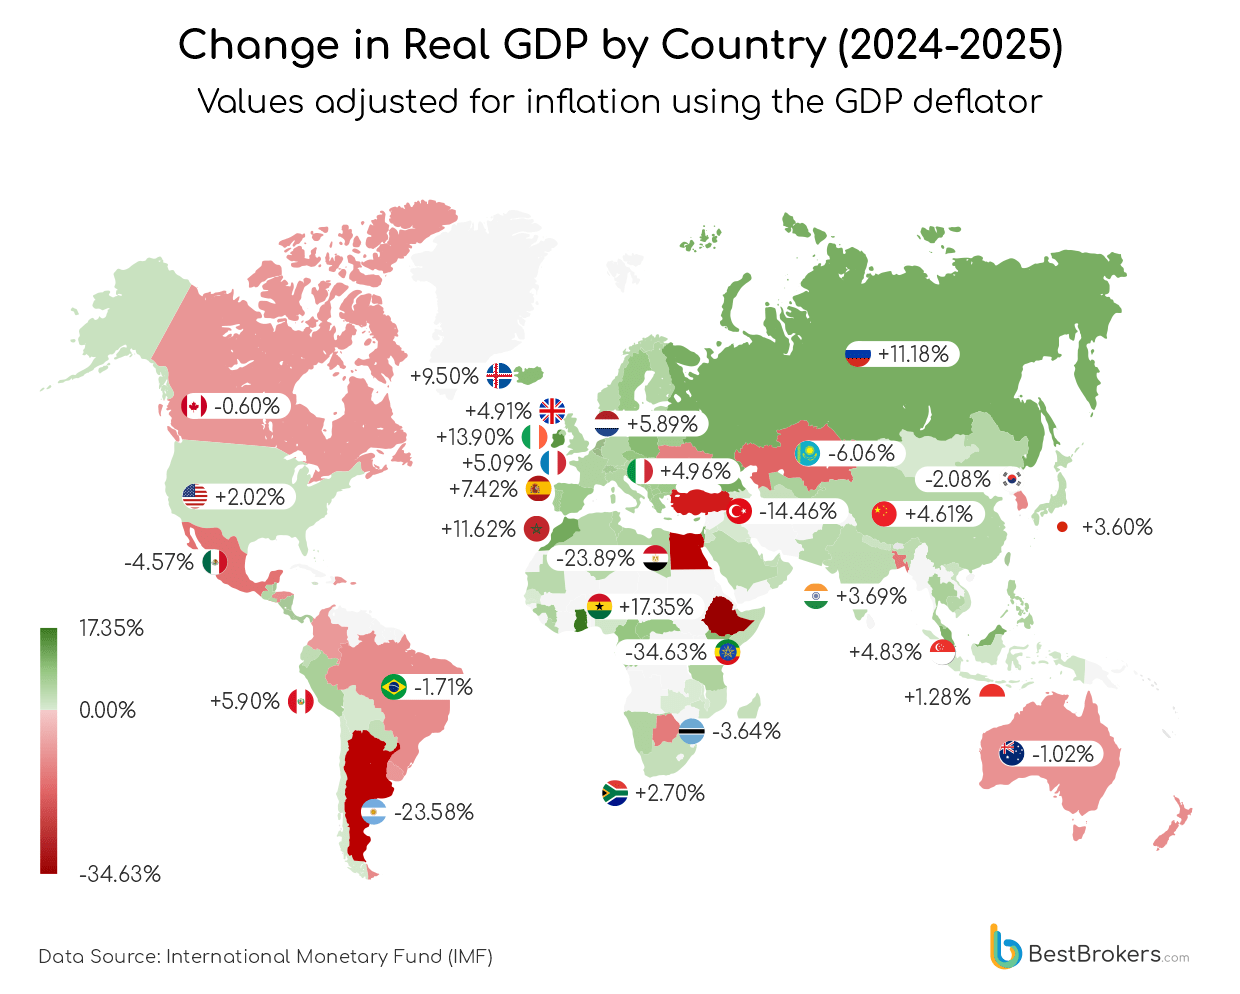
Change in real GDP usually reflects the underlying strength and vulnerabilities of an economy, but the time frame matters: long-term growth shows structural change, while one-year growth captures shocks, policy moves, and short-term swings. In 2025, real GDP growth highlights both extremes. Ghana surged by over 17%, driven by commodity prices and domestic demand, while smaller European economies like Ireland and Poland posted strong increases of 13.9% and 9.7%, respectively. Other notable performers include Morocco (+11.6%), Russia (+11.2%), Malaysia (+10.3%), Iceland (+9.5%), and Kenya (+9.5%).
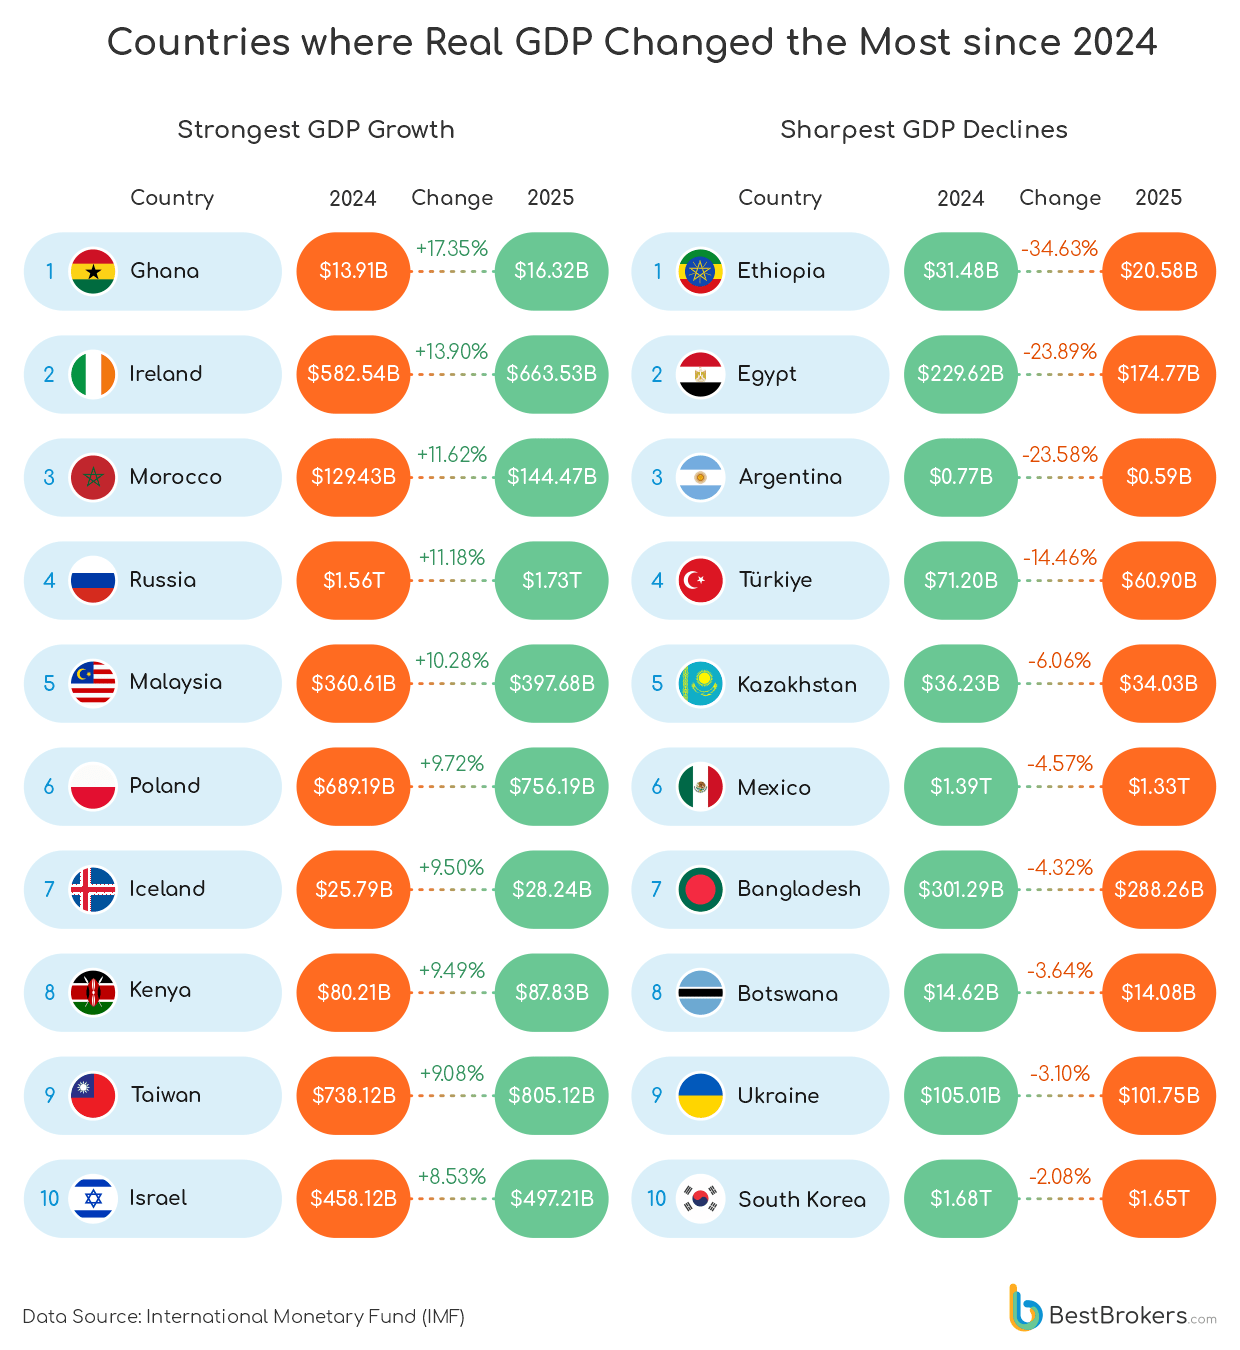
In contrast, Ethiopia saw the biggest decrease of -34.63%, despite its nominal GDP value recently jumping 9.2%, fuelled by industrial growth. In addition, Egypt, Argentina, and Türkiye also saw sharp contractions of 14-24%, due to the impact of currency volatility, debt pressures, and inflationary challenges. Even giants like China and the United States recorded modest expansions of 4.6% and 2%, respectively, whereas Japan, facing sluggish domestic demand, barely climbed 3.6%.
Ten Years of Change Prove Able to Double or Collapse National Economies
A decade of change in real GDP can reveal an economy’s long-term adaptability, highlighting both resilience and fragility. Consistent increases in this metric indicate improvement in productivity, job creation, higher standards of living for the population, and overall economic growth. Negative percentages, on the other hand, point to contraction and a broader negative impact on the country.
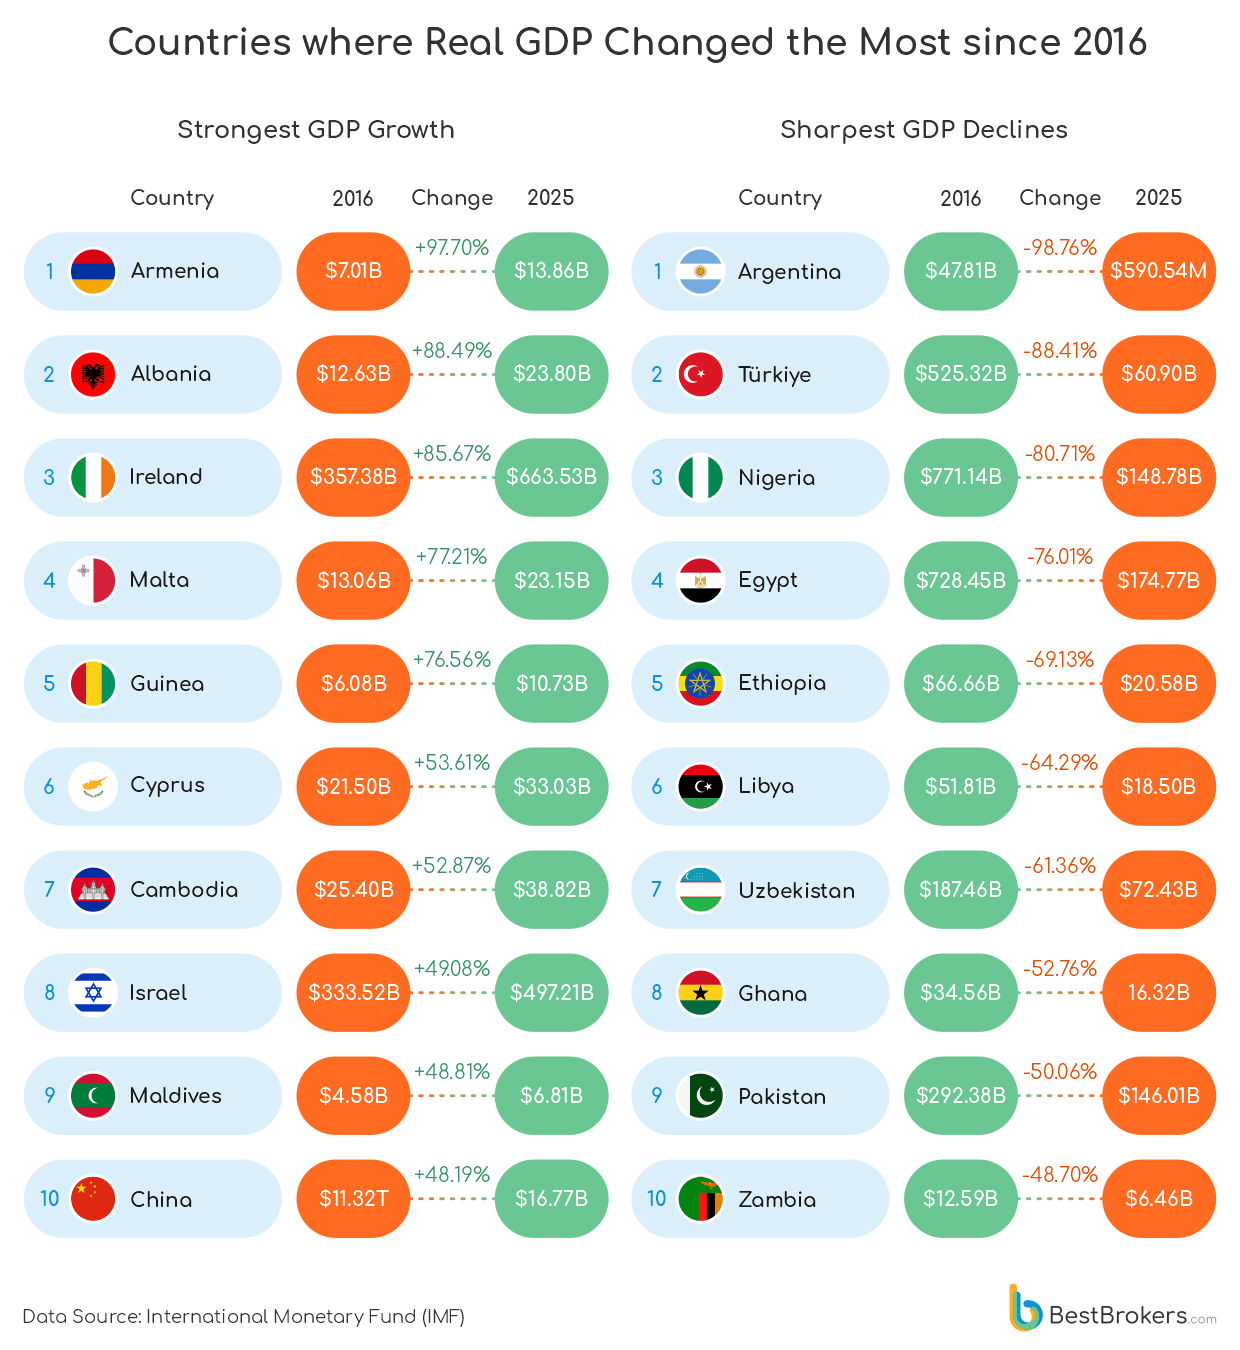
Our calculations show that Armenia’s economy has almost doubled over the past ten years, surging 97.7% thanks to bold reforms and deeper regional ties. Across the Balkans, Albania rode a wave of optimism, growing 88.5% as EU accession hopes and major infrastructure projects fueled expansion. Yet not every story is one of growth: Türkiye plunged 88.4%, buffeted by political turmoil, a weakening currency, and soaring inflation, while Argentina’s economy nearly collapsed, shrinking 98.8% under the weight of hyperinflation that has seen prices skyrocket thousandfold, alongside a mounting fiscal crisis.
What Lies Ahead?
The global economy is entering a phase of increasingly uneven growth, with advanced economies like the U.S. maintaining moderate resilience through strong consumer spending and investment in AI and green technologies, while parts of Europe and East Asia face stagnant expansion due to weak demand, aging populations, and industrial slowdowns. At the same time, emerging markets in South and Southeast Asia, the Middle East, and parts of Africa are poised for faster growth, fueled by demographics, infrastructure investment, and digital transformation, suggesting that in the future we will see slower overall growth but a gradual shift in global economic influence toward younger, faster-growing regions.
Methodology:
For this report, International Monetary Fund (IMF) data from 2016 to 2025 was used, including nominal GDP, population, and GDP deflators. Real GDP was calculated by adjusting nominal GDP for inflation: the nominal GDP of a given year was divided by that year’s GDP deflator (expressed as an index) and then multiplied by 100. This allows comparison of economic output over time, removing the effect of price changes. Changes since 2024 were calculated for short-term growth analysis, while 10-year real GDP changes were measured as the percentage difference between 2025 and 2016, highlighting long-term growth trends. Per capita GDP was derived by dividing real GDP by population for each year. All figures are in US dollars.