
The new year brought more than resolutions for Americans – it ushered in sudden changes to how they earn and keep their money. Millions now face higher healthcare premiums, stricter work requirements for food assistance, and shifts in federal taxes: permanent extensions of Trump’s 2017 tax cuts, a higher SALT deduction cap, and temporary exemptions on tips and overtime pay. For households across the income spectrum, these changes are reshaping take-home pay, deductions, and the relative burden of taxes, leaving some middle earners feeling squeezed while higher earners benefit from expanded exemptions and deductions.
Inspired by the evolving tax landscape, the team at BestBrokers conducted a comprehensive analysis of state-level individual income taxes for tax year 2025 (with returns filed in early 2026), revealing the states with the highest and lowest taxes, as well as those with marriage penalty or bonus when filing as a couple.
Key takeaways:
- California (9.3%), Oregon (8.8%), and Washington, D.C. (8.5%) levy the highest personal income taxes for single earners (applied to those making between $70,000 and $75,000 in gross wages).
- In Iowa (-33%), Louisiana (-29%), and Arkansas and Nebraska (-11% each), single taxpayers in the middle brackets experienced the largest declines in state income tax rates between 2024 and 2025.
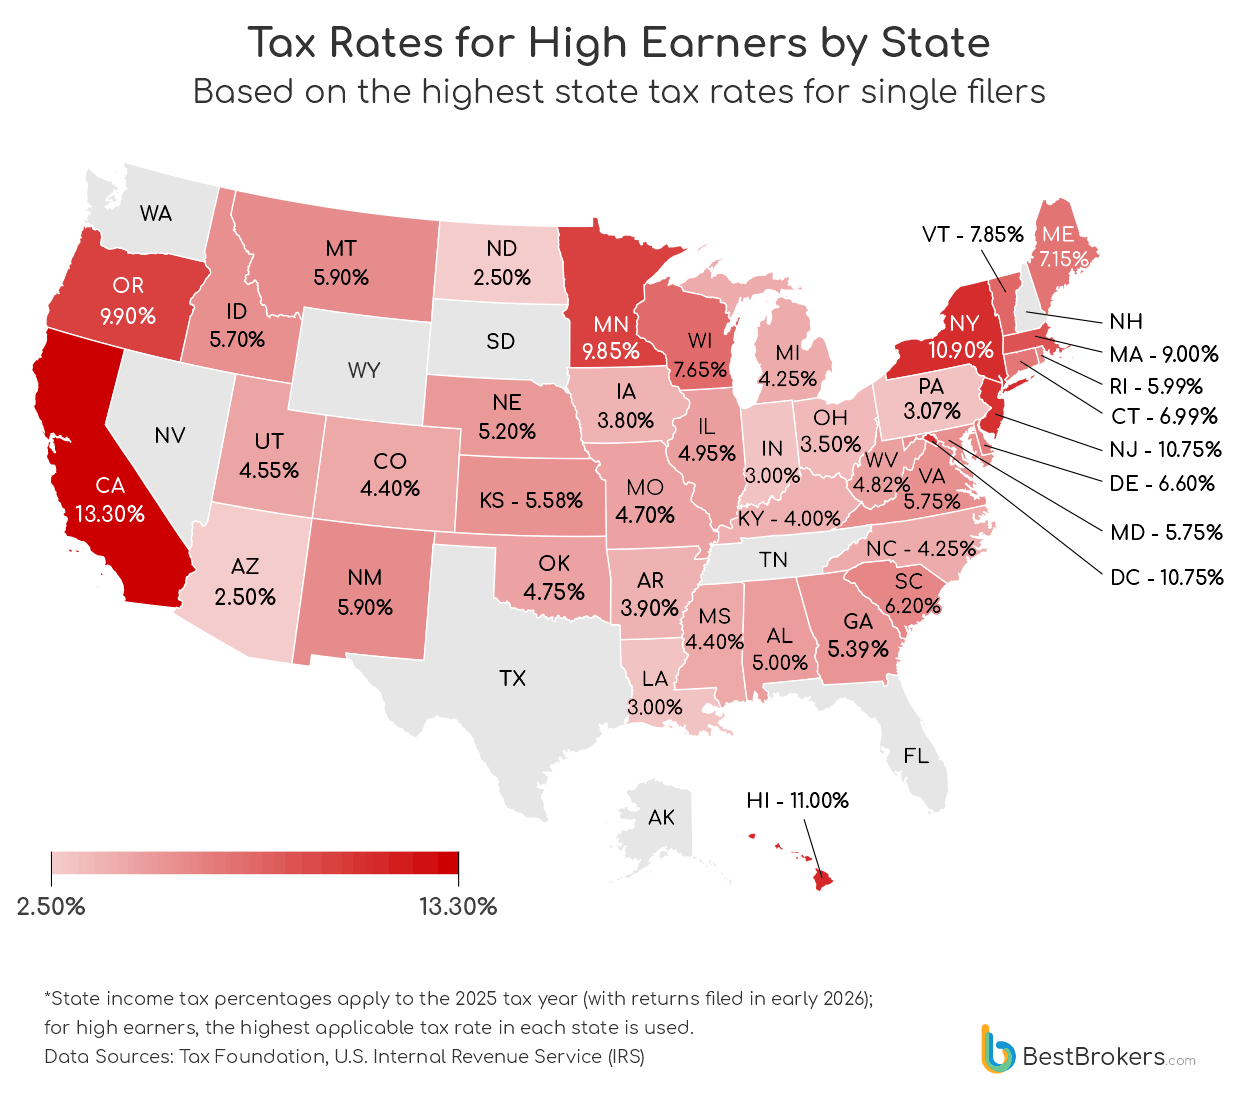
- High earners filing as singles saw the largest tax rate increase in Massachusetts, where rates climbed 80% (from 5% to 9%) between 2020 and 2025. New York, New Mexico, and Washington, D.C. followed, each with increases of around 20%.
- Marriage “penalties” affect 18 states, hitting D.C. the hardest at $8,173 annually for married couples, with Delaware ($7,008) and West Virginia ($5,724) also ranking among the most costly.
Which States Take the Biggest Share of Average Income?
Nine U.S. states – Alaska, Florida, Nevada, New Hampshire, South Dakota, Tennessee, Texas, and Wyoming – levy no personal income tax, allowing residents to keep a larger portion of their gross wages. But “no state income tax” does not mean full take-home pay: workers still owe federal income tax, Social Security and Medicare contributions, and, in some cases, local taxes or other deductions. These states fund public services through alternative revenue streams, such as sales, property, excise, or resource taxes, which can shift the cost structure in ways that affect households differently. As a result, while residents enjoy immediate relief from state income levies, overall taxation and earnings vary widely depending on local economies, industry wages, and federal obligations.
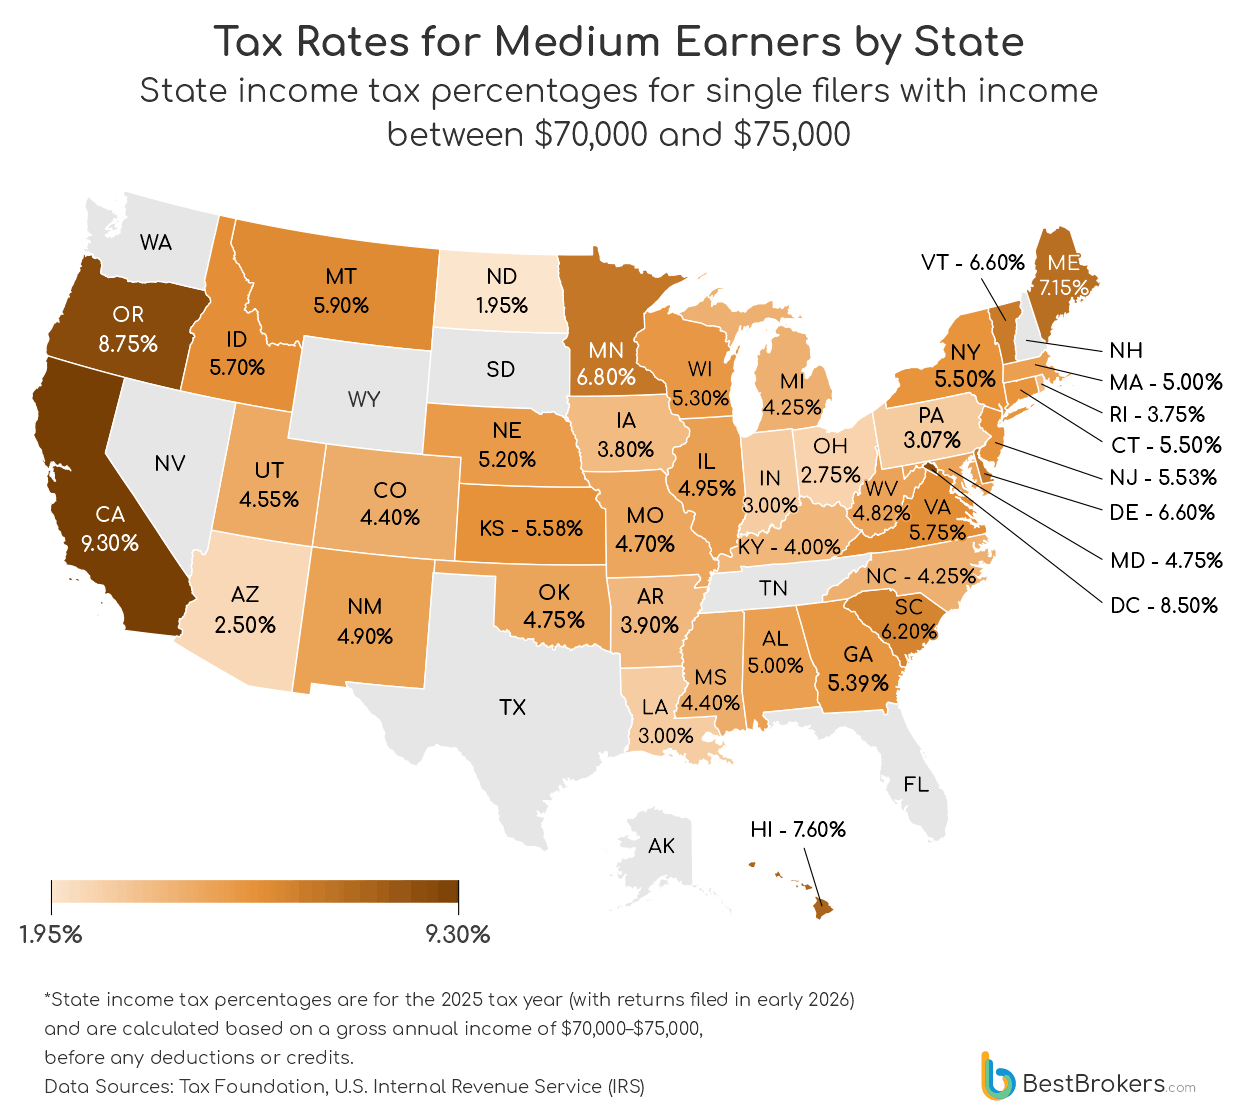
California, Oregon, and Washington, D.C., carry the highest personal income tax rates, ranging from 8.5% to 9.3%, followed by Hawaii at 7.6% and Maine at 7.15%. High wages partly explain this pattern: D.C. averages $56.56/hour (the nation’s highest hourly earnings) and California $41.98/hour, whereas Maine, despite its steep rates, ranks among the lowest-paid states – $32.96/hour – making income tax a comparatively heavier burden, even if other taxes are modest.
The lowest personal income tax rates are found in North Dakota (1.95%) and Arizona (2.5%), followed by Indiana and Louisiana at 3%. In terms of wages, most of these states fall near the mid-range, with only Louisiana standing out as a lower-income state, where the average hourly earnings of $30.32 rank 48th nationally.
U.S. States Where Medium-Earner Tax Rates Fell the Most Since 2024
*State income tax percentages apply to the 2025 tax year (with returns filed in early 2026) are calculated based on a gross annual income of $70,000-$75,000, before any deductions or credits.
Data Source: Tax Foundation, U.S. Internal Revenue Service (IRS)
In 2025, a notable wave of state tax relief for middle‑income households swept across much of the country, driven in large part by deliberate legislative reforms. Iowa’s shift to a flat 3.8% income tax, down sharply from a top rate of 5.7%, produced the biggest one‑year reduction for medium income earners (-33%) and one of the steepest five‑year drops (-55%), as lawmakers sought to simplify and lower the tax burden amid broader calls for fiscal relief. Louisiana followed with a -29% one‑year change (from 6% to 4.25%) and a -50% five‑year decline after adopting a 3% flat tax structure, a move accompanied by higher sales taxes to offset lost revenue. Arkansas and Nebraska also implemented double‑digit cuts, part of a broader pattern of income tax rate reductions that included North Carolina, West Virginia, Mississippi, South Carolina, and Utah under 2025 reforms.
How Do State Income Tax Rates Compare for High Earners?
High earners in the United States face sharply tiered state taxes that can consume a striking share of their income. California tops the list with a top marginal rate of 13.3%, which applies to single filers earning over $1 million, following a series of progressive brackets beginning at 1% for the first dollar. Hawaii imposes 11% on incomes above $325,000, while New York State reaches 10.9% only at the ultra‑high threshold of $25 million, though intermediate brackets above $215,000 already push many professionals into double-digit rates. Washington, D.C. and New Jersey both hit 10.75% for millionaires, but their graduated structures start as low as $10,000 and $0, respectively, meaning upper-middle earners feel the climb well before the top rates.
These progressive systems have entered the 2025 spotlight amid political debates and migration considerations. In California, discussions around a proposed billionaires’ tax and rising effective rates have fueled speculation among tech executives about relocating to low-tax states like Florida or Texas. Despite these high brackets, research suggests that higher top marginal rates do not necessarily trigger mass departures of wealthy taxpayers, though they do factor into long‑term relocation and investment decisions
The result is a complex interplay between gross wages, bracketed state taxes, and take-home pay, where location choices, effective rates, and even career decisions for high earners are influenced as much by tax design as by raw salaries.
U.S. States Where High-Earner Tax Rates Increased the Most Since 2020
*State income tax percentages apply to the 2025 tax year (with returns filed in early 2026); for high earners, the highest applicable tax rate in each state is used.
Data Source: Tax Foundation, U.S. Internal Revenue Service (IRS)
Since 2020, a small group of states have substantially sharpened their tax bite on high earners. Massachusetts leads the states with an 80% increase (from 5% to 9%) in its top effective marginal rate, driven by the Fair Share Amendment – a 4% surtax on income over $1 million that has significantly boosted revenue for education and transportation projects and, counter to critics’ predictions, has not driven away the wealthy. A report by Wealth-X found the number of millionaires in the state actually grew sharply even after the surtax took effect, and the extra revenue continues to exceed projections.
New York’s high-earner tax rate climbed about 23.6% (from 8.8% to 10.9%) over the same period as the state reaffirmed its progressive brackets amid ongoing budget pressures and high costs of living, even as local political debate around additional ‘millionaire tax’ proposals in New York City continues to capture headlines. New Mexico and Washington, D.C., each raised top brackets by around 20%, reflecting broader 2020s trends toward tightening revenue structures for the wealthiest residents as states grapple with public service funding and fiscal sustainability.
Together, these changes illustrate how some states are increasingly using bracketed top rates to capture additional revenue from their wealthiest classes – a shift that remains central to fiscal debates in 2026.
How Do State Tax Systems Treat Married Couples?
To assess the impact of marriage on state income taxes, we modelled single and married taxpayers each earning $75,000. For single filers and those married filing separately, we applied a standard deduction of $15,750, while for married couples filing jointly, we used $31,500, assuming both spouses earn $75,000 each. This approach allows for a direct comparison between the combined tax liabilities of two singles versus the same couple filing jointly. The difference indicates a marriage penalty (if the couple pays more jointly than as two individuals) or a marriage bonus (if they pay less).
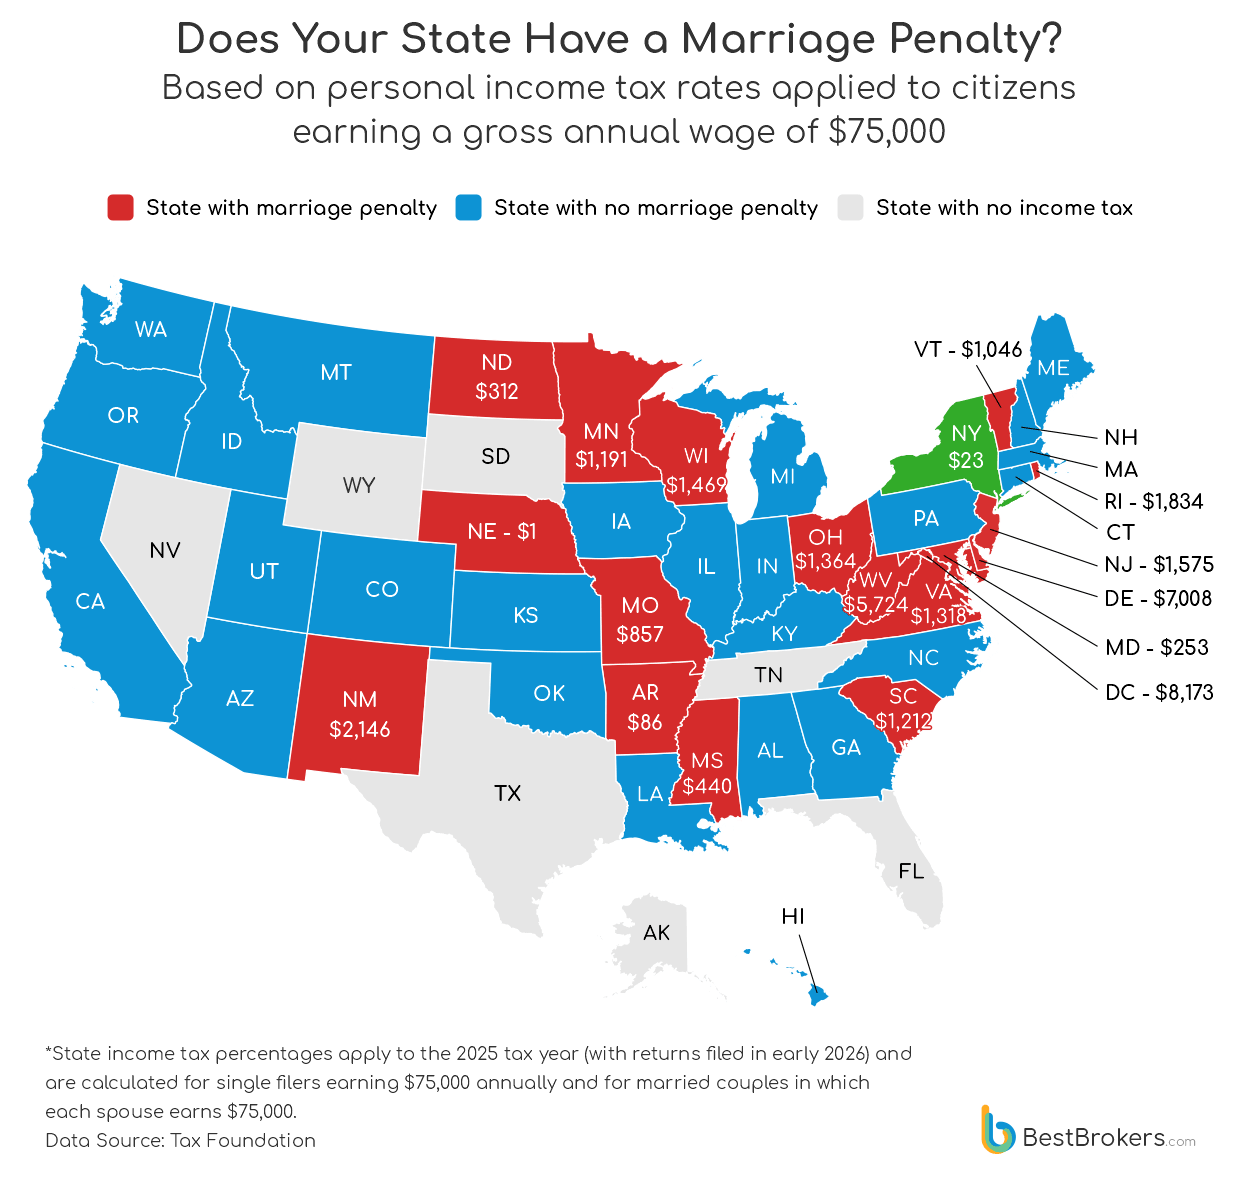
The results highlight significant disparities across states. Washington, D.C., imposes the steepest marriage penalty, costing a married couple an extra $8,173 annually compared to two individual filers. Delaware ($7,008) and West Virginia ($5,724) also have notable penalties, largely due to the way their progressive brackets and deductions interact at this income level. Other states, like Maryland, Arkansas, and Nebraska, show negligible penalties, while New York is the only state with a slight marriage bonus, reducing taxes by $23 for a couple compared with two singles.
These calculations illustrate how state-specific tax structures, progressive brackets, and deductions combine to create either a financial advantage or disadvantage for married couples, even at moderate incomes. In practice, some couples file jointly even when only one spouse works, which can amplify the marriage penalty or bonus depending on the state. This has become increasingly relevant in 2025 and continues to be in 2026, as discussions over state tax fairness, dual-income households, and relocation incentives continue to surface in national and local policy debates.
Methodology
All data in this report is sourced from the Tax Foundation and U.S. Internal Revenue Service (IRS). For the medium-earner rankings, we used the marginal rate corresponding to a $75,000 gross income in each state’s bracketed system, while for high-earner rankings, we captured the highest marginal rate available in states with progressive brackets and applied the fixed rate in states without brackets. For the marriage penalty analysis, we modelled single and married filers each earning $75,000, applying the standard deduction of $15,750 for single filers and $31,500 for married couples filing jointly, allowing us to compare the combined liabilities of two singles versus joint filing. This methodology ensures a consistent, comparable framework to assess effective state tax burdens across income levels, filing statuses, and tax structures.