
Europe’s generous welfare systems provide universal healthcare, decent pensions, reliable public transport, and high-quality education, but these benefits do not come cheap. For most workers, that cost is visible every month in the form of income tax and social security contributions, which are automatically deducted from wages before they hit the bank account.
With rising living costs and slow wage growth, questions about fairness have become more common: who bears the heaviest tax burden, and how do taxes on average wages in many European countries compare to headline rates for high earners?
To better understand how much of a typical European’s earnings are taken in taxes, the BestBrokers team analysed OECD’s Taxing Wages data, focusing on income tax and employee social security contributions for workers on the average salary from 2020 to 2024. The report also incorporates the Tax Foundation’s 2025 data on top statutory personal income tax rates, allowing a comparison between what high earners are legally charged and what most workers actually pay.
Quick facts to keep in mind
- The top statutory personal income tax rates used here are the marginal rates that apply to the highest income bracket in individual European countries.
- Average-worker tax burdens are a combination of income tax and employee social security contributions.
- The analysis covers national-level taxes only: local/regional taxes, non-labour levies, tax credits, and household composition effects are not included.
Top Statutory Rates: How Europe Taxes Its Highest Earners
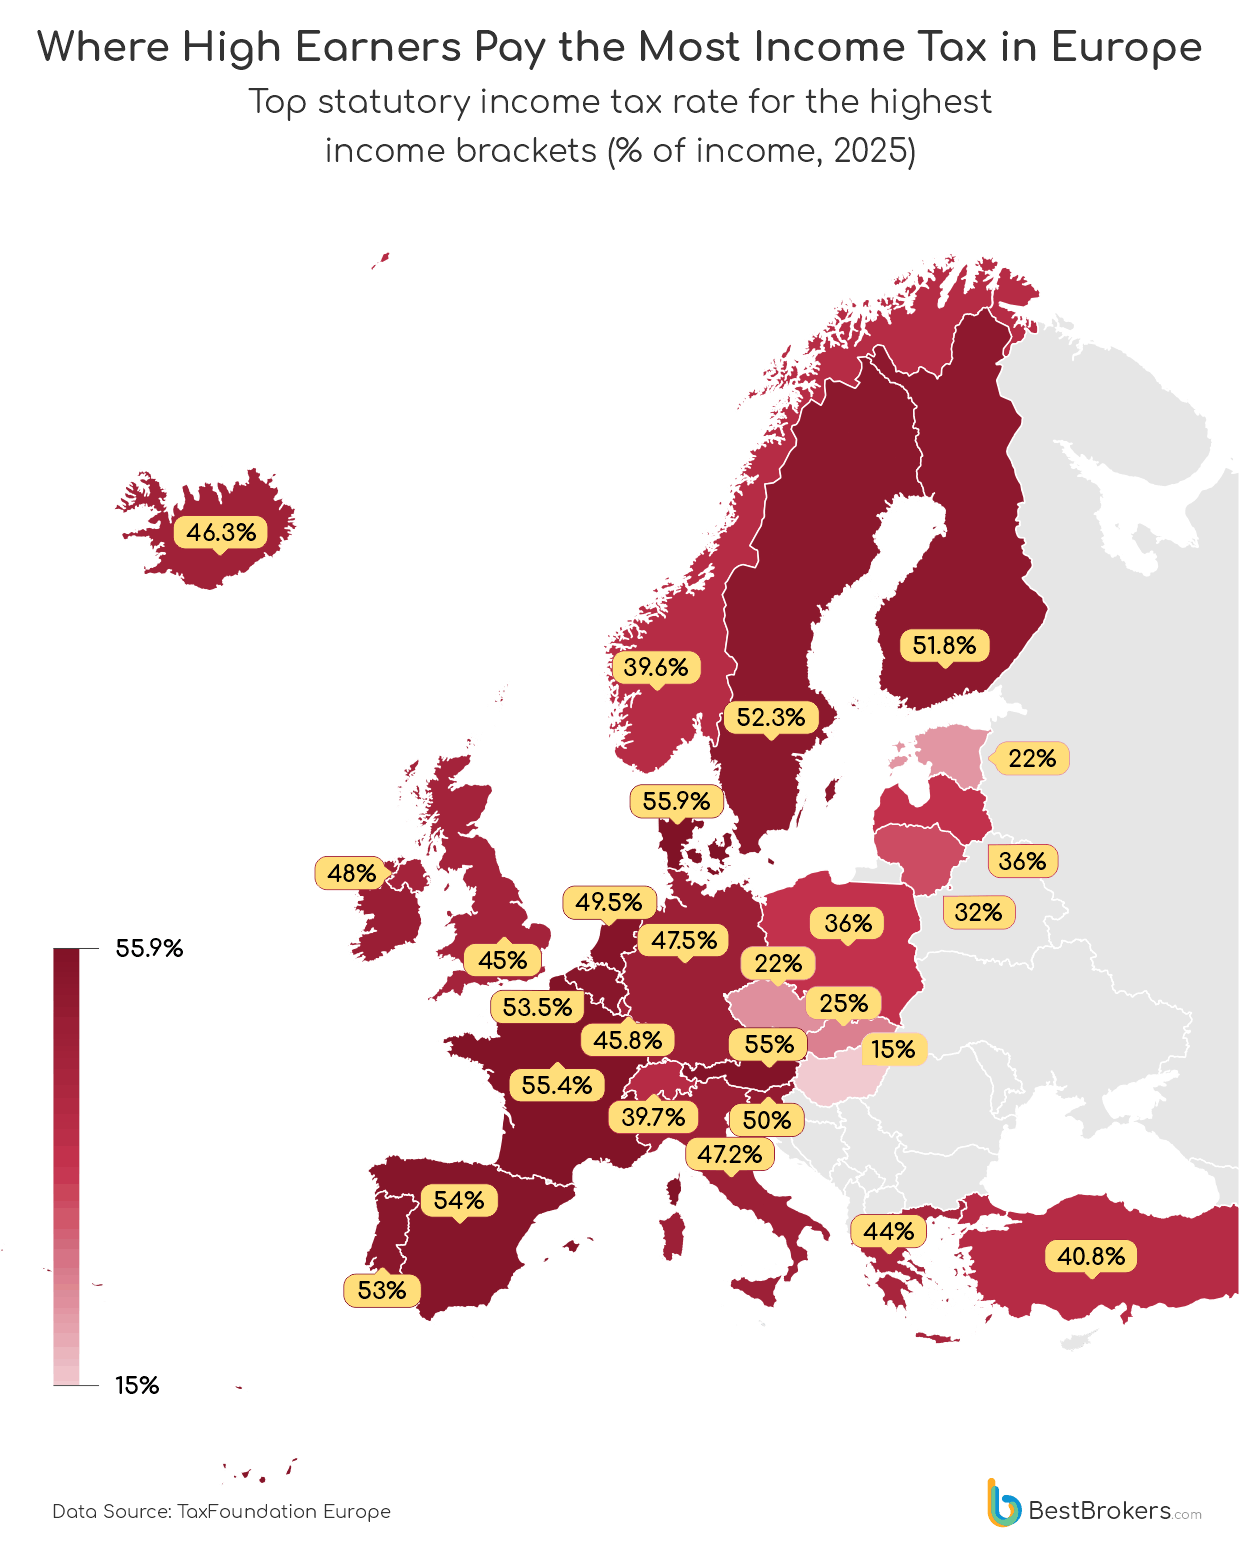
A country’s top statutory personal income tax rate represents the marginal rate applied to income above the highest tax threshold. These rates indicate how aggressively governments tax very high earnings, but they do not apply to all income equally. Only the portion of income above a set level is taxed at that rate, meaning high earners pay a lower effective rate across their total income.
For example, France’s top statutory income tax rate exceeds 55%, but this rate applies only to income above the highest tax threshold. A taxpayer earning €150,000 does not pay 55% on their full salary; only the portion earned above the top bracket is taxed at that level. The remainder is taxed at progressively lower rates, meaning the individual’s effective tax rate across total income is far below the headline figure. Despite this, top rates are commonly used as shorthand for how ‘high-tax’ a country is, even though they affect only a small share of top earners rather than people on average wages.
Across Europe, these taxes vary sharply. Several countries impose income tax rates above the 50% threshold, including Denmark (55.9%), France (55.4%), Austria (55%), Spain (54%), Belgium (53.5%), Portugal (53%), Sweden (52.3%), Finland (51.8%), and Slovenia (50%). These are progressive tax systems, using high marginal rates to concentrate tax pressure on the highest earners. In contrast, parts of Central and Eastern Europe maintain much lower headline rates, with Hungary’s flat 15% income tax standing out alongside Estonia (22%), the Czech Republic (23%), and Slovakia (25%).
This split shows two very different approaches to taxation across Europe. Some countries focus on taxing the wealthiest earners more heavily, while countries with lower top rates often aim to simplify their tax systems or make themselves more competitive. However, these top-rate figures do not tell the full story; they say little about how much tax most people actually pay. That becomes clear when we look at taxes on average wages, which often reveal a very different picture.
The True Tax Burden: What European Workers on the Average Wage Actually Pay
In Europe, personal income taxes are the primary method by which governments fund public services, including healthcare, pensions, unemployment benefits, public transportation, and education. These taxes are collected directly from wages and are often split between the employee and the employer. Workers pay income tax and a portion of the social security contributions, while employers also contribute to social security on behalf of their staff. Together, these taxes represent the most immediate connection between fiscal policy and everyday life, which is why debates about tax fairness have intensified in recent years.
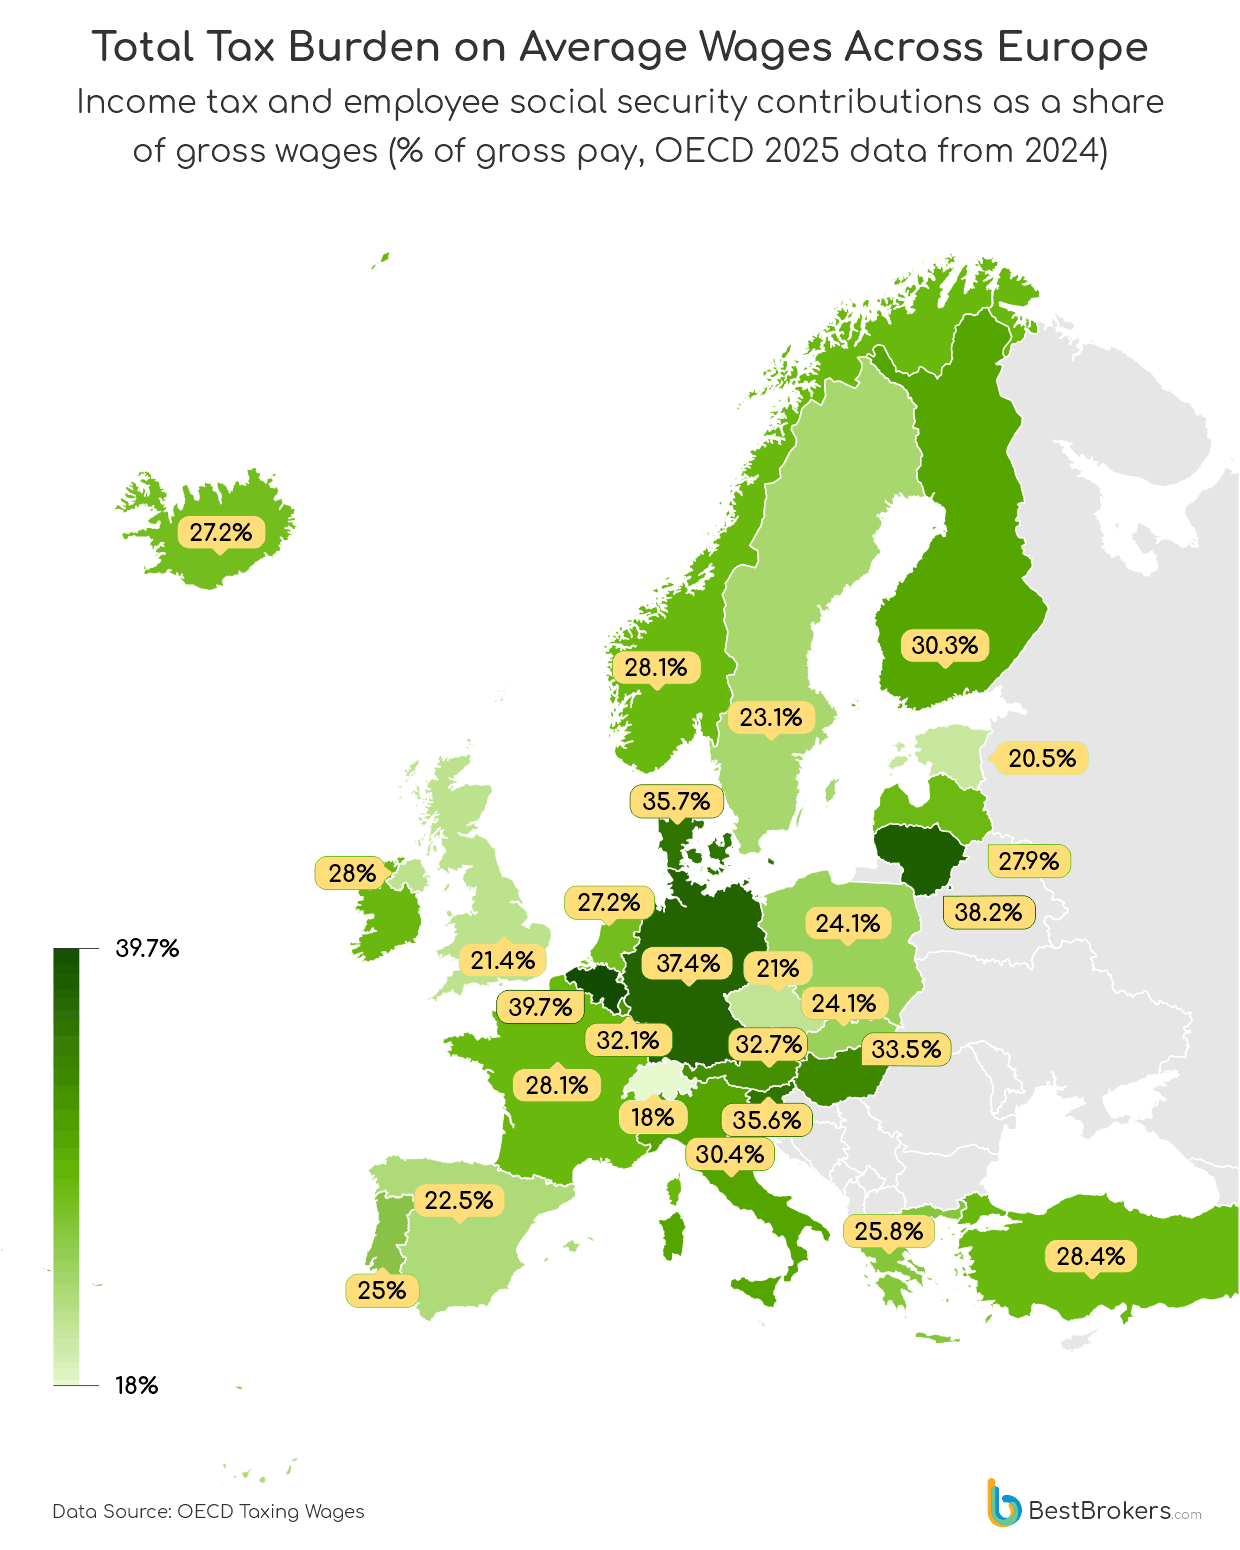
Measured as a share of gross wages, the tax burden on workers varies widely across Europe. Belgium stands out as the most heavily taxed country in this group, with 39.7% of the average wage going towards personal tax: 25.7% from income tax alone, and 14% in social security payments. Germany (37.4%), Lithuania (38.2%), Denmark (35.7%), and Slovenia (35.6%) also impose substantial tax burdens on workers earning the average wage.
At the other end of the spectrum, Switzerland’s workers keep most of their earnings, paying just 18% of gross wages, split between 11.6% income tax and 6.4% social security contributions. Other low-burden countries include Estonia (20.5%), the Czech Republic (21%), the UK (21.4%), and Spain (22.5%).
These differences are driven by how countries fund their social systems. Nations with high personal income taxes, like Belgium, Germany, Slovenia, and Lithuania, rely heavily on employee contributions, keeping the worker tax burden high regardless of income. In Germany, social security alone makes up over 20% of the average worker’s deductions; in Slovenia, employee contributions exceed 23%.
Other countries achieve progressivity differently. Spain and Ireland, for instance, have high top income tax rates, but a smaller share of workers’ wages goes towards taxes, 22.5% in Spain and 28% in Ireland, thanks to generous allowances and relatively modest social security contributions (6.5% and 4% respectively). Here, the system shields the typical wage, concentrating the tax burden on higher earners.
Then there’s Hungary, where personal taxes have a counterintuitive twist. With a flat 15% income tax, it appears low-tax at first glance. In reality, employees pay 18.5% in social contributions, pushing the total tax burden on average wages to 33.5%. That’s higher than in many countries with far higher headline rates, showing how payroll charges can outweigh statutory income tax.
In short, income tax rates tell only part of the story. For most Europeans, it’s the combination of income tax and social security contributions that shapes the amount left in their bank accounts after taxes, and the experience differs dramatically from country to country.
How Taxes Changed for High-Income Individuals in Europe Over the Past Five Years
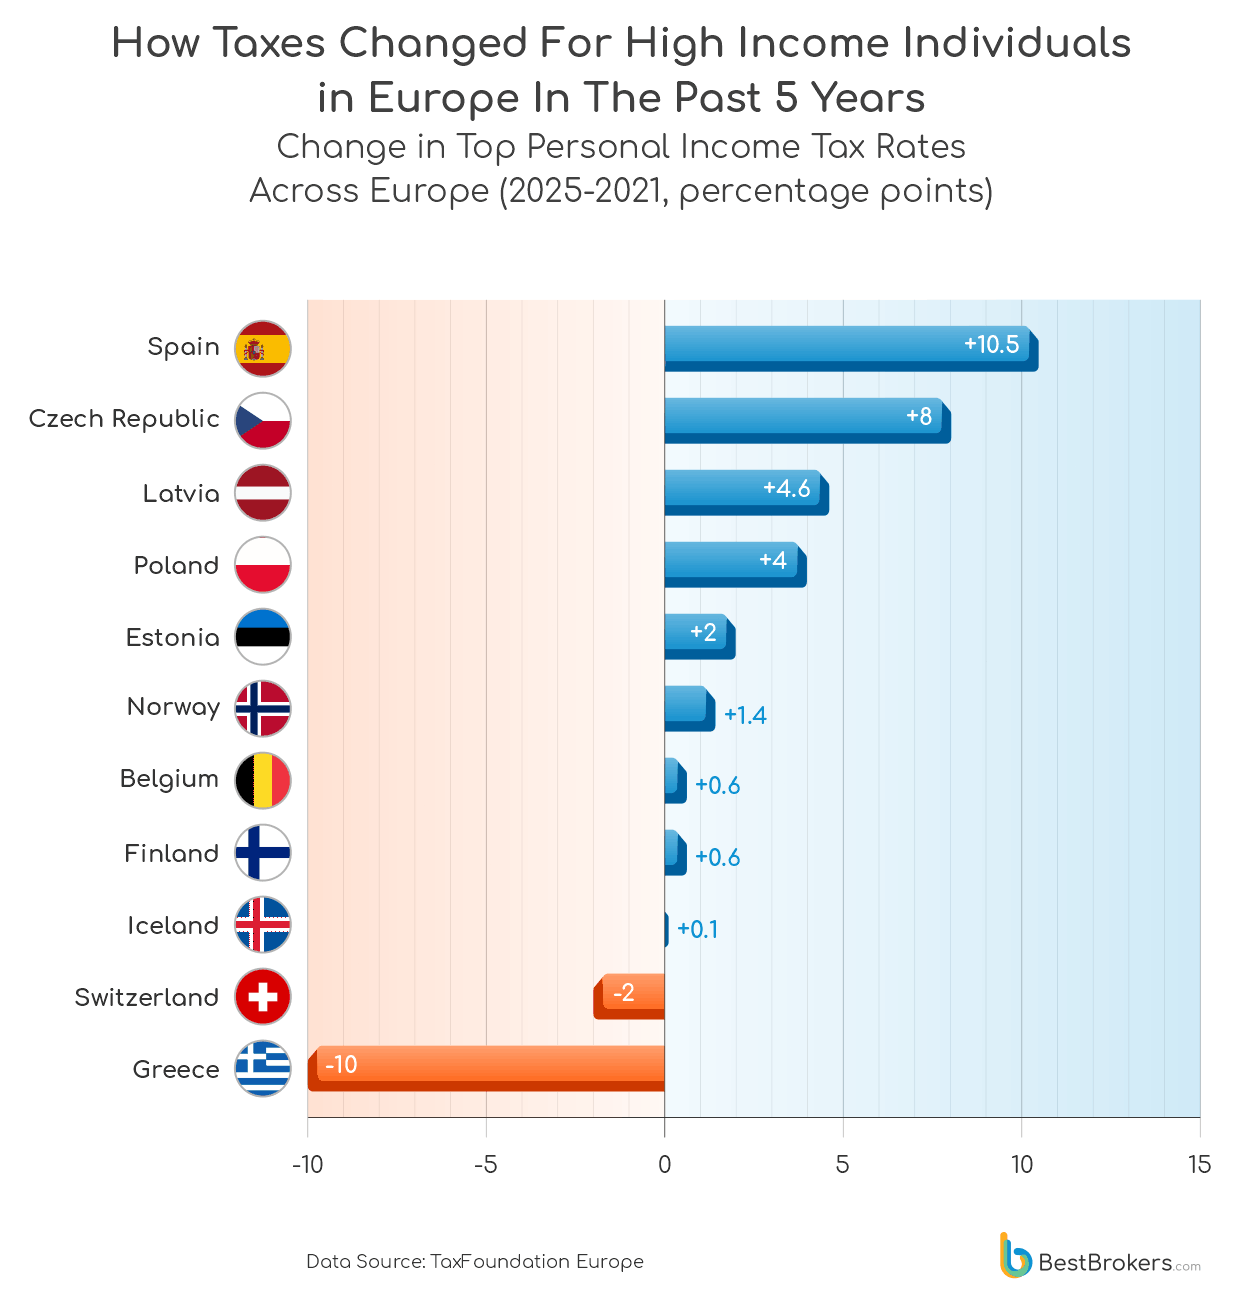
Changes to top statutory personal income tax rates provide a window into how European governments have responded to economic shocks, fiscal pressures, and shifting political priorities. Tax rates for the highest earners are most often adjusted during periods of stress, either to stimulate growth or to signal competitiveness. With the past five years shaped by the global pandemic, rising inflation, and growing public debt, one might have expected widespread increases for high earners.
In reality, Europe has been remarkably cautious. Across most of the continent, top rates barely budged: Germany, France, Austria, Sweden, the Netherlands, Portugal, Slovenia, and the UK show little or no change since 2020. Where changes did occur, they often reflected longer-term reforms rather than short-term responses. Spain recorded the largest increase, hiking its top rate by more than 10 percentage points, while the Czech Republic (+8%) and Latvia (+4.6%) also saw notable rises following earlier tax cuts or structural adjustments.
Meanwhile, a handful of countries moved in the opposite direction. Greece cut top rates by roughly 10 percentage points to encourage investment and employment, while Switzerland also lowered its top rate, reinforcing its reputation for moderate personal taxation. These trends reveal that, for policymakers, the priority has often been stability and competitiveness rather than short-term revenue grabs from high earners.
Are Europe’s Workers Paying More Tax Than Five Years Ago?
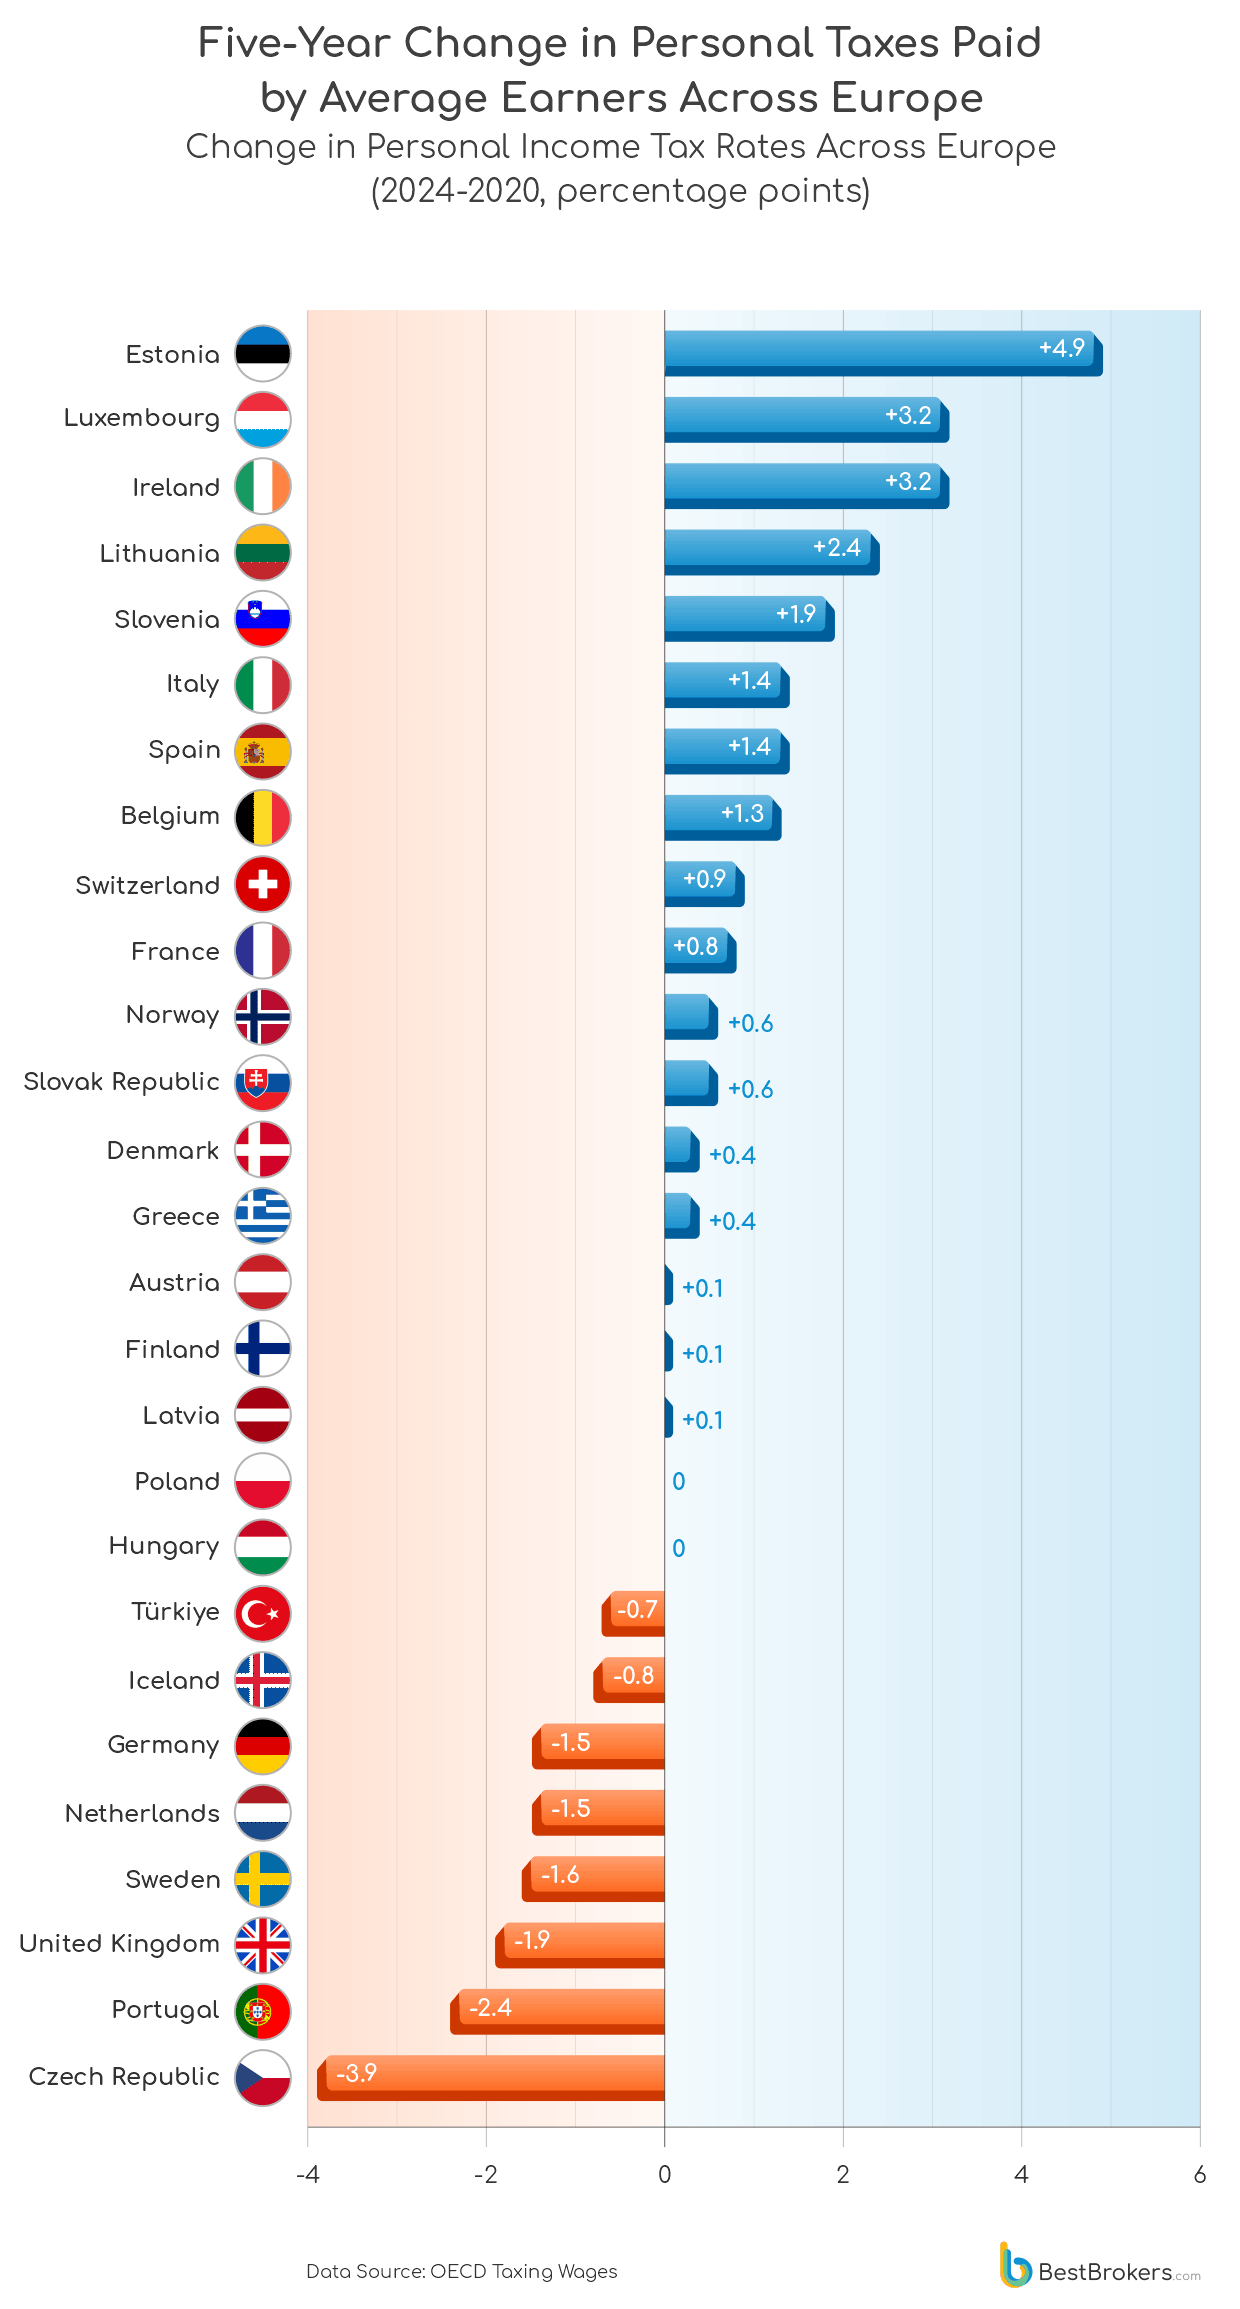
For the worker on an average wage, changes in the total tax burden have been far less uniform. Across Europe, some countries have seen the share of wages going to personal taxes climb steadily. Estonia stands out, with the average worker’s total personal tax deductions rising by 4.9 percentage points over five years, from 15.6% to 20.5%. Luxembourg and Ireland also recorded meaningful increases, both up 3.2 percentage points, while Lithuania (+2.4%), Slovenia (+1.9%), and Spain and Italy (+1.4% each) saw smaller but still notable rises.
At the other end of the spectrum, several nations experienced modest declines. The Czech Republic had the largest cut, with the share taken in taxes dropping 3.9 percentage points. Portugal (-2.4%), the United Kingdom (-1.9%), Sweden (-1.6%), Germany and the Netherlands (-1.5% each), Iceland (-0.8%), and Turkey (-0.7%) also saw slight reductions. These changes generally reflect either small cuts in employee social contributions or faster wage growth relative to deductions.
Taken together, these patterns demonstrate how the design of tax systems shapes everyday experience. Countries relying heavily on payroll contributions, like Germany, Belgium, Slovenia, and Lithuania, maintain a consistently high tax burden regardless of wider economic conditions. By contrast, nations with lower payroll obligations or progressive tax systems, such as Switzerland, Estonia, or Ireland, offer a lighter, more stable impact on average wages.
Methodology
This report draws on two primary sources to analyse personal taxation across Europe. OECD Taxing Wages provides data on income tax and employee social security contributions as a share of gross wages for average workers, while the Tax Foundation supplies statutory top personal income tax rates for high earners. Changes over time were calculated by comparing the latest available data with figures from five years prior, and all values are presented using the most current year for each dataset (2024 for average workers, 2025 for top rates). The analysis focuses on national-level personal taxation and does not include local or regional levies, non-labour taxes, or deductions beyond those captured in the source data.