
The global economy may be reshaping itself through conflict, energy shocks, and a new era of investment, but the biggest economic transformations often happen almost out of sight. Guyana, once one of South America’s poorer economies, has become a symbol of just how quickly a country’s fortunes can change, fuelled by its extraordinary oil boom, while remarkable growth is also seen across Eastern Europe and Central Asia.
Rapidly moving up the global income ladder, however, does not immediately eradicate poverty, which is why the team at BestBrokers was curious to see not just those nations expanding their wealth in nominal terms, but those with the fastest-growing economies measured against their populations. Using data from the International Monetary Fund, we compared GDP per capita in 2016 and in 2025 with the projections for 2026 to identify the countries with the greatest increase in economic output per person in dollar terms.
Key Findings
- Оver the past decade, South America’s tiny nation of Guyana became richer the fastest, with GDP per capita soaring by 452.24% in just ten years, reaching $33,167 in 2026 according to estimates.
- In 2026, however, Guyana remains 4th for annual GDP per capita growth after Bolivia and three African nations, most notably Zambia, which increased its economic output per capita by an impressive 38.95% within just 12 months.
- Only four countries have GDP per capita of over $100,000, namely Ireland ($140,186), Switzerland ($126,177), Singapore ($107,758), and Norway ($105,877), while the U.S. stands 5th with $94,430.
- The world’s largest economies remain the United States and China with estimated GDP for 2026 of $32.38 trillion and $20.85 trillion, respectively, which means that these two nations alone produce over 42% of the entire world’s wealth.
Zambia: Greatest GDP per Capita Growth in 2026 But Are People Getting Richer?
Estimates for 2026 put Zambia at the top of the 2026 ranking, with GDP per capita rising 38.95% in a single year. That number is impressive, but does not simply mean that households suddenly became 39% richer: Zambia’s economy is heavily exposed to copper, while the majority of the population still lives in objective poverty – on below $1 a day. At the same time, the kwacha, the national currency, has also strengthened and inflation has been falling. The IMF says Zambia has made substantial progress in stabilising its economy, with inflation returning to its target band in April, although it still faces weaker mining output, energy constraints and significant fiscal pressures.
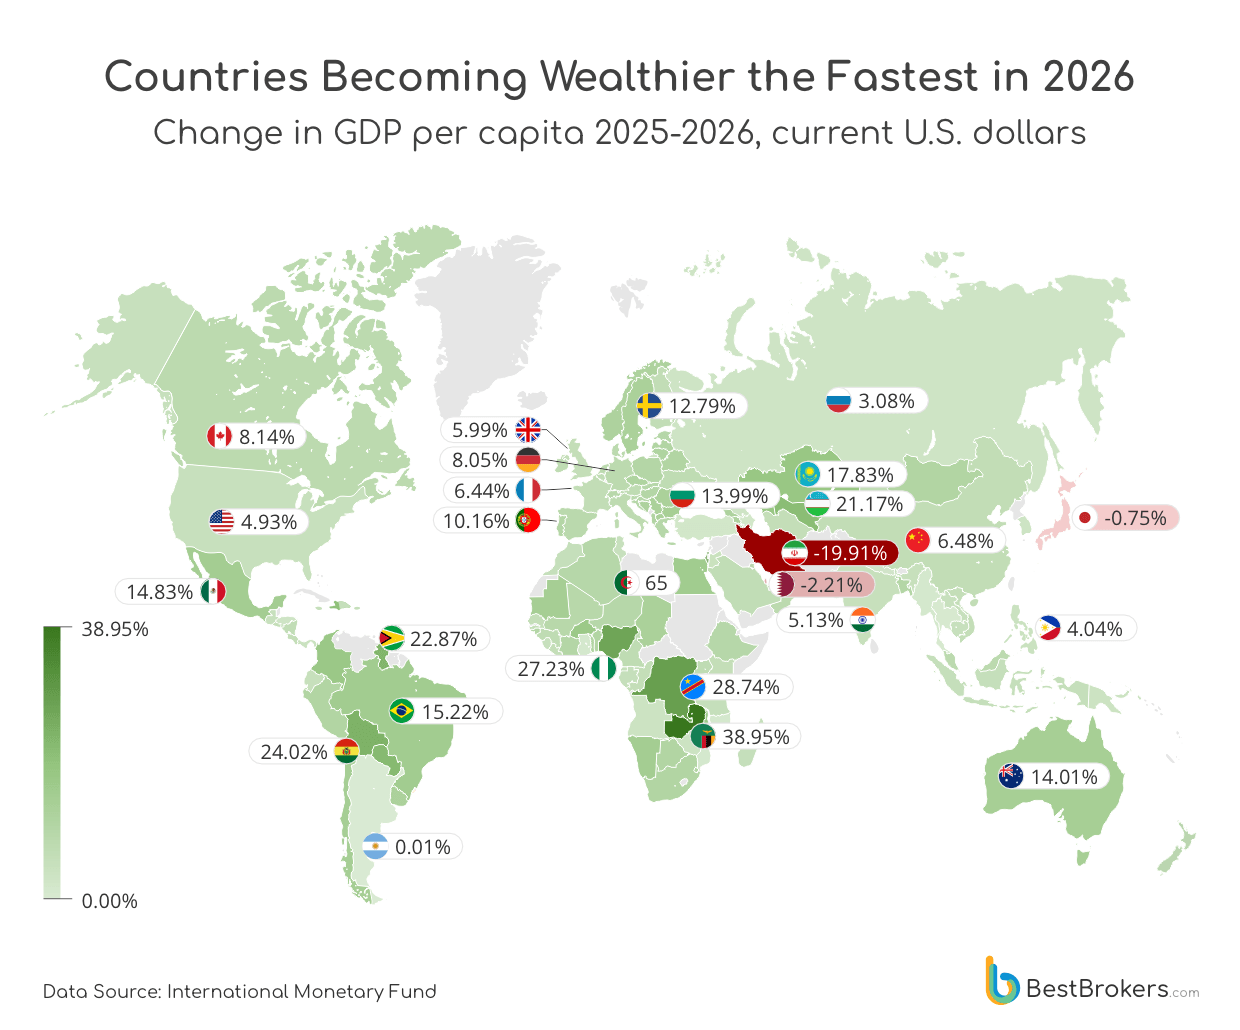
So, on paper, Zambia is having an amazing year, so are the Democratic Republic of the Congo and Nigeria, which follow with gains of 28.74% and 27.23%, respectively. But a country becoming ‘richer’ is rarely as simple as the number suggests – at least when we are looking at short-term increases. DRC’s economy continues to be supported by strong mining activity, while Nigeria remains heavily influenced by oil, despite its growing non-oil economy.
This means that commodity prices, currencies, and inflation can push GDP per capita sharply higher without producing an equivalent improvement in what people can afford or how they live. In Nigeria, for instance, the IMF projects 2026 real GDP growth of just 4.1%, while inflation is still expected to average 16%. In all of the above-mentioned, poverty and food insecurity remain serious concerns, alongside the usual poorly maintained key sectors – healthcare, education, employment, infrastructure, you name it.
The same tension runs through the ranking – Guyana, now one of the world’s most interesting economic transformations, is up 22.87% since 2025. Bolivia and Paraguay have also posted gains above 20%. Still, they have a long way to go, whereas some of the nations that saw their economic output shrink in 2026 are also among the world’s richest. Qatar’s GDP per capita fell 2.21% and Japan’s 0.75%; still, both have powerful economies, high living standards, and enduring wealth accumulated over entire decades rather than months.
Interestingly, not everyone produces a large percentage gain from a very low starting point – Israel, Australia, Sweden, and Norway see their GDP per capita climb between 12% and 15% within just a year – truly impressive, considering they are also among the richest economies with per capita outputs of around $70,000 or above. Bulgaria, on the other hand, is the European country with the largest gain – its GDP per capita grew 13.99% to $23,848 from 2025 to 2026.
The Most Impressive Growth In GDP per Capita Over the Past Decade
Over the past decade, some of the world’s poorest countries have posted the most spectacular increases in GDP per capita. Guyana sits almost absurdly at the top, with a 452.24% increase, while Moldova, Ukraine, Bulgaria, and Albania have all more than tripled their figures.
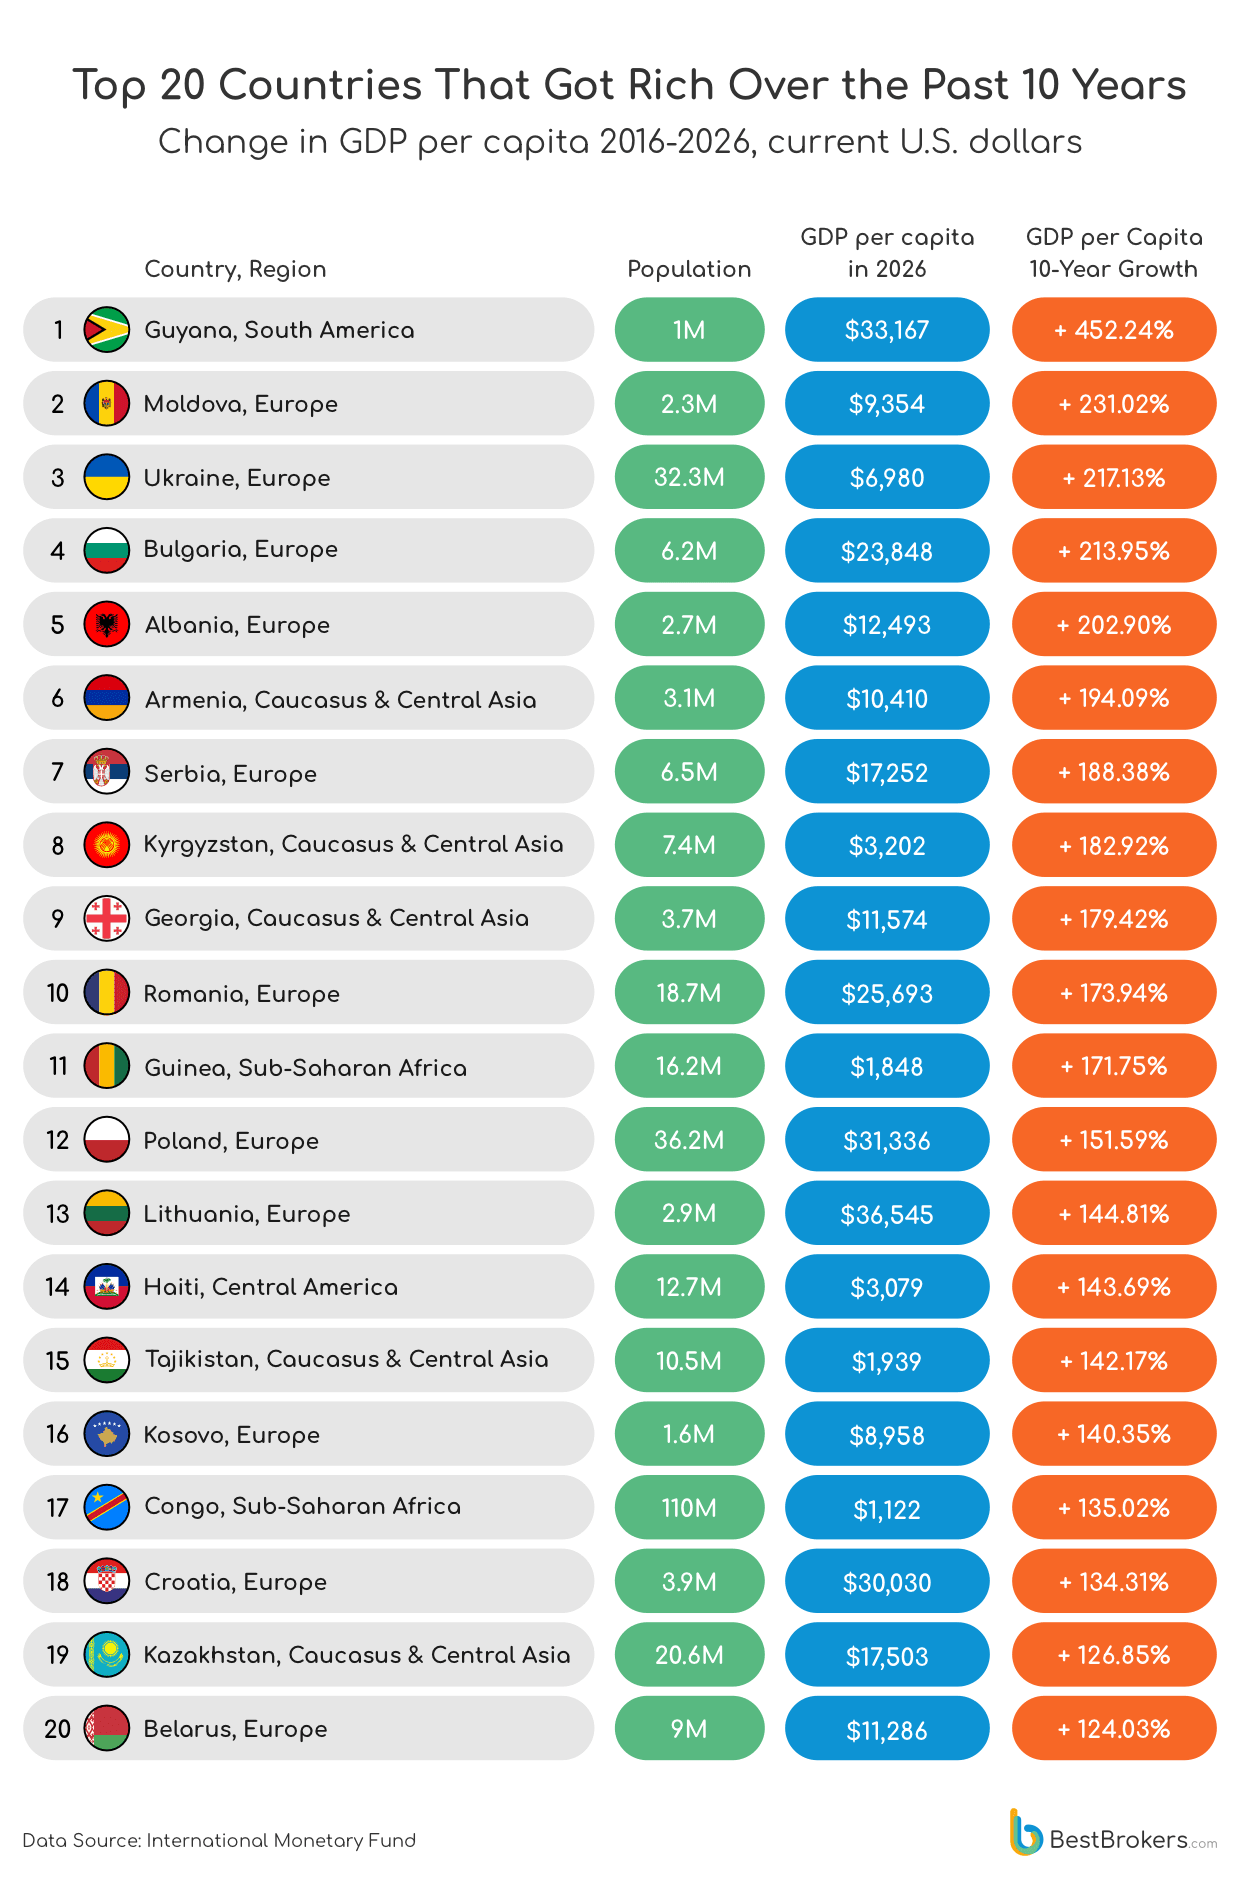
At first glance, this looks like countries rapidly closing the gap with the rich world – and some are. But for others, the percentages can be deceptive: Burundi’s twice-as-high figure or roughly 107% gain still leaves it at a GDP per capita of just $546. In other words, a country can become dramatically ‘richer’ without its citizens necessarily becoming rich by global standards.
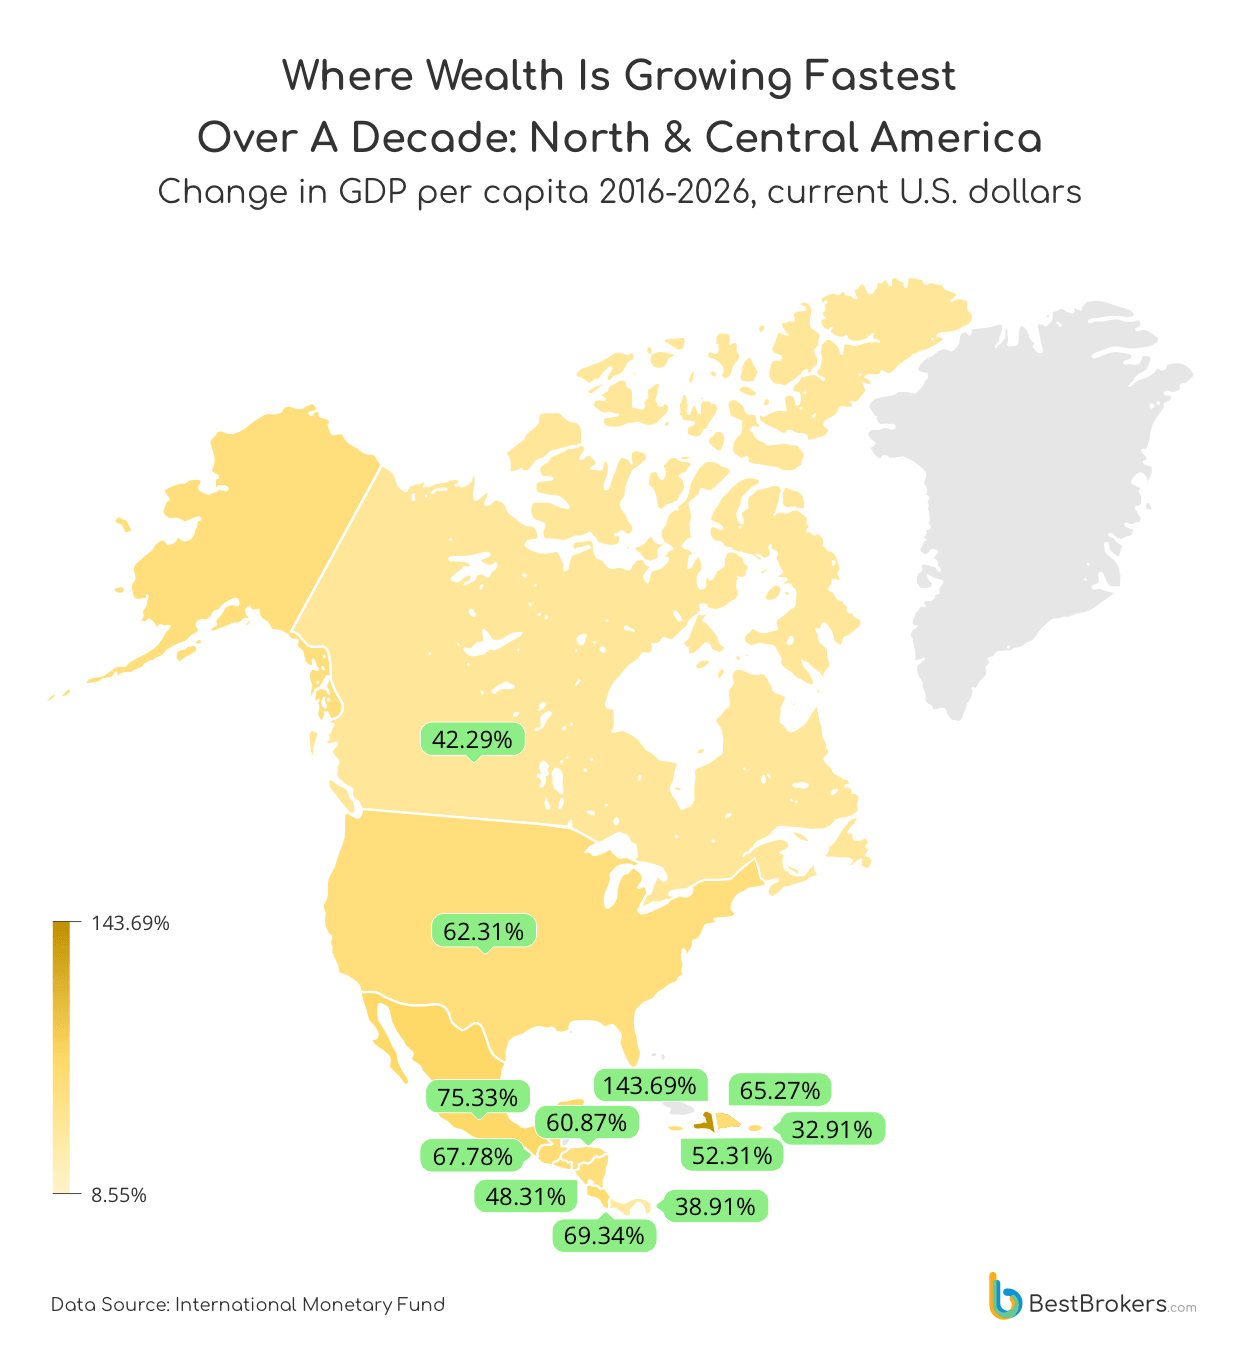
The most conspicuous case is Guyana, whose extraordinary rise – its GDP per capita is now $33,167, or five times higher than in 2016 – is closely tied to its recent emergence as a major oil producer. In 2015, a major offshore reserve was discovered, and in 2019, drilling officially began, with output reaching 900,000 barrels per day by mid-2026. Oil revenues brought in massive funding for roads, housing developments, and hospitals, while at the same time, the rapid boom triggered elevated living costs and labour shortages.
No other country in South America, or even across all of Latin America really, came even close to doubling its GDP per capita over the past decade. Mexico saw it rise by 75.33% to $15,779; Bolivia’s figure climbed 70.18% to 6,333. The only country with a more substantial gain is Haiti, a rise of 143.69% to $3,079, a Caribbean nation that can hardly be considered Latin American. Currently, Guyana, the only South American member of the Commonwealth and the only English-speaking country on the continent, has the largest GDP per capita in South America and the fourth-largest in the Americas as a whole.
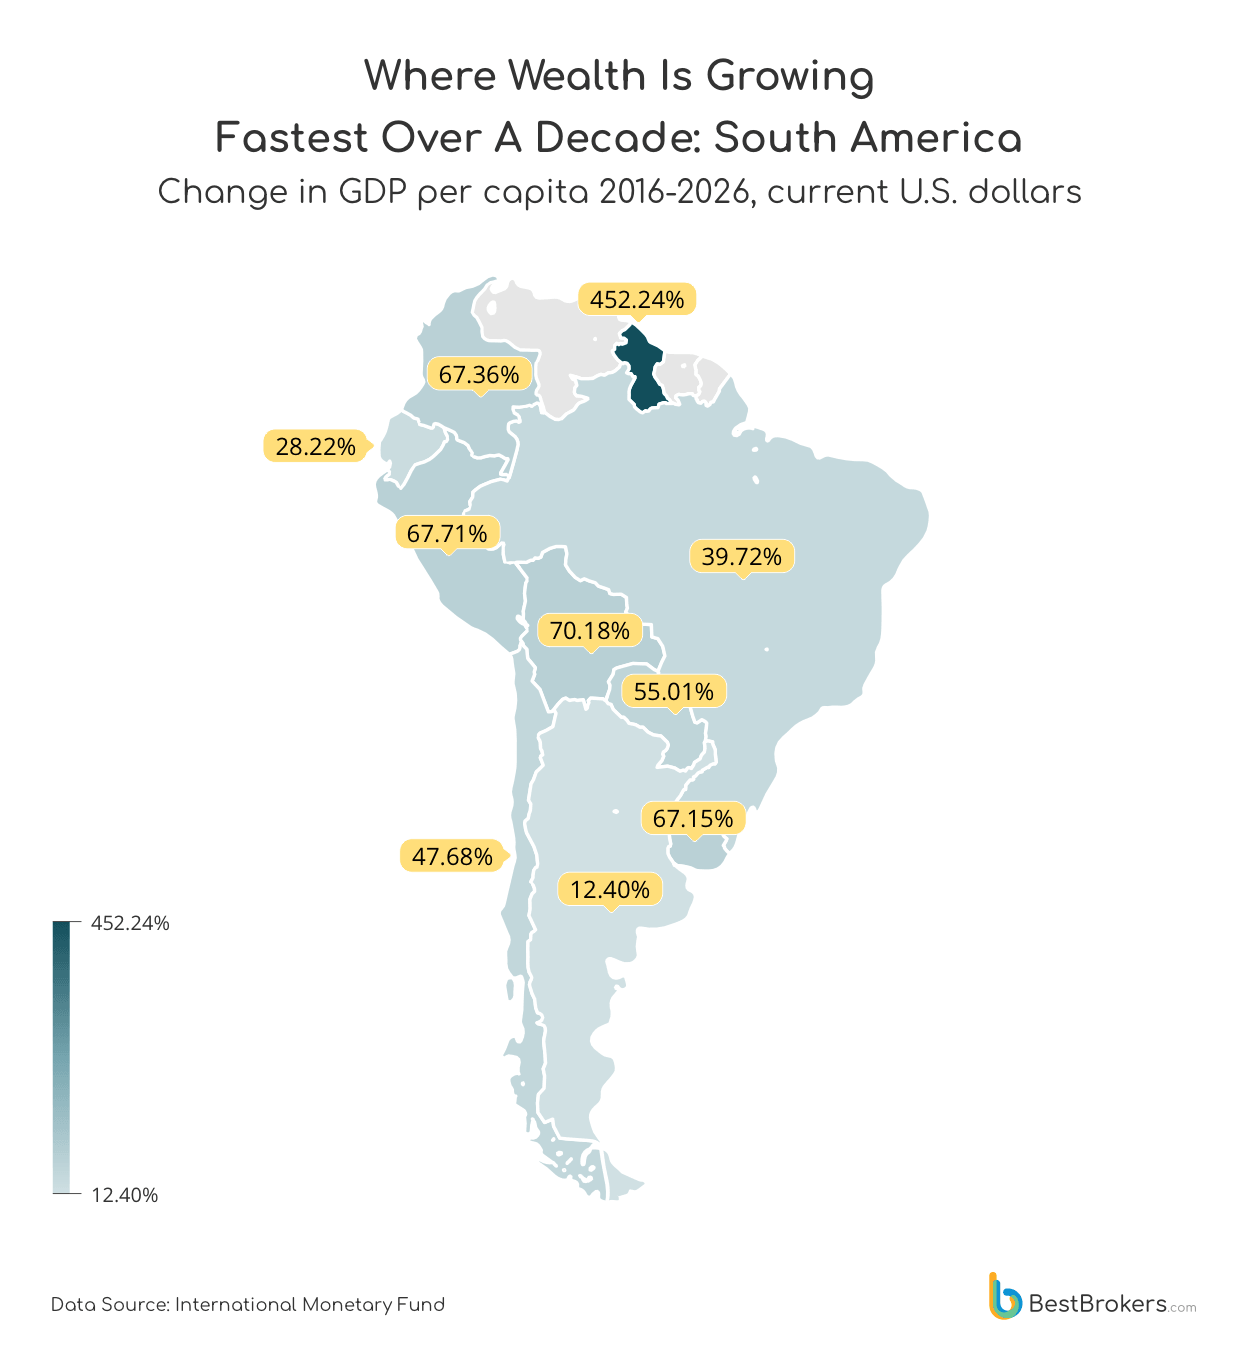
Across North and Central America, the numbers show a much more stable snapshot of national wealth – except for Haiti and its 143.69% rise in GDP per capita between 2016 and 2026. The United States may be the world’s largest economy by nominal GDP, but in terms of growth in its GDP per capita, it performs much more modestly with a rise of just 62.31% over the past 10 years.
Mexico’s per-capita economic output grew by 75.33%, while Canada’s climbed by only 42.29%. Several of the region’s poorer economies saw gains of over 50% – Nicaragua (69.50%), Costa Rica (69.34%), Guatemala (67.78%), Dominican Republic (65.27%), Honduras (60.87%), El Salvador (58.81%), and Jamaica (52.31%).
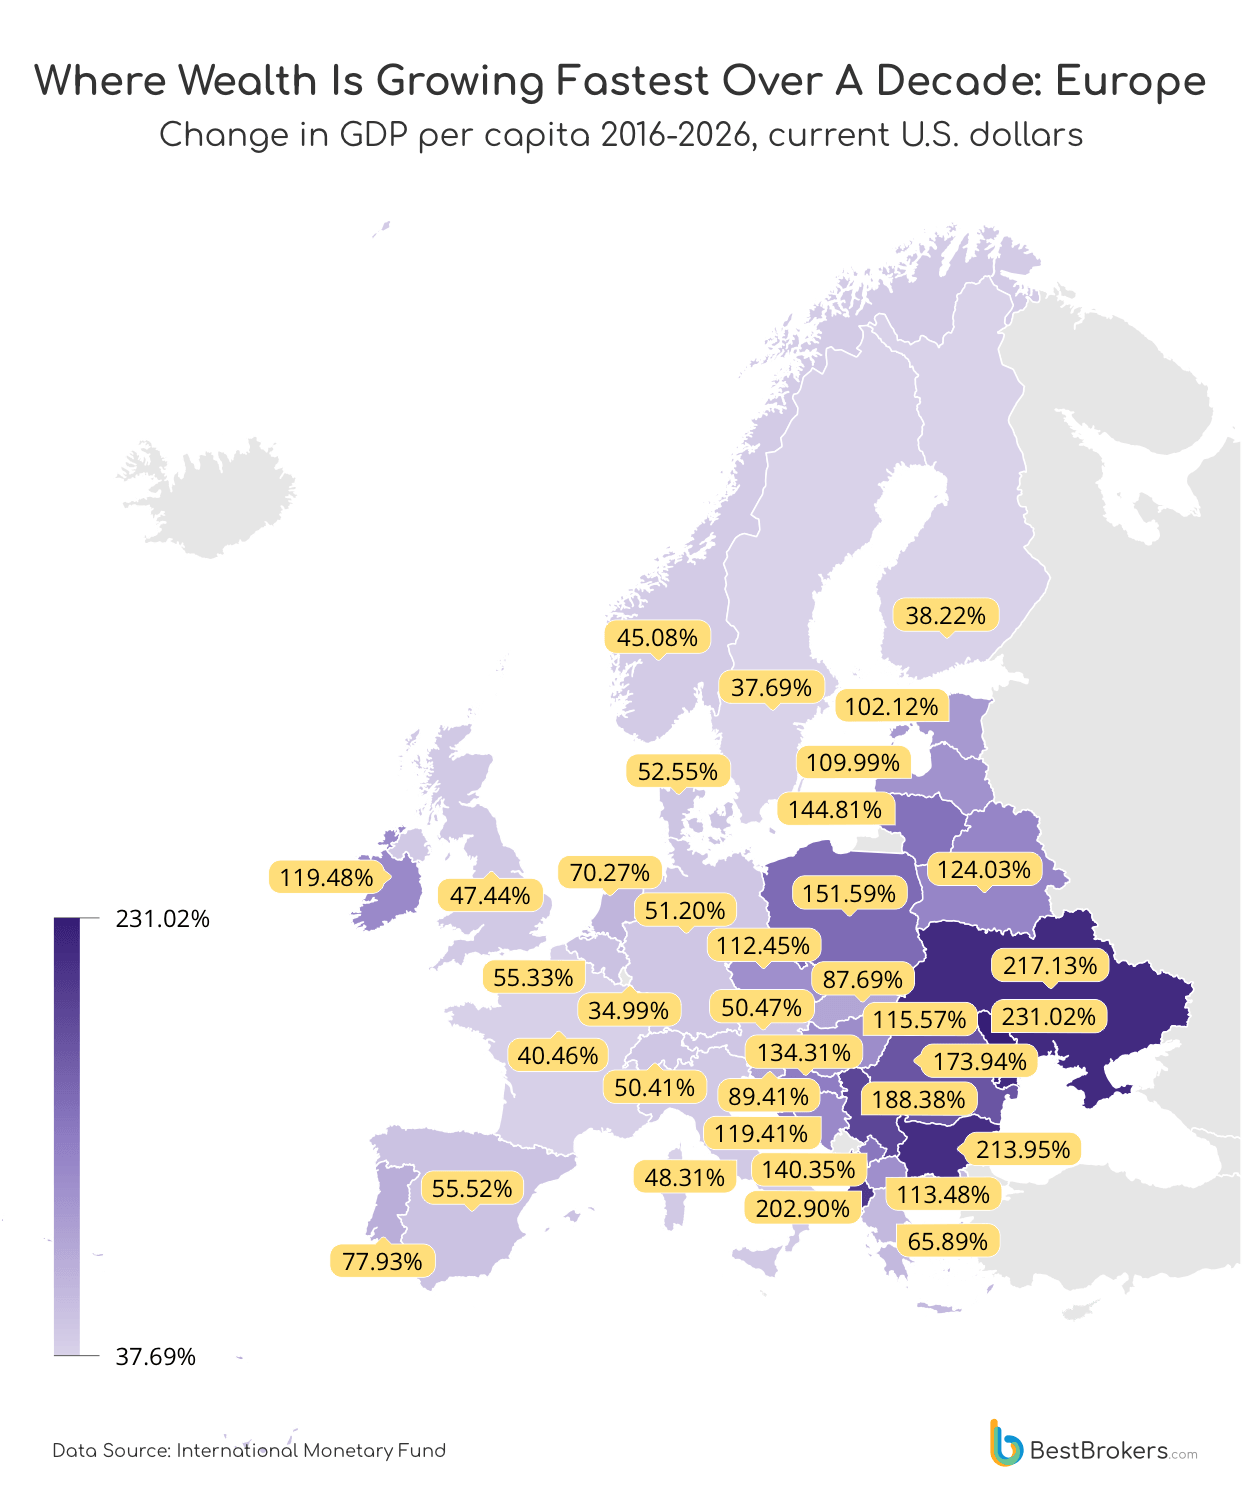
Eastern Europe, typically much poorer than the Western part of the continent, is also increasing its wealth – Bulgaria, Romania, Poland, Lithuania, and Croatia have all recorded substantial gains between 2016 and 2026 while reaching GDP-per-capita levels above $20,000. Yet even here, the improvement should not be mistaken for the end of economic catch-up; the gap with Western Europe and North America remains considerable. Bulgaria’s economic output per capita reached $23,848 in 2026, up 213.95% from 2016; Romania’s rose 173.94% to $25,693; while in Poland, the GDP per capita climbed 151.59% to $31,336.
Elsewhere across the continent, the largest economies also got richer, but the gains are much less impressive. Germany, the world’s third largest economy after the U.S. and China, saw its GDP per capita grow by only 51.20% over the past decade, while the UK’s figure climbed by 47.44%. France’s economic output per capita increased by 40.46%; Italy’s by 48.31%, while Spain’s rose by 55.52%.
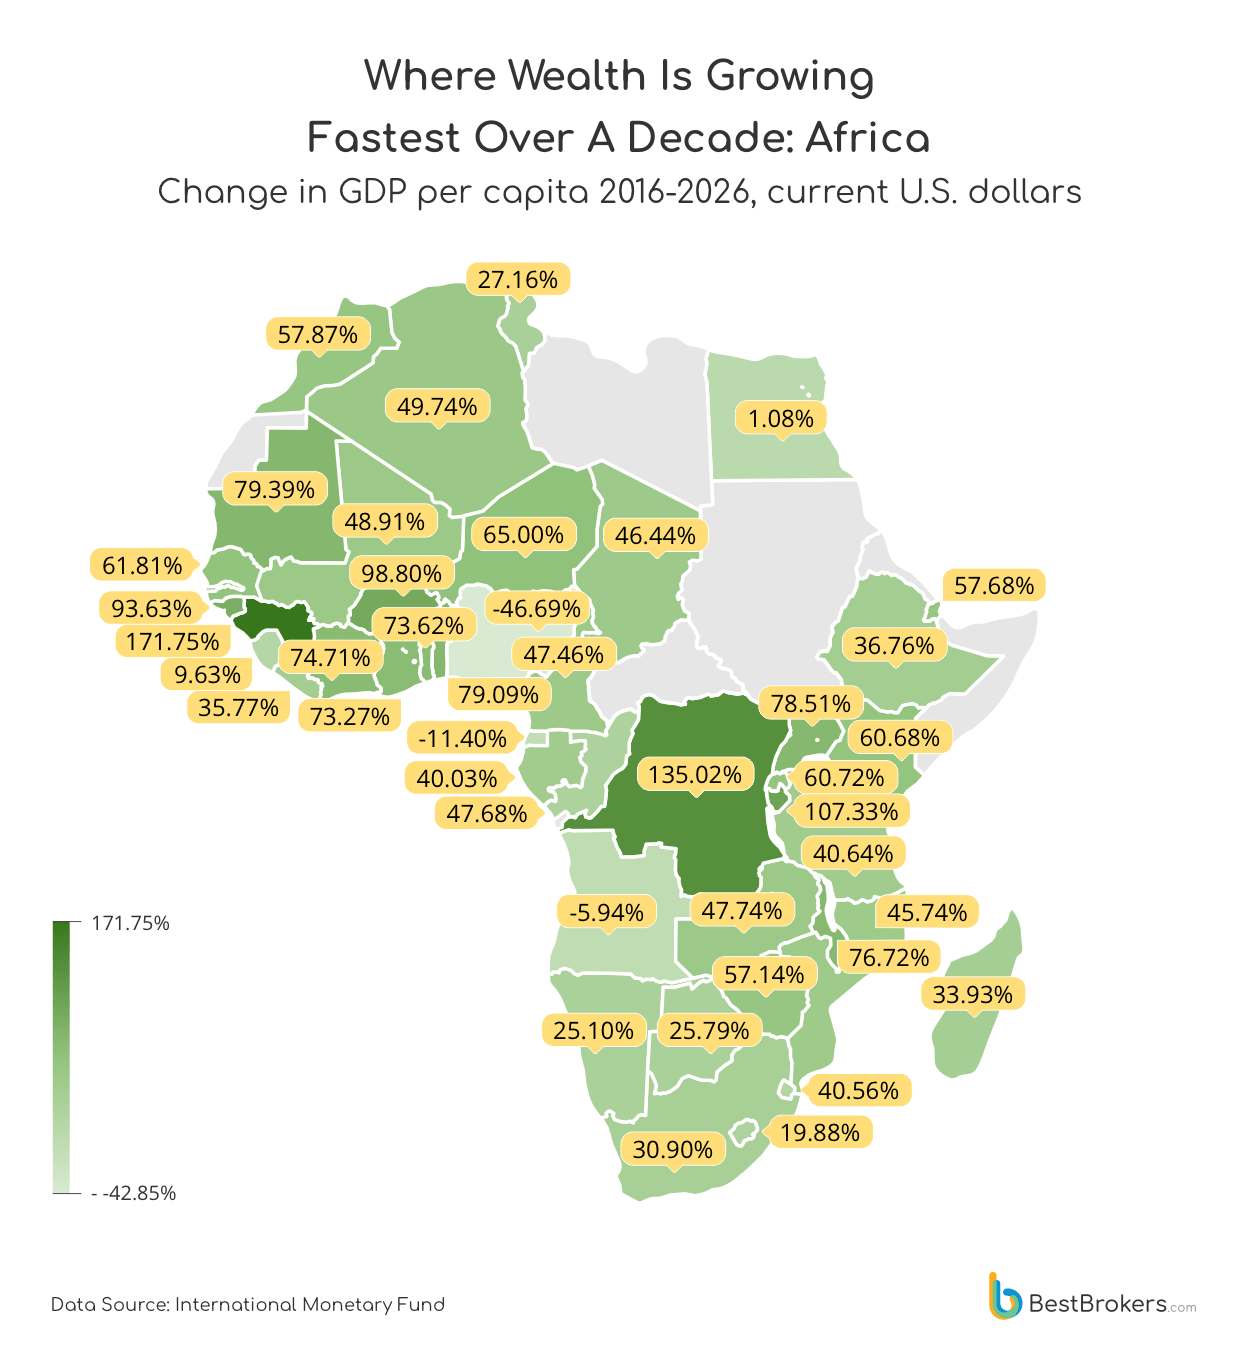
When looking at the GDP per capita growth across Africa and the Middle East, we can see how incomplete or sometimes misleading percentage gains can be when starting from a very low base. Guinea leads the region with a 171.75% increase in GDP per capita, followed by the Democratic Republic of the Congo at 135.02%, and Burundi at 107.33%, yet their GDP per capita remains below $2,000. The gains are significant, but they have not necessarily translated into high living standards.
Israel saw the largest increase in GDP per capita in the Levant between 2016 and 2026 – the figure grew by 85.73% to $69,804 in 2026, pushing its national per-capita wealth higher than those of rich nations such as Qatar ($68,138), the United Arab Emirates ($54,214), and Saudi Arabia ($37,811). Interestingly, but probably not very surprisingly, Iran’s GDP per capita dropped by 42.85% over the same period, with a 19.91% decline registered for 2026 alone.
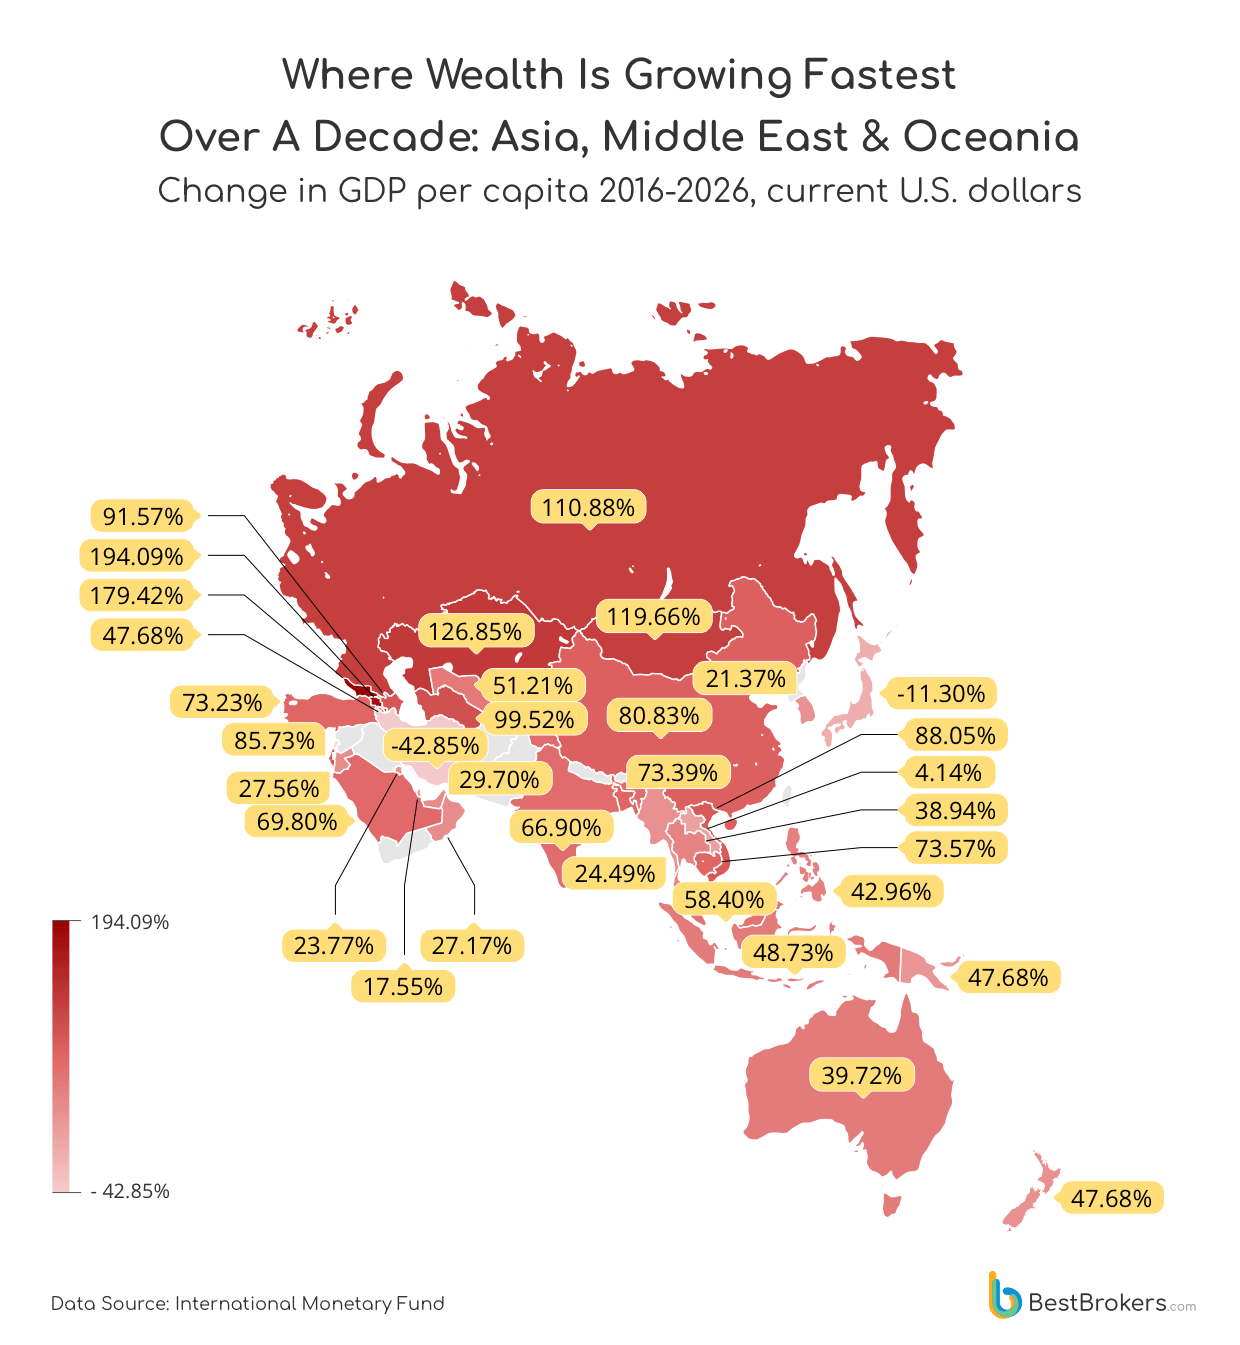
Asia also presents a mixed picture, ranging from spectacular catch-up to outright decline. Over the past decade, the Kyrgyz Republic, Armenia, and Georgia recorded increases of more than 175%, while China rose by 80.83% and India by 66.90%. At the bottom of the ranking, Japan’s GDP per capita fell by 11.30% within the same period, highlighting how uneven the region’s economic progress has been.
Australia and Oceania show a more moderate pattern of growth compared with many emerging economies. Australia increased its GDP per capita by 45.52% to $75,648, while New Zealand recorded a 31.93% rise to $52,023. The region’s relatively high starting point means that slower percentage growth can still represent substantial gains in absolute terms.
The U.S. and China Produce Over 42% of the World’s GDP
The global economy remains heavily concentrated in 2026, with the United States projected to retain a commanding lead at $32.38 trillion in nominal GDP. China follows at $20.85 trillion, while Germany, Japan, the UK, and India form a distant second group. Yet the regional figures reveal just how much economic weight sits outside the biggest individual economies: what the IMF considers advanced economies collectively accounts for $73.81 trillion, compared with $52.48 trillion for emerging and developing economies.
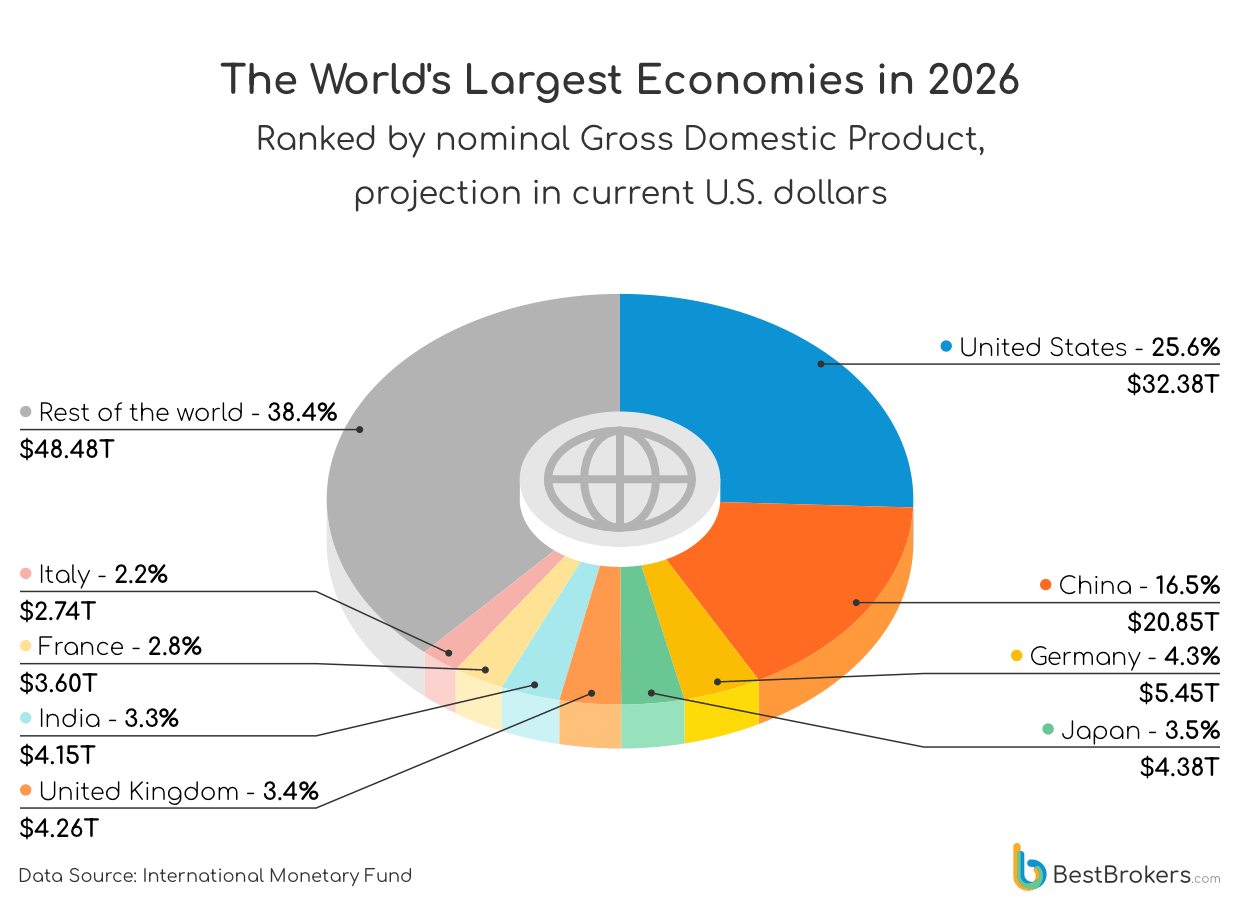
The U.S. economy alone is larger than the entire European Union, projected at $23.03 trillion, and roughly matches the combined output of all European countries ($32.33 trillion). Combined, the U.S. and China produce approximately 42.15% of the entire world’s wealth, while if we take the top 5 largest economies (namely the U.S., China, Germany, Japan, and the UK), they are responsible for 53.31% of the world’s GDP in 2026.
Asia remains another major centre of economic power, with the Asia-Pacific region reaching $43.32 trillion and emerging and developing Asia accounting for another $29.61 trillion. Meanwhile, the G7’s combined $55.32 trillion GDP underlines how much global economic output is still concentrated among a small group of mature economies – even as faster-growing emerging markets continue to close the gap.
Ireland Emerges as the World’s Richest Nation by GDP per Capita in 2026
Ireland is projected to be the world’s richest nation by GDP per capita in 2026, at an extraordinary $140,186 per person, followed by Switzerland at $126,177 and Singapore at $107,758. Norway and the United States complete the top five, with GDP per capita of $105,877 and $94,430 respectively. The figures show just how far ahead these economies are on a per-person basis: Ireland’s projected GDP per capita is more than twice that of France and the UK, while even the 20th-ranked France stands at a substantial $52,083.
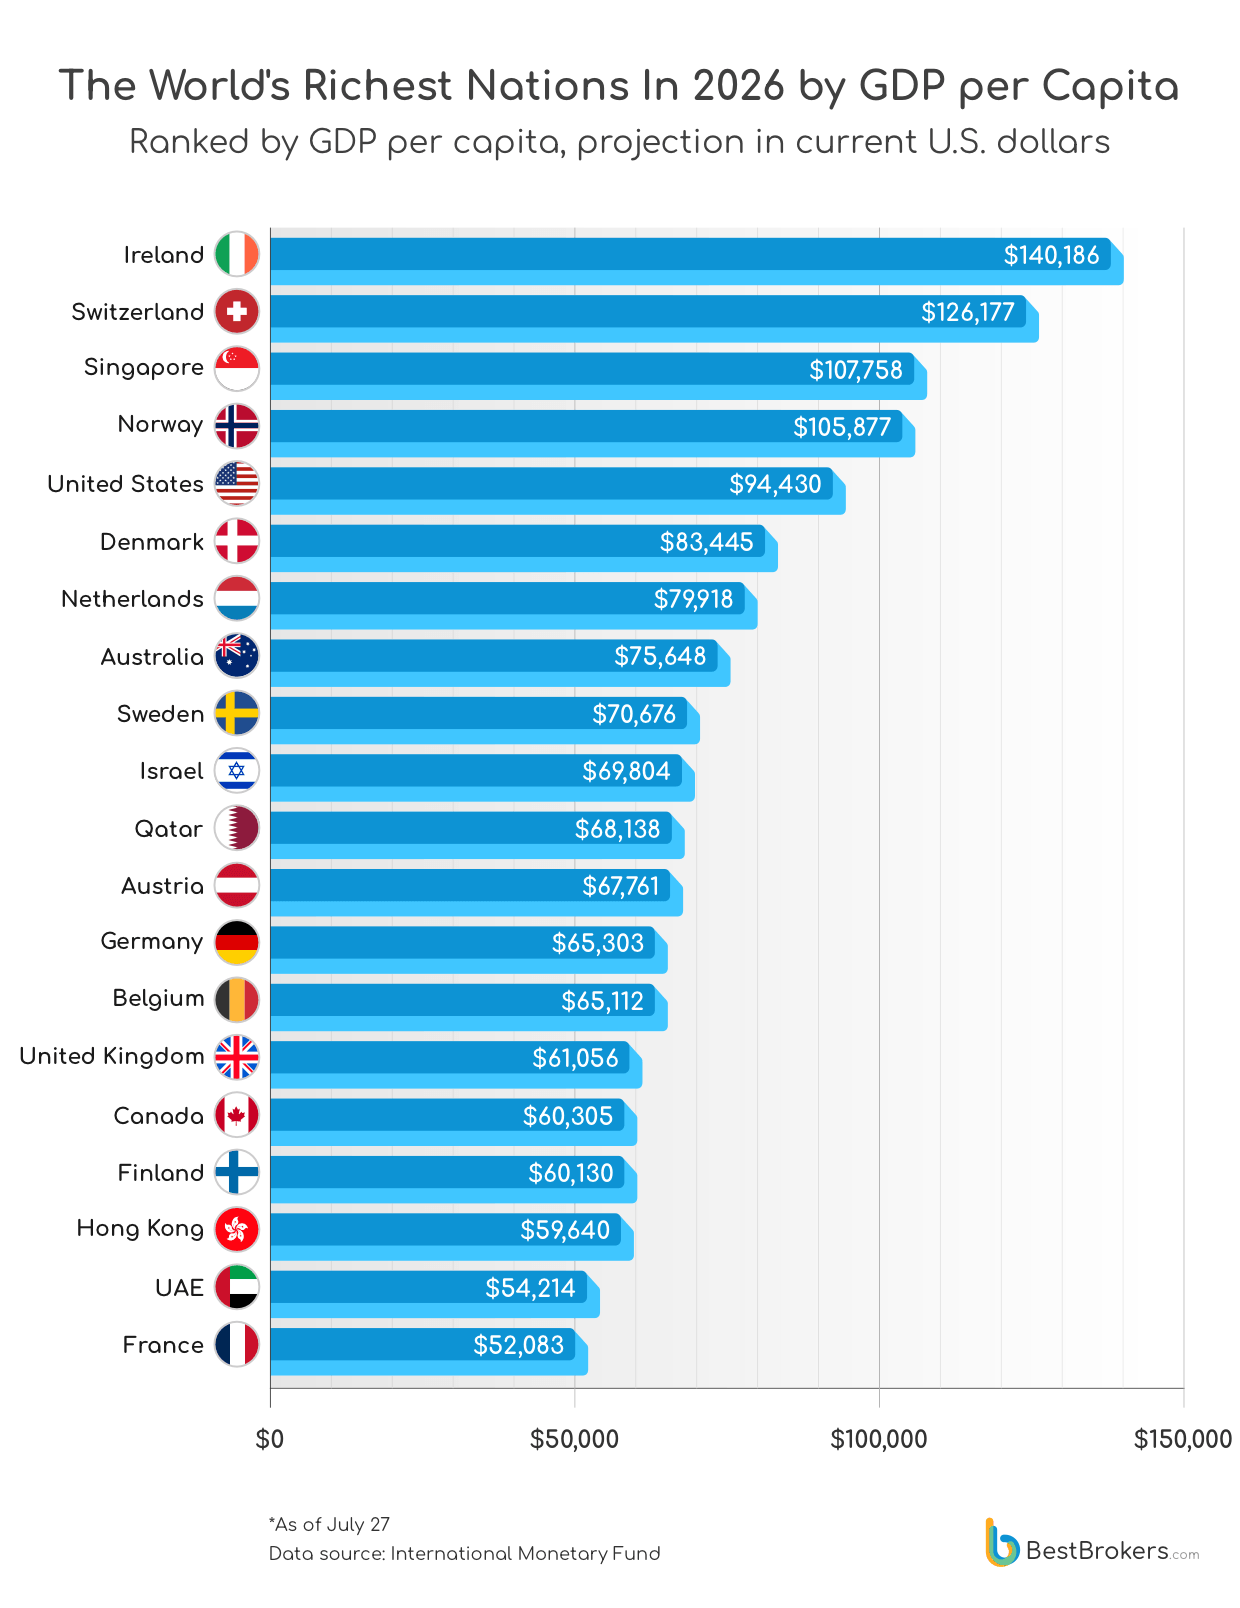
The ranking also emphasises that size is clearly not the determining factor. Singapore, Switzerland, Norway, and Ireland are relatively small economies, yet they generate enormous amounts of economic output per resident. Meanwhile, the United States remains the only country in the top five that also dominates the global ranking by total GDP, showing that it combines exceptional economic scale with high output per person.
There is, however, an important distinction between GDP per capita and personal wealth. GDP measures the value produced within an economy, not how evenly that output is distributed or how much money households actually take home. In Ireland’s case, for instance, we need to take into account the outsized role of multinational companies in its economy.
Methodology
To identify the wealthiest nations, the team at BestBrokers ranks countries and economies according to their projected nominal GDP and GDP per capita for 2026, using the International Monetary Fund’s (IMF) latest available projections. GDP figures are measured in current U.S. dollars, meaning they are not adjusted for inflation or purchasing power differences between countries.
For the ranking of the world’s largest economies, countries are ordered by their projected total nominal GDP in 2026. This measures the overall value of goods and services expected to be produced within each economy during the year and provides a basis for comparing the absolute size of national economies. Regional and economic-group figures, including the G7, European Union, Asia-Pacific and advanced economies, are also presented where available in the IMF data to provide additional context around the concentration of global economic output.
The GDP-per-capita ranking is calculated by dividing a country’s projected nominal GDP by its projected population for 2026, resulting in an estimate of economic output per resident. Countries are then ranked from highest to lowest according to this figure. The analysis focuses on economies for which the IMF provides a 2026 projection and uses the values as reported in the dataset rather than converting them into purchasing-power-parity terms. As a result, the rankings are based on data about 144 countries, with 94 nations being excluded for either unavailable GDP figures for all years between 2016 and 2026, or due to a population below 1 million people.
All figures are presented in U.S. dollars, with total GDP shown in trillions or billions where appropriate and GDP per capita shown in individual dollars. Because these are projections rather than final reported figures, they may change as the IMF updates its forecasts or as exchange rates, economic conditions and population estimates change.
A rise in dollar-denominated GDP per capita should not automatically be mistaken for a rise in living standards – it is important to distinguish GDP per capita from household income or personal wealth. A high GDP per capita indicates a high level of economic output relative to population, but it does not show how that output is distributed, how much residents earn, their purchasing power, wealth inequality or their cost of living. The indicator is therefore used here as a consistent measure for comparing the relative economic output of countries on a per-person basis, rather than as a direct measure of individual prosperity.
| Countries Ranked by GDP per Capita Growth 2025-2026 (current U.S. dollars, figures rounded) | ||||||
|---|---|---|---|---|---|---|
| Country | Region | Population 2026, Estimate | Nominal GDP 2026, IMF Projection | GDP per Capita 2026 | GDP per Capita Growth 2016-2026 | GDP per Capita Growth 2025-2026 |
| World | 8,054,991,000 | $126,295,331,000,000 | $15,679 | 49.66% | 6.55% | |
| Zambia | Sub-Saharan Africa | 22,522,000 | $41,243,000,000 | $1,831 | 47.74% | 38.95% |
| Congo, Dem. Rep. of the | Sub-Saharan Africa | 110,020,000 | $123,406,000,000 | $1,122 | 135.02% | 28.74% |
| Nigeria | Sub-Saharan Africa | 242,578,000 | $377,365,000,000 | $1,556 | -46.69% | 27.23% |
| Bolivia | South America | 12,749,000 | $80,743,000,000 | $6,333 | 70.18% | 24.02% |
| Guyana | South America | 1,024,000 | $33,961,000,000 | $33,167 | 452.24% | 22.87% |
| Paraguay | South America | 6,460,000 | $60,542,000,000 | $9,372 | 55.01% | 21.84% |
| Uzbekistan | Caucasus & Central Asia | 38,943,000 | $181,502,000,000 | $4,661 | 51.21% | 21.17% |
| Haiti | Central Amerca & The Caribbean | 12,725,000 | $39,180,000,000 | $3,079 | 143.69% | 20.43% |
| Kazakhstan | Caucasus & Central Asia | 20,594,000 | $360,456,000,000 | $17,503 | 126.85% | 17.83% |
| Malawi | Sub-Saharan Africa | 24,750,000 | $18,152,000,000 | $733 | 76.72% | 17.26% |
| Colombia | South America | 53,399,000 | $539,530,000,000 | $10,104 | 67.36% | 17.18% |
| Burkina Faso | Sub-Saharan Africa | 24,648,000 | $32,513,000,000 | $1,319 | 98.80% | 17.11% |
| Israel | MENA | 10,312,000 | $719,848,000,000 | $69,804 | 85.73% | 15.69% |
| Egypt | Sub-Saharan Africa | 110,058,000 | $429,645,000,000 | $3,904 | 1.08% | 15.52% |
| Brazil | South America | 214,083,000 | $2,635,912,000,000 | $12,313 | 39.72% | 15.22% |
| Mexico | North America | 134,407,000 | $2,120,855,000,000 | $15,779 | 75.33% | 14.83% |
| Namibia | Sub-Saharan Africa | 3,107,000 | $17,314,000,000 | $5,573 | 25.10% | 14.62% |
| Tajikistan | Caucasus & Central Asia | 10,530,000 | $20,418,000,000 | $1,939 | 142.17% | 14.52% |
| Mauritania | Sub-Saharan Africa | 4,732,000 | $14,352,000,000 | $3,033 | 79.39% | 14.26% |
| Burundi | Sub-Saharan Africa | 14,903,000 | $8,137,000,000 | $546 | 107.33% | 14.18% |
| Chile | South America | 20,151,000 | $407,850,000,000 | $20,240 | 47.68% | 14.12% |
| Australia | Australia & Oceania | 28,077,000 | $2,123,963,000,000 | $75,648 | 45.52% | 14.01% |
| Bulgaria | Europe | 6,211,000 | $148,121,000,000 | $23,848 | 213.95% | 13.99% |
| North Macedonia | Europe | 1,805,000 | $21,605,000,000 | $11,967 | 113.48% | 13.47% |
| Kosovo | Europe | 1,569,000 | $14,053,000,000 | $8,958 | 140.35% | 13.37% |
| Romania | Europe | 18,715,000 | $480,834,000,000 | $25,693 | 173.94% | 13.06% |
| Serbia | Europe | 6,493,000 | $112,025,000,000 | $17,252 | 188.38% | 12.88% |
| Chad | Sub-Saharan Africa | 19,491,000 | $25,628,000,000 | $1,315 | 46.44% | 12.85% |
| Sweden | Europe | 10,760,000 | $760,481,000,000 | $70,676 | 37.69% | 12.79% |
| Uruguay | South America | 3,481,000 | $96,092,000,000 | $27,608 | 67.15% | 12.46% |
| Norway | Europe | 5,661,000 | $599,406,000,000 | $105,877 | 45.08% | 12.08% |
| Georgia | Caucasus & Central Asia | 3,691,000 | $42,716,000,000 | $11,574 | 179.42% | 11.87% |
| Bosnia and Herzegovina | Europe | 3,436,000 | $36,771,000,000 | $10,701 | 119.41% | 11.85% |
| Czech Republic | Europe | 10,871,000 | $432,597,000,000 | $39,795 | 112.45% | 11.54% |
| Lithuania | Europe | 2,898,000 | $105,907,000,000 | $36,545 | 144.81% | 11.28% |
| Albania | Europe | 2,668,000 | $33,333,000,000 | $12,493 | 202.90% | 11.20% |
| Mongolia | East Asia | 3,623,000 | $28,450,000,000 | $7,853 | 119.66% | 10.93% |
| Eswatini | Sub-Saharan Africa | 1,176,000 | $5,792,000,000 | $4,927 | 40.56% | 10.91% |
| South Africa | Sub-Saharan Africa | 63,970,000 | $479,964,000,000 | $7,503 | 30.90% | 10.84% |
| Botswana | Sub-Saharan Africa | 2,584,000 | $21,937,000,000 | $8,490 | 25.79% | 10.80% |
| Benin | Sub-Saharan Africa | 15,357,000 | $27,786,000,000 | $1,809 | 79.09% | 10.73% |
| Latvia | Europe | 1,857,000 | $53,686,000,000 | $28,913 | 109.99% | 10.71% |
| Peru | South America | 34,753,000 | $380,900,000,000 | $10,960 | 67.71% | 10.59% |
| Belarus | Europe | 9,042,000 | $102,042,000,000 | $11,286 | 124.03% | 10.55% |
| Bangladesh | South Asia | 175,423,000 | $510,705,000,000 | $2,911 | 73.39% | 10.46% |
| Guinea-Bissau | Sub-Saharan Africa | 2,060,000 | $2,985,000,000 | $1,449 | 93.63% | 10.45% |
| Poland | Europe | 36,196,000 | $1,134,248,000,000 | $31,336 | 151.59% | 10.44% |
| Togo | Sub-Saharan Africa | 10,020,000 | $13,437,000,000 | $1,341 | 73.62% | 10.23% |
| Côte d’Ivoire | Sub-Saharan Africa | 33,838,000 | $112,115,000,000 | $3,313 | 74.71% | 10.23% |
| Portugal | Europe | 10,742,000 | $380,637,000,000 | $35,434 | 77.93% | 10.16% |
| Hungary | Europe | 9,536,000 | $271,122,000,000 | $28,430 | 115.57% | 10.09% |
| Estonia | Europe | 1,369,000 | $51,634,000,000 | $37,718 | 102.12% | 9.88% |
| Greece | Europe | 10,357,000 | $307,554,000,000 | $29,696 | 65.89% | 9.82% |
| Croatia | Europe | 3,882,000 | $116,574,000,000 | $30,030 | 134.31% | 9.69% |
| Slovak Republic | Europe | 5,406,000 | $168,897,000,000 | $31,242 | 87.69% | 9.63% |
| Ethiopia | Sub-Saharan Africa | 112,370,000 | $121,527,000,000 | $1,081 | 36.76% | 9.63% |
| Algeria | Africa | 47,851,000 | $317,173,000,000 | $6,628 | 49.74% | 9.62% |
| Niger | Sub-Saharan Africa | 30,204,000 | $24,813,000,000 | $822 | 65.00% | 9.58% |
| Moldova | Europe | 2,340,000 | $21,889,000,000 | $9,354 | 231.02% | 9.50% |
| Armenia | Caucasus & Central Asia | 3,062,000 | $31,873,000,000 | $10,410 | 194.09% | 9.34% |
| Mali | Sub-Saharan Africa | 26,020,000 | $33,847,000,000 | $1,301 | 48.91% | 9.29% |
| Switzerland | Europe | 9,090,000 | $1,146,911,000,000 | $126,177 | 50.41% | 9.13% |
| Slovenia | Europe | 2,135,000 | $86,732,000,000 | $40,630 | 89.41% | 8.76% |
| Spain | Europe | 50,314,000 | $2,091,222,000,000 | $41,563 | 55.52% | 8.55% |
| Singapore | Southeast Asia | 6,121,000 | $659,572,000,000 | $107,758 | 88.37% | 8.45% |
| Denmark | Europe | 6,037,000 | $503,772,000,000 | $83,445 | 52.55% | 8.31% |
| Oman | MENA | 5,414,000 | $117,176,000,000 | $21,645 | 27.17% | 8.25% |
| Netherlands | Europe | 18,140,000 | $1,449,704,000,000 | $79,918 | 70.27% | 8.24% |
| Malaysia | Southeast Asia | 34,234,000 | $516,428,000,000 | $15,085 | 58.40% | 8.15% |
| Canada | North America | 41,578,000 | $2,507,340,000,000 | $60,305 | 42.29% | 8.14% |
| Germany | Europe | 83,501,000 | $5,452,858,000,000 | $65,303 | 51.20% | 8.05% |
| United Arab Emirates | MENA | 11,465,000 | $621,546,000,000 | $54,214 | 29.70% | 7.93% |
| Italy | Europe | 58,879,000 | $2,738,164,000,000 | $46,505 | 48.31% | 7.48% |
| Kuwait | MENA | 5,214,000 | $172,920,000,000 | $33,164 | 23.77% | 7.41% |
| Ukraine | Europe | 32,283,000 | $225,337,000,000 | $6,980 | 217.13% | 7.40% |
| Uganda | Sub-Saharan Africa | 49,706,000 | $73,370,000,000 | $1,476 | 78.51% | 7.38% |
| Kyrgyz Republic | Caucasus & Central Asia | 7,372,000 | $23,606,000,000 | $3,202 | 182.92% | 7.30% |
| Ireland | Europe | 5,560,000 | $779,381,000,000 | $140,186 | 119.48% | 7.30% |
| Guinea | Sub-Saharan Africa | 16,198,000 | $29,930,000,000 | $1,848 | 171.75% | 7.29% |
| Austria | Europe | 9,205,000 | $623,719,000,000 | $67,761 | 50.47% | 7.28% |
| Cameroon | Sub-Saharan Africa | 30,646,000 | $65,135,000,000 | $2,125 | 47.46% | 7.13% |
| New Zealand | Australia & Oceania | 5,356,000 | $278,636,000,000 | $52,023 | 31.93% | 7.00% |
| Equatorial Guinea | Sub-Saharan Africa | 1,683,000 | $13,722,000,000 | $8,152 | -11.40% | 6.87% |
| Belgium | Europe | 11,929,000 | $776,730,000,000 | $65,112 | 55.33% | 6.74% |
| Nicaragua | Central Amerca & The Caribbean | 6,808,000 | $24,227,000,000 | $3,559 | 69.50% | 6.66% |
| Djibouti | Sub-Saharan Africa | 1,069,000 | $4,725,000,000 | $4,421 | 57.68% | 6.64% |
| Taiwan Province of China | East Asia | 23,198,000 | $976,719,000,000 | $42,103 | 82.49% | 6.62% |
| Saudi Arabia | MENA | 36,726,000 | $1,388,676,000,000 | $37,811 | 69.80% | 6.62% |
| Finland | Europe | 5,616,000 | $337,669,000,000 | $60,130 | 38.22% | 6.49% |
| China, People’s Republic of | East Asia | 1,401,923,000 | $20,851,593,000,000 | $14,874 | 80.83% | 6.48% |
| France | Europe | 69,045,000 | $3,596,094,000,000 | $52,083 | 40.46% | 6.44% |
| Mauritius | Sub-Saharan Africa | 1,239,000 | $17,119,000,000 | $13,812 | 37.78% | 6.43% |
| Congo, Republic of | Sub-Saharan Africa | 6,668,000 | $17,028,000,000 | $2,554 | 21.21% | 6.24% |
| Rwanda | Sub-Saharan Africa | 14,471,000 | $17,336,000,000 | $1,198 | 60.72% | 6.22% |
| Turkmenistan | Caucasus & Central Asia | 6,753,000 | $83,065,000,000 | $12,300 | 99.52% | 6.16% |
| Senegal | Sub-Saharan Africa | 19,700,000 | $40,469,000,000 | $2,054 | 61.81% | 6.12% |
| El Salvador | Central Amerca & The Caribbean | 6,430,000 | $39,838,000,000 | $6,196 | 58.81% | 6.11% |
| Kenya | Sub-Saharan Africa | 54,269,000 | $147,265,000,000 | $2,714 | 60.68% | 6.10% |
| United Kingdom | Europe | 69,850,000 | $4,264,794,000,000 | $61,056 | 47.44% | 5.99% |
| Costa Rica | Central Amerca & The Caribbean | 5,416,000 | $109,931,000,000 | $20,299 | 69.34% | 5.93% |
| Vietnam | Southeast Asia | 103,077,000 | $527,266,000,000 | $5,115 | 88.05% | 5.92% |
| Liberia | Sub-Saharan Africa | 5,854,000 | $5,642,000,000 | $964 | 35.77% | 5.89% |
| Gabon | Sub-Saharan Africa | 2,356,000 | $23,363,000,000 | $9,918 | 40.03% | 5.77% |
| Dominican Republic | Central Amerca & The Caribbean | 10,975,000 | $136,148,000,000 | $12,406 | 65.27% | 5.59% |
| Indonesia | South Asia | 287,198,000 | $1,539,872,000,000 | $5,362 | 48.73% | 5.49% |
| Morocco | Sub-Saharan Africa | 38,050,000 | $194,333,000,000 | $5,107 | 57.87% | 5.49% |
| Tanzania | Sub-Saharan Africa | 69,653,000 | $94,889,000,000 | $1,362 | 40.64% | 5.47% |
| Gambia, The | Sub-Saharan Africa | 2,930,000 | $2,792,000,000 | $953 | 48.07% | 5.40% |
| Madagascar | Sub-Saharan Africa | 32,319,000 | $21,185,000,000 | $656 | 33.93% | 5.40% |
| Ecuador | South America | 18,244,000 | $138,194,000,000 | $7,575 | 28.22% | 5.23% |
| India | South Asia | 1,476,626,000 | $4,153,191,000,000 | $2,813 | 66.90% | 5.13% |
| Sierra Leone | Sub-Saharan Africa | 9,002,000 | $8,270,000,000 | $919 | 9.63% | 5.10% |
| Cambodia | Southeast Asia | 18,051,000 | $52,379,000,000 | $2,902 | 73.57% | 5.07% |
| Lao P.D.R. | Southeast Asia | 7,889,000 | $18,959,000,000 | $2,403 | 4.14% | 5.02% |
| Guatemala | Central Amerca & The Caribbean | 18,925,000 | $128,886,000,000 | $6,810 | 67.78% | 4.95% |
| United States | North America | 342,942,000 | $32,383,920,000,000 | $94,430 | 62.31% | 4.93% |
| Tunisia | MENA | 12,415,000 | $60,745,000,000 | $4,893 | 27.16% | 4.92% |
| Hong Kong SAR | East Asia | 7,548,000 | $450,138,000,000 | $59,640 | 37.14% | 4.83% |
| Jordan | MENA | 11,590,000 | $64,909,000,000 | $5,601 | 27.56% | 4.59% |
| Philippines | Southeast Asia | 115,299,000 | $512,222,000,000 | $4,443 | 42.96% | 4.04% |
| Angola | Sub-Saharan Africa | 40,584,000 | $152,354,000,000 | $3,754 | -5.94% | 3.86% |
| Zimbabwe | Sub-Saharan Africa | 17,728,000 | $56,713,000,000 | $3,199 | 57.14% | 3.85% |
| Timor-Leste | Southeast Asia | 1,427,000 | $2,170,000,000 | $1,520 | 12.74% | 3.82% |
| Panama | Central Amerca & The Caribbean | 4,621,000 | $95,024,000,000 | $20,564 | 38.91% | 3.78% |
| Papua New Guinea | Australia & Oceania | 13,072,000 | $34,403,000,000 | $2,632 | 17.21% | 3.71% |
| Korea, Republic of | East Asia | 51,615,000 | $1,931,008,000,000 | $37,412 | 21.37% | 3.27% |
| Jamaica | Central Amerca & The Caribbean | 2,756,000 | $23,028,000,000 | $8,356 | 52.31% | 3.09% |
| Russian Federation | Caucasus & Central Asia | 143,394,000 | $2,656,452,000,000 | $18,525 | 110.88% | 3.08% |
| Trinidad and Tobago | Central Amerca & The Caribbean | 1,442,000 | $26,836,000,000 | $18,616 | 8.55% | 3.01% |
| Lesotho | Sub-Saharan Africa | 2,394,000 | $2,972,000,000 | $1,241 | 19.88% | 2.91% |
| Honduras | Central Amerca & The Caribbean | 11,185,000 | $41,505,000,000 | $3,711 | 60.87% | 2.89% |
| Nepal | South Asia | 29,623,000 | $45,844,000,000 | $1,548 | 76.41% | 2.38% |
| Türkiye, Republic of | MENA | 86,245,000 | $1,640,223,000,000 | $19,018 | 73.23% | 2.19% |
| Puerto Rico | Central Amerca & The Caribbean | 3,174,000 | $129,012,000,000 | $40,650 | 32.91% | 2.02% |
| Azerbaijan | Caucasus & Central Asia | 10,496,000 | $78,372,000,000 | $7,467 | 91.57% | 1.98% |
| Mozambique | Sub-Saharan Africa | 36,826,000 | $23,275,000,000 | $632 | 45.74% | 1.39% |
| Ghana | Africa | 35,698,000 | $118,293,000,000 | $3,314 | 73.27% | 1.30% |
| Myanmar | Southeast Asia | 55,185,000 | $83,832,000,000 | $1,519 | 24.49% | 1.12% |
| Bahrain | MENA | 1,652,000 | $48,849,000,000 | $29,569 | 24.24% | 0.77% |
| Thailand | Southeast Asia | 71,560,000 | $579,996,000,000 | $8,105 | 38.94% | 0.60% |
| Argentina | South America | 47,948,000 | $688,378,000,000 | $14,357 | 12.40% | 0.01% |
| Japan | East Asia | 122,656,000 | $4,379,253,000,000 | $35,703 | -11.30% | -0.75% |
| Qatar | MENA | 3,191,000 | $217,416,000,000 | $68,138 | 17.55% | -2.21% |
| Iran | MENA | 87,934,000 | $300,293,000,000 | $3,415 | -42.85% | -19.91% |