

Inflation has become a distinctly global concern, even if its effects are being felt unevenly. Rising energy costs, disrupted supply chains, and expensive imports continue to test household budgets, while governments and central banks face the difficult task of containing prices without choking economic growth.
Events in one major economy can quickly affect the rest: Friday’s US inflation figures showed consumer prices rising 3.4% year on year in August, with the monthly increase strengthening expectations of a Federal Reserve rate hike. That prospect has already influenced bond yields, currency markets and expectations for borrowing costs worldwide. Yet the US figures tell only part of the story. Against this international backdrop, the team at BestBrokers compared annual inflation rates in July and August 2026 to identify where price pressures accelerated the most. We looked at 93 countries with CPI (Consumer Price Index) data available for August, sourcing figures from national statistics offices and Trading Economics.
Key Takeaways:
- Argentina and Turkey remain the countries with the highest annual inflation in August, with prices rising 33.5% and 31.51% compared to August 2025, respectively.
- Inflation accelerated the most in Pakistan and in the tropical island nation of Fiji, where annual inflation rose from 14.5% in July to 15.7% in August and from 9.2% to 11.1% (a change of 1.9 percentage points in both).
- The only country where prices fell compared to August 2025 is the Central American nation of Costa Rica, with a deflation of 0.17%, whereas insignificant increases can be seen in the West African country Benin (0.1%) and Sweden (0.3%).
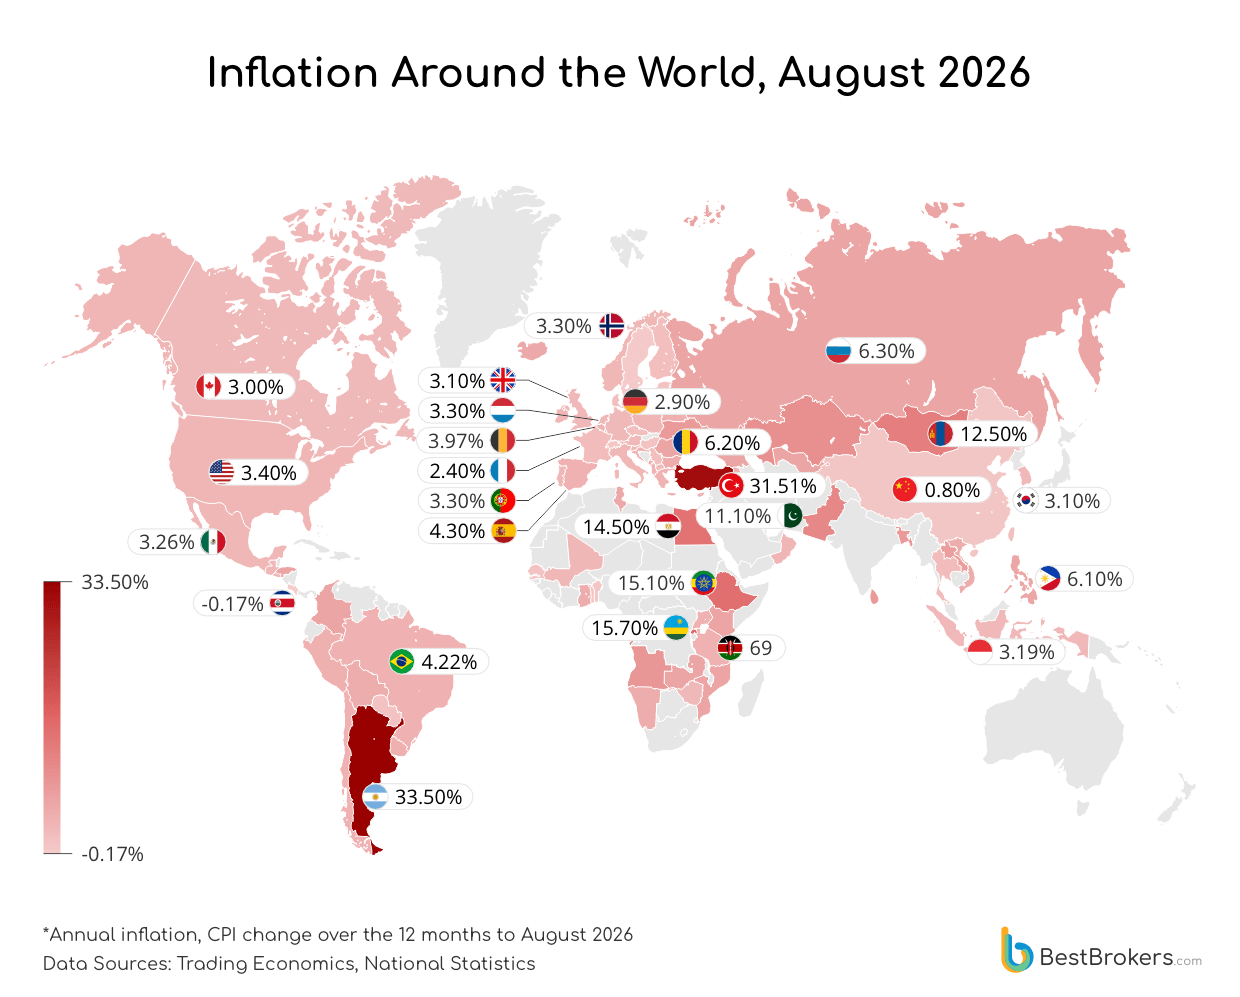
Price Pressures Remain Highest in Argentina & Turkey
In August 2026, Argentina remained the country with the highest annual inflation rate in the world, at 33.5%, although the latest monthly figures offer a small sign of improvement. According to the National Institute of Statistics and Censuses (INDEC), consumer prices rose by 1.7% month on month, down from 2.1% in July, marking the lowest monthly increase in 14 months.
However, the underlying picture remains difficult: core inflation held at 1.8%, while housing, utilities, and fuel recorded some of the strongest monthly increases. The government’s earlier expectation of bringing annual inflation close to 10% has already been overtaken by reality, with private-sector forecasts pointing to a year-end rate closer to 30%.
Turkey ranks second among the 93 countries analysed, with annual inflation at 31.51%, down slightly from 31.75% in July. The monthly rate nevertheless rose by 1.84% – as expected, disinflation remains an inconsistent, fragile process. Food, transport and housing were the largest contributors to annual price growth, while transport prices increased particularly sharply during August.
Countries with the Highest Inflation in August 2026
Annual inflation, CPI change over the 12 months to August 2026
Sources: Trading Economics, National Statistics
The figures come as Turkey continues to pursue a restrictive economic policy aimed at restoring price stability, but weak domestic demand and slower economic growth are making the adjustment persistently difficult. The Turkish economy grew by only 2.3% year on year in the second quarter, below economists’ expectations of 2.9% to 3%, indicating the trade-off between controlling inflation and maintaining momentum.
Rwanda is another notable case, recording annual inflation of 15.7% in August, up from 14.5% in July, according to the National Institute of Statistics of Rwanda (NISR). The rise was driven particularly by food, housing, and transport costs, with energy prices also remaining a significant source of pressure. Rwanda’s central bank responded by raising its policy rate to 8.75%, its highest level in many years, in an attempt to contain inflationary momentum. The country’s experience illustrates how quickly price pressures can intensify in economies exposed to food-supply constraints, imported costs, and higher energy prices.
Next comes Ethiopia, where the inflation rate stands at 15.1%, while Egypt registers 14.5%, keeping both economies under considerable pressure from food, housing, and other essential costs. Pakistan’s inflation rate reached 11.1%, returning to double-digit territory, while Kazakhstan recorded 9.8%, with domestic prices still affected by food, fuel, and wider cost pressures. Although these rates remain well below those of Argentina and Turkey, they are high enough to place significant strain on household purchasing power and complicate monetary-policy decisions.
Across Europe, inflation is generally far lower than the above-mentioned economies, but several countries still face notable price pressures. Ukraine records the highest rate among the 43 European countries analysed at 8.1%, up from 7.7% in July. Although consumer prices rose by just 0.1% month on month, fuel prices increased by 8.1%, while water and sewerage tariffs rose by 16.8% and 16.7%, respectively. Persistent pressure on food, energy, housing, and transport costs continues to weigh on households, while the war has disrupted production, logistics, and domestic supply chains, making it harder for prices to stabilise.
Other European countries where prices keep rising significantly from last year are Kosovo (7.3%), Romania (6.2%), and Lithuania (6.1%). Interestingly, Romania’s government recently took austerity measures to combat the budget deficit and inflation, and August figures might be at least partially a result of those – inflation had fallen sharply from 8.2% in July to 6.2% in August. Still, this is the highest inflation rate across the European Union.
Elsewhere in Europe, Spain’s annual inflation rose to 4.3%, up from 3.6% in July, while Bulgaria reached 5.1% and Croatia 4.1%. Recent data also point to energy as a renewed source of concern: Eurostat’s August flash estimate put euro-area inflation at 3.3%, up from 2.9% in July, with energy prices rising by 14.3% year on year. Spain’s final August figure was subsequently confirmed at 4.3% on its national measure, while Germany’s inflation rate reached 2.9%.
Meanwhile, prices rose 3.4% in the United States in August, still considerably above the Federal Reserve’s 2% inflation goal and slightly above the 3.3% forecasts. The August inflation strengthened expectations of another rate increase, with Reuters reporting that markets were pricing roughly an 85% probability of a hike.
Countries with the Lowest Inflation in August 2026
Annual inflation, CPI change over the 12 months to August 2026
Sources: Trading Economics, National Statistics
The other end of the ranking is almost as interesting as the inflation hotspots, with several economies recording very low inflation, while Costa Rica is the only country with a negative annual rate.
Consumer prices in the Central American country of Costa Rica fell 0.17% year on year in August, continuing the trend from -0.28% in July. That technically puts the country in deflation: prices were slightly lower overall than a year earlier in August. The change is small, however, so it would be misleading to describe Costa Rica as experiencing a serious deflationary episode on the basis of this figure alone.
Sweden has the lowest inflation rate, at just 0.3%, up marginally from 0.2% in July. Cheaper food eased inflation in August, but this was partly offset by rising electricity and fuel costs: food and non-alcoholic beverages were 6.6% cheaper than a year earlier, contributing -0.9 percentage points to headline CPI.
The West African nation of Benin is another near-zero case, with inflation at just 0.1%, compared with 0% in July. Meanwhile, China records just 0.8%, one of the lowest rates among the world’s major economies. China’s figure is particularly notable because it rose from 0.5% in July, but underlying domestic demand remains weak, and price declines continue to undermine economic growth. Retail sales, for instance, grew by just 0.4% year-on-year in August, slowing down from July and missing economists’ forecasts, while fixed-asset investment dropped by 7.2% from January to August, hurt heavily by the ongoing property market crisis.
Of course, low inflation is not necessarily synonymous with a strong economy. In Sweden, cheaper food helped suppress the headline rate, while China’s unusually weak price growth reflects subdued domestic demand alongside pockets of deflation. For households, very low inflation can be welcome when it reflects cheaper essentials, but persistent or broad-based deflation can instead signal weak consumption and discourage businesses and consumers from spending.
Where Is Inflation Accelerating?
Countries Where Inflation Accelerated the Most Between July and August 2026
| Country | Annual Inflation, July 2026 | Annual Inflation, August 2026 | Difference (pts) |
|---|---|---|---|
| Pakistan | 9.20% | 11.10% | +1.9 pp |
| Fiji | 5.70% | 7.60% | +1.9 pp |
| Rwanda | 14.50% | 15.70% | +1.2 pp |
| Senegal | 0.30% | 1.20% | +0.9 pp |
| Kosovo | 6.50% | 7.30% | +0.8 pp |
| Montenegro | 3.80% | 4.50% | +0.7 pp |
| Moldova | 6.30% | 7.00% | +0.7 pp |
| Sri Lanka | 7.30% | 8.00% | +0.7 pp |
| El Salvador | 2.49% | 3.19% | +0.7 pp |
| Spain | 3.60% | 4.30% | +0.7 pp |
| Guatemala | 2.70% | 3.37% | +0.67 pp |
| Honduras | 5.58% | 6.20% | +0.62 pp |
| Latvia | 2.60% | 3.20% | +0.6 pp |
| Chile | 3.50% | 4.10% | +0.6 pp |
| Namibia | 4.40% | 5.00% | +0.6 pp |
| Bulgaria | 4.50% | 5.10% | +0.6 pp |
| Cyprus | 2.93% | 3.52% | +0.59 pp |
| Thailand | 1.95% | 2.53% | +0.58 pp |
| Mali | 2.80% | 3.30% | +0.5 pp |
| Mauritius | 4.40% | 4.90% | +0.5 pp |
Sources: Trading Economics, National Statistics
When inflation accelerates, the consequences tend to reach well beyond the supermarket till. Households find their purchasing power squeezed, companies face rising costs and tougher decisions over prices, wages, and investment, while higher interest rates can make mortgages and business borrowing more expensive. If the pressure persists, what begins as a rise in prices can become a broader drag on consumption, investment, and economic growth.
If we compare annual inflation rates in July and August rather than just month-over-month rates, Pakistan and Fiji record the fastest acceleration in price growth, with annual inflation rising by 1.9 percentage points over the past two months in both countries. Pakistan’s rate climbed from 9.2% in July to 11.1% in August, while Fiji’s increased from 5.7% to 7.6%. These accelerations are particularly significant because both economies were already experiencing substantial price pressures, meaning households and businesses now face a further deterioration in purchasing power and higher operating costs.
The rise in Pakistan represents a notable reversal after the easing recorded in July. The State Bank of Pakistan’s August monetary policy report indicated that inflation was expected to moderate gradually and move towards the upper end of its 5-7% target range by the end of the 2026-27 financial year. However, the latest increase shows that price pressures remain difficult to contain fully. Pakistan’s inflation outlook is especially sensitive to food, energy, and imported-cost pressures. When those become more expensive, the impact can spread through transport, production, and retail prices. The renewed rise above 11% presents a challenge for households whose wages may not adjust at the same pace as consumer prices.
Fiji also records a sharp acceleration, with Trading Economics describing the August rate as the highest since December 2011, with food inflation identified as one of the key factors behind the increase. For an island economy such as Fiji, imported goods and transport costs can have an outsized influence on domestic prices. International freight, fuel and food costs can feed into the prices paid by consumers, while limited domestic production may reduce the ability of local markets to absorb external shocks.
Rwanda experiences the second biggest acceleration in annual inflation among the 93 countries analysed. Its inflation rate rose from 14.5% in July to 15.7% in August, an increase of 1.2 percentage points. Compared to July, prices rose by 3.7%, with fresh food products increasing 5.8% and 20.9% on an annual basis, while restaurant prices went up 2% (15.6% yearly). Energy prices were a major contributor to annual inflation, rising 45.4% (0.2% on a monthly basis), as were transport costs, which recorded inflation of 24.2% (0.2% month over month).
The renewed pressure on food prices is particularly significant for households, as food typically represents a larger share of expenditure in lower-income economies. Rwanda’s authorities have previously linked food-price pressures to weaker domestic supply, unfavourable weather conditions, and higher agricultural input costs, including fertilisers and seeds. These factors can affect both the availability of locally produced food and the cost of distributing it across the country.
Rwanda’s latest figures also demonstrate that a country can experience substantial inflationary pressure even when the wider global picture appears more stable. The OECD reported that inflation across its member economies was broadly unchanged at 4.1% in July 2026, but national outcomes continue to differ considerably depending on domestic supply conditions, commodity exposure, and the composition of consumer spending.
Across Europe, annual inflation accelerated in smaller economies, including Kosovo, where July’s 6.5% turned into 7.3% in August, Moldova’s 6.3% in July became 7% in August, and Montenegro, where annual inflation took off from a more manageable 3.8% to a concerning 4.5%. Among larger economies, Spain’s inflation accelerated to 4.3% in August, up from 3.6% in July. Driven by rising fuel prices, inflation increased by 0.7% over the month to its highest level since February 2023, reportedly marking the greatest acceleration in inflation since 1992, 34 years ago. Meanwhile, prices of food and non-alcoholic beverages rose 2.3% year-on-year.
In fact, inflation sped up in most of Europe, with no change recorded in Luxembourg, where the rate stood stable at 2.2% for the third consecutive month. In Albania and Estonia, prices still increased but at a slower pace compared to July, with August inflation going down to 3.2% and 1.5%, respectively. Romania’s inflation, although still sky-high at 6.2%, eased from July when it was 8.2%, driven by seasonal, month-over-month declines in vegetables and fresh fruit of 7% and 5.5%, respectively. Natural gas also dropped 4% on the month, yet fuel prices shot up by 6%, showing that geopolitical tensions and international energy prices have an outsized effect on local markets.
Meanwhile, the United States and Canada recorded no change in their annual inflation rates, with August figures at 3.4% and 3%, respectively. This divergence between nations is important: a stable or falling headline rate in one country does not necessarily mean that global price pressures have disappeared. Instead, inflation is shaped by national conditions, including energy exposure, food supply, exchange rates, government policy, and the timing of price changes.
Methodology
The team at BestBrokers compared annual inflation rates for a total of 93 countries for July and August 2026. The figures were compiled from national statistical offices, as well as Trading Economics. For each country, the change was calculated in percentage points by subtracting the August inflation rate from the July rate. Countries were ranked according to the size of this change, with positive values indicating an acceleration in annual inflation and negative values indicating a slowdown.
Annual Inflation Rate | World, July and August, 2026
| Country | Jul/26 | Aug/26 | Difference, percentage points |
|---|---|---|---|
| Argentina | 33.80% | 33.50% | -0.3 |
| Turkey | 31.75% | 31.51% | -0.24 |
| Rwanda | 14.50% | 15.70% | 1.2 |
| Ethiopia | 15.30% | 15.10% | -0.2 |
| Egypt | 14.90% | 14.50% | -0.4 |
| Mongolia | 13.00% | 12.50% | -0.5 |
| Pakistan | 9.20% | 11.10% | 1.9 |
| Kazakhstan | 10.20% | 9.80% | -0.4 |
| Angola | 9.33% | 8.78% | -0.55 |
| Bangladesh | 8.32% | 8.26% | -0.06 |
| Ukraine | 7.70% | 8.10% | 0.4 |
| Sri Lanka | 7.30% | 8.00% | 0.7 |
| Laos | 7.60% | 7.70% | 0.1 |
| Fiji | 5.70% | 7.60% | 1.9 |
| Kosovo | 6.50% | 7.30% | 0.8 |
| Moldova | 6.30% | 7.00% | 0.7 |
| Kenya | 6.50% | 6.60% | 0.1 |
| Mozambique | 7.48% | 6.45% | -1.03 |
| Russia | 6.00% | 6.30% | 0.3 |
| Colombia | 6.03% | 6.24% | 0.21 |
| Honduras | 5.58% | 6.20% | 0.62 |
| Uzbekistan | 6.40% | 6.20% | -0.2 |
| Zambia | 6.50% | 6.20% | -0.3 |
| Romania | 8.20% | 6.20% | -2 |
| Philippines | 6.20% | 6.10% | -0.1 |
| Lithuania | 5.90% | 6.10% | 0.2 |
| Georgia | 5.50% | 5.60% | 0.1 |
| Iceland | 5.30% | 5.60% | 0.3 |
| Tunisia | 5.10% | 5.40% | 0.3 |
| Bulgaria | 4.50% | 5.10% | 0.6 |
| Bolivia | 4.93% | 5.02% | 0.09 |
| Namibia | 4.40% | 5.00% | 0.6 |
| Ghana | 4.60% | 5.00% | 0.4 |
| Mauritius | 4.40% | 4.90% | 0.5 |
| Vietnam | 4.45% | 4.89% | 0.44 |
| Uruguay | 4.27% | 4.55% | 0.28 |
| Montenegro | 3.80% | 4.50% | 0.7 |
| Belarus | 4.40% | 4.50% | 0.1 |
| Peru | 4.07% | 4.44% | 0.37 |
| Armenia | 4.50% | 4.40% | -0.1 |
| Spain | 3.60% | 4.30% | 0.7 |
| Tanzania | 4.20% | 4.30% | 0.1 |
| Brazil | 4.44% | 4.22% | -0.22 |
| Chile | 3.50% | 4.10% | 0.6 |
| Uganda | 4.00% | 4.10% | 0.1 |
| Croatia | 3.90% | 4.10% | 0.2 |
| Belgium | 3.56% | 3.97% | 0.41 |
| Greece | 3.40% | 3.80% | 0.4 |
| Ireland | 3.40% | 3.70% | 0.3 |
| Cyprus | 2.93% | 3.52% | 0.59 |
| Poland | 3.00% | 3.40% | 0.4 |
| Oman | 3.20% | 3.40% | 0.2 |
| United States | 3.40% | 3.40% | 0 |
| Guatemala | 2.70% | 3.37% | 0.67 |
| Italy | 2.90% | 3.30% | 0.4 |
| Mali | 2.80% | 3.30% | 0.5 |
| Norway | 3.00% | 3.30% | 0.3 |
| Portugal | 3.04% | 3.30% | 0.26 |
| Netherlands | 3.20% | 3.30% | 0.1 |
| Mexico | 3.12% | 3.26% | 0.14 |
| Latvia | 2.60% | 3.20% | 0.6 |
| Austria | 2.80% | 3.20% | 0.4 |
| Albania | 3.40% | 3.20% | -0.2 |
| El Salvador | 2.49% | 3.19% | 0.7 |
| Indonesia | 2.88% | 3.19% | 0.31 |
| South Korea | 2.80% | 3.10% | 0.3 |
| United Kingdom | 2.90% | 3.10% | 0.2 |
| Canada | 2.80% | 3.00% | 0.2 |
| Slovenia | 2.90% | 3.00% | 0.1 |
| Zimbabwe | 3.20% | 2.90% | -0.3 |
| Germany | 2.80% | 2.90% | 0.1 |
| Jordan | 2.70% | 2.66% | -0.04 |
| Macedonia | 2.30% | 2.60% | 0.3 |
| Thailand | 1.95% | 2.53% | 0.58 |
| France | 2.10% | 2.40% | 0.3 |
| Serbia | 1.90% | 2.20% | 0.3 |
| Finland | 2.10% | 2.20% | 0.1 |
| Luxembourg | 2.20% | 2.20% | 0 |
| Taiwan | 2.54% | 2.04% | -0.5 |
| Denmark | 1.70% | 2.00% | 0.3 |
| Czech Republic | 1.70% | 1.90% | 0.2 |
| Paraguay | 1.60% | 1.50% | -0.1 |
| Estonia | 2.20% | 1.50% | -0.7 |
| Hungary | 1.20% | 1.30% | 0.1 |
| Senegal | 0.30% | 1.20% | 0.9 |
| Seychelles | 0.78% | 0.93% | 0.15 |
| Liechtenstein | 0.40% | 0.80% | 0.4 |
| Switzerland | 0.40% | 0.80% | 0.4 |
| China | 0.50% | 0.80% | 0.3 |
| Togo | 1.60% | 0.70% | -0.9 |
| Sweden | 0.20% | 0.30% | 0.1 |
| Benin | 0.00% | 0.10% | 0.1 |
| Costa Rica | -0.28% | -0.17% | 0.11 |