
- Eight out of the ten largest companies by market cap are tech companies, and eight are American
- Iceland has the most billion-dollar companies per capita in the world, roughly 15 per million
- Within the past 6 months, the public companies with a market cap of at least $1 billion have added $16.6 trillion in value
For decades, the global economy has been dominated by a handful of nations, whose wealth, natural resources, manufacturing power, and technological advancements have dwarfed the achievements of the rest of the world. The United States is home to many of the largest corporations in terms of both revenue and market capitalisation. Of the 6,000 or so companies with a market cap of at least $1 billion, 1,909 are American. Another 1,980 corporations or so are concentrated within China, India, Japan, Canada, Australia, Germany, and the United Kingdom.
While the number of large-cap companies in a particular country shows the size of the national economy, it also heavily favours those nations with massive populations. Figures alone are not really capable of revealing the current state of the economy, especially in 2025, when inequality seems to be greater than ever and in contrast with recent conclusions by the World Bank that the number of highly unequal countries has dropped from 77 in 2000 to just 52 in 2022. As billionaires are now more and wealthier than ever and corporations generate billions of dollars in revenue for their shareholders, the team at BestBrokers is looking into the billion-dollar companies and where they are located around the world.
Using data from CompaniesMarketCap, a company tracking site, we identified 5,623 publicly traded companies with a market capitalisation of over $1 billion (excluding those from offshore territories) as of September 30, 2025. While the United States is home to the largest number of billion-dollar companies, 1,909 in total, Iceland, Switzerland, and Sweden have the most billion-dollar businesses per capita.
Moreover, we discovered that 5,323 public companies with a value of $1 billion as of the end of September have added $16.62 trillion to their market cap since March (valid information was unavailable for the remaining companies). This is a 6-month growth of 15.7%, with NVIDIA expanding the most – by $1.46 trillion between March and September. The fastest growth, however, can be seen in several smaller corporations, most notably U.S.-based provider of advanced wireless networking and autonomous aerial platforms, Ondas Holdings, which, from a $78-million company, rose to $2.6 billion in market capitalisation, an increase of 3,196%.
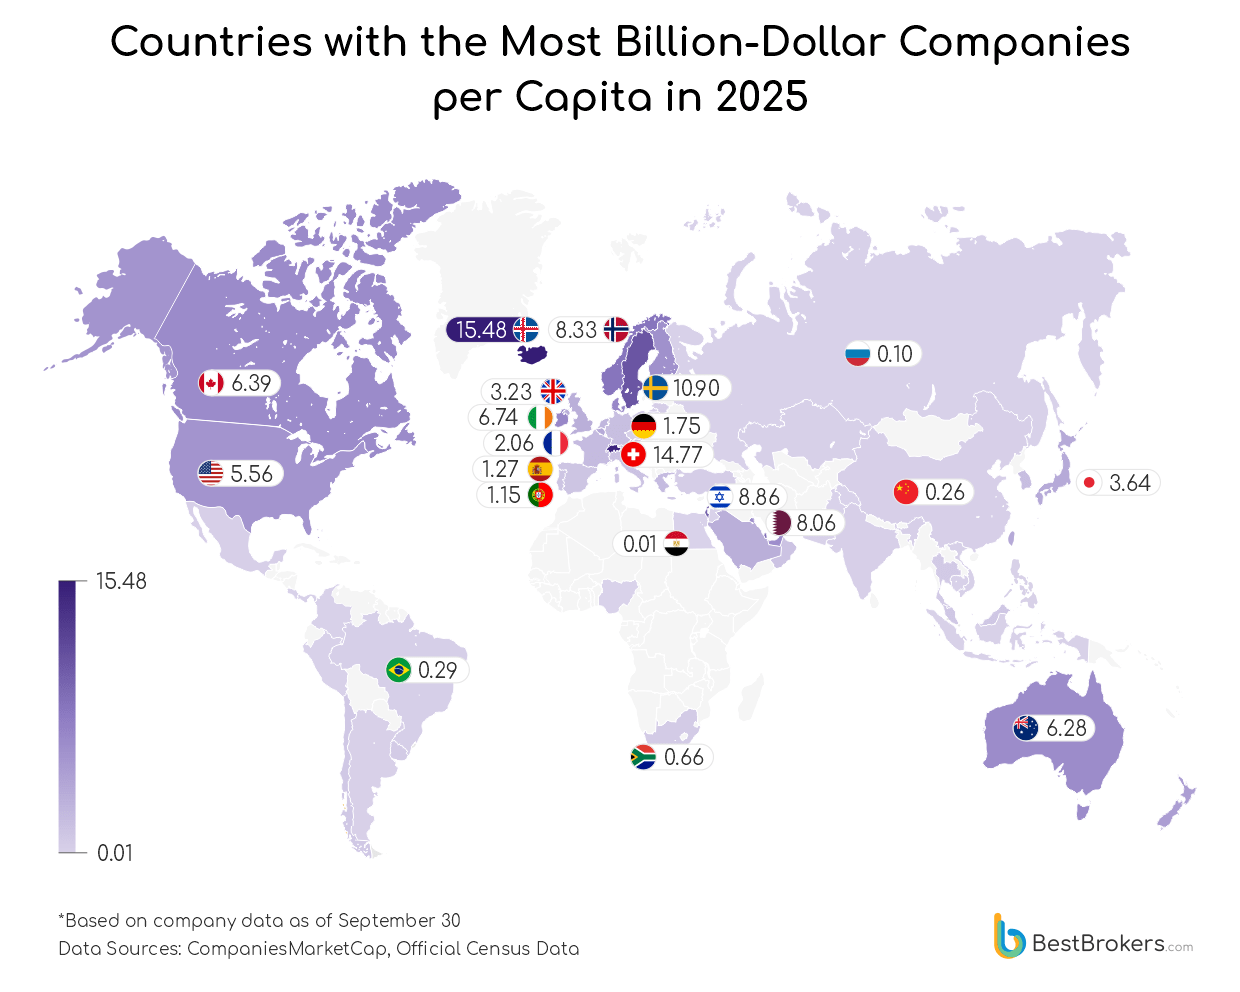
When we look at billion-dollar companies on a per-capita basis, some smaller and mid-sized economies stand out alongside larger, more established markets. Their positions reflect not just the number of major corporations they host, but how these figures compare to the size of their populations.
Despite being relatively isolated and small, Iceland tops the list. It is home to only 6 billion-dollar companies, which is modest in absolute terms, but when divided by fewer than 400,000 citizens, the per-capita ratio looks very high. To make it comparable to other nations, we calculated the density of large-cap businesses per 1 million citizens, and Iceland’s 6 companies equate to an average of 15.5 billion-dollar companies per million people.
With 14.8 and 11 billion-dollar companies per million residents, respectively, Switzerland and Sweden follow as both are global leaders in innovation and corporate strength. Their deep capital markets, skilled workforces, and heavy investment in research and development help sustain a large pool of multinational companies across finance, pharmaceuticals, manufacturing, and technology.
Israel, often described as the ‘startup nation’, ranks 4th with an average of 8.9 companies worth $1 billion or more per million people. Its concentration of large-cap businesses reflects the country’s prowess in high-tech industries, particularly cybersecurity, semiconductors, and medical technologies, which have matured into globally competitive firms. The financial sector, however, is most common among Israeli billion-dollar companies, with at least 18 of all 82 being banks, insurance, financial, or investment services companies.
Resource-rich nations like Norway and Qatar also feature within the top 10. Oil and gas wealth has fueled the rise of domestic giants, sovereign wealth funds, and investment vehicles that anchor their corporate landscapes. With 46 billion-dollar companies in total and 8.3 per million people, Norway ranks 5th, while Qatar ranks 6th with 8.1 companies per million. Ireland and Denmark, though smaller in scale, benefit from business-friendly policies, integration with the European market, and outward-looking industries that attract international capital. This explains why they rank 7th and 8th, respectively, with an average of 6.7 large-cap businesses per million residents.
Rounding out the top 10 are Canada (#9, 6.4 companies per million) and Australia (#10, 6.3 companies per million). Both are larger, diversified economies, and while their per-capita figures are lower than the smaller nations, their sheer numbers of billion-dollar firms demonstrate the depth and maturity of their corporate ecosystems.
Together, these countries highlight different pathways to building high densities of billion-dollar companies: through small populations that magnify per-capita figures, through strong innovation systems, or through natural resource wealth. Other major economies appear lower on the ranking due to their larger populations: the United States ranks 14th with an average of 5.6 billion-dollar companies per million people, Japan ranks 16th with 3.6 per million, and the United Kingdom ranks 18th with 3.2 businesses per million. Germany appears in the 25th position with 1.8 billion-dollar companies per million residents. Brazil ranks 41st with 0.3 per million, followed closely by Argentina, China, and India with similar billion-dollar companies-per-capita ratios.
Methodology
To identify the countries with the most billion-dollar companies per capita, we first looked at the publicly listed companies from the company and stock tracking website CompaniesMarketCap. We selected those with a market value, also referred to as market capitalisation (or market cap) of at least 1 billion U.S. dollars.
In our calculations, we included only independent, sovereign states, meaning territories and areas belonging to China and the United Kingdom, such as Macao or Bermuda, were excluded. Moreover, we carefully picked out well-known ‘sink’ offshore financial centres (OFC) with very low or zero corporate taxes, secrecy laws, and minimal reporting requirements. Companies often register subsidiaries there, but with little to no real economic activity (few employees, no significant operations).
Countries offering some offshore and shadow banking features in combination with a small economy or lack of sovereignty were not included in our research. The full list of excluded countries and territories features Bahamas, Bahrain, Bermuda, Cayman Islands, Costa Rica, Guernsey, Hong Kong, Isle of Man, Jersey, Liechtenstein, Luxembourg, Macau, Monaco, Panama, Singapore, and Taiwan. This gave us a total of 5,623 companies from 57 countries and territories.
For the countries’ total area, we looked at the list of national territories (land plus water) from the CIA’s World Factbook. Data for the gross domestic product of countries for 2024 was sourced from the World Bank.
American Corporations Dominate with $68 Trillion in Combined Market Cap
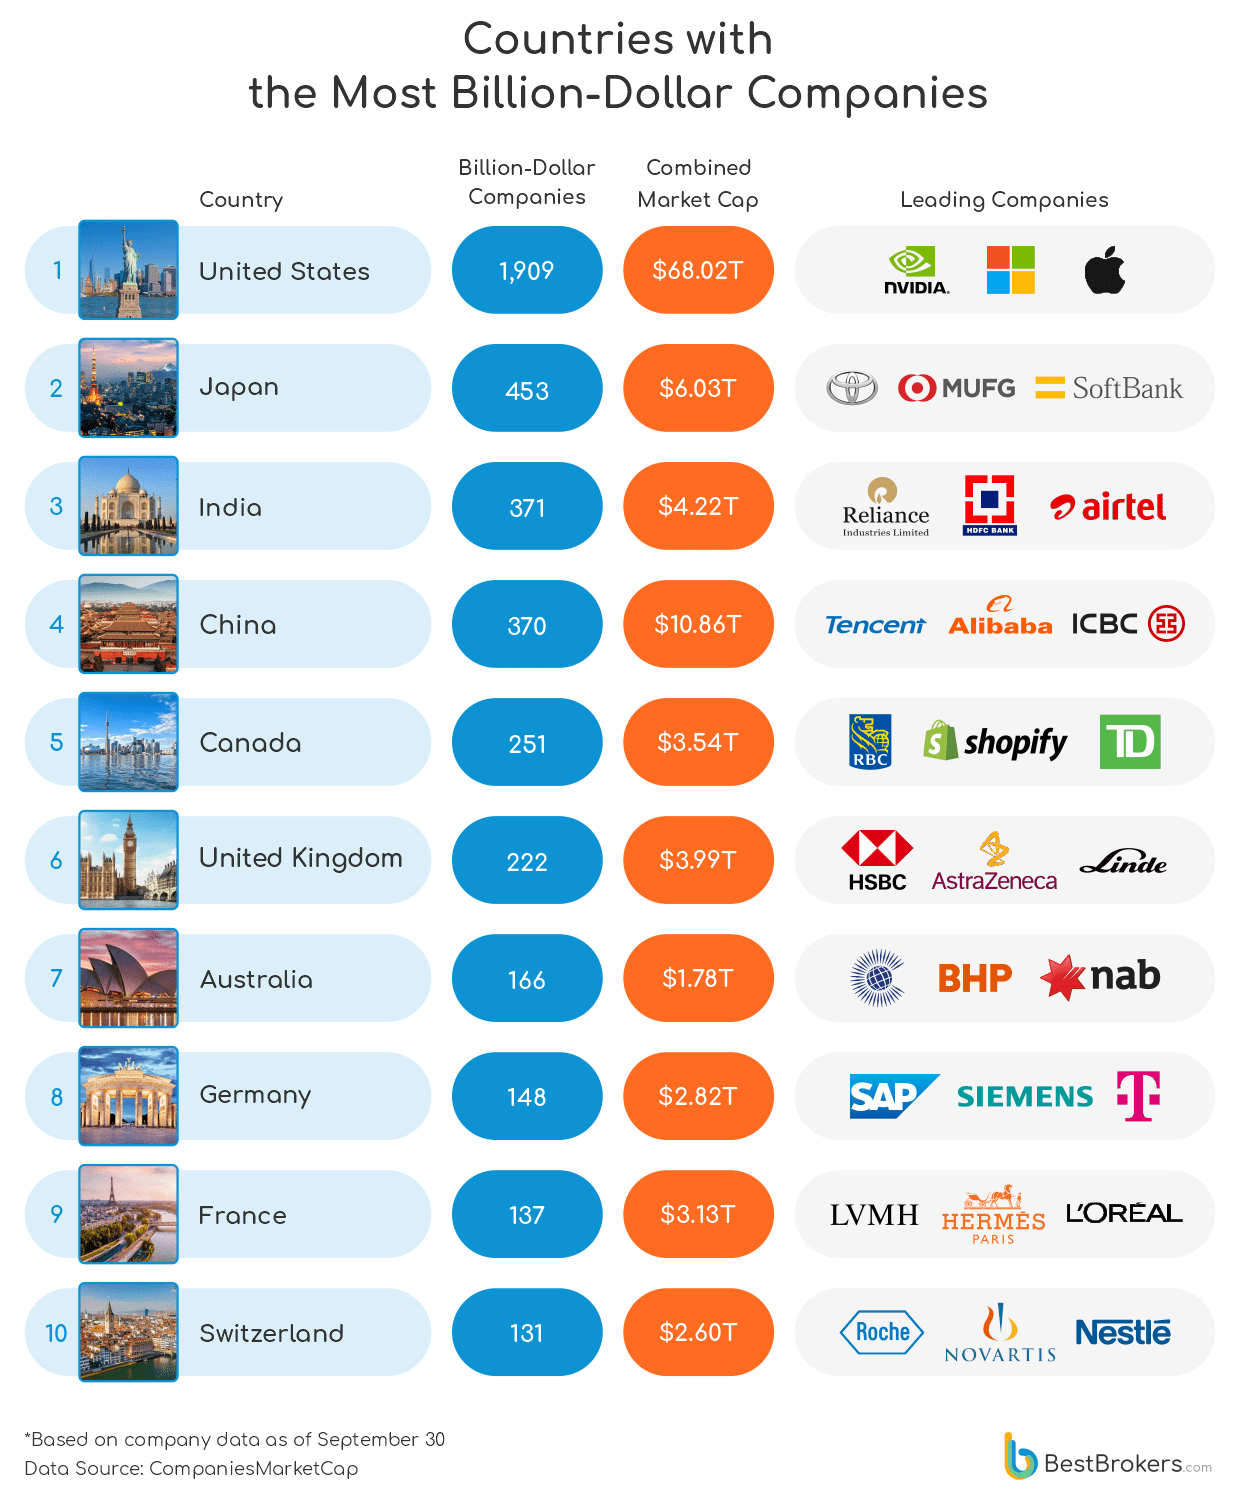
Out of all 5,623 public companies with a value of $1 billion or more, 1,909 are based in the United States. This means that one in every three public companies worth $1 billion or more worldwide is American. A clear indication of the dominant role of these companies on the global markets is their combined market cap, a massive $68.02 trillion. This is more than twice the projected size of the entire U.S. economy for 2025, the largest one in the world, with a nominal gross domestic product of $30.3 trillion for 2025. In 2024, the GDP was $29.18 trillion.
Tech giants, which have grown immensely over the past two decades, are among the largest players. Apple, Microsoft, NVIDIA, Meta, and Alphabet, along with the world’s largest retailer, Amazon, occupy the first places on the list of the world’s largest public companies and are expected to only increase their revenues and market share in the coming years. In fact, only two of the 10 largest corporations are not American, namely Saudi state oil producer Saudi Aramco and Taiwan’s semiconductor maker TSMC. If we take the top 20 largest companies, three are not based in the U.S. – along with Aramco and TSMC, the third one is China’s tech and gaming conglomerate, Tencent.
Despite 2025’s Economic Uncertainty, Companies Have Added $16.6 Trillion in Value
Global markets have added remarkable weight at the top. Between March and September, 5,323 publicly traded companies worth over $1 billion grew their combined market value by $16.62 trillion, a 15.7% surge in just six months. Tech titan NVIDIA alone accounted for $1.46 trillion of that gain, underscoring how a handful of firms continue to shape market momentum.
Yet the most dramatic percentage leap came from smaller players such as U.S.-based Ondas Holdings, whose valuation skyrocketed from $78 million to $2.7 billion – a staggering 3,196% rise that exemplifies the new wave of high-growth innovators redefining market dynamics. Another notable growth can be seen in Canadian mining company Barrick Gold, whose market capitalisation rose by 2,329.50% to over $58.8 billion.
The Number of Billion-Dollar Companies Relative to the Size of a Country
It should not be fair to compare small countries and their businesses to the massive companies operating in large economies such as the United States. To level the playing field, we can calculate the concentration of large-cap companies not only relative to the size of the population of the country but also relative to its territory. A high concentration of large-cap companies in certain areas makes those regions magnets for global investment.
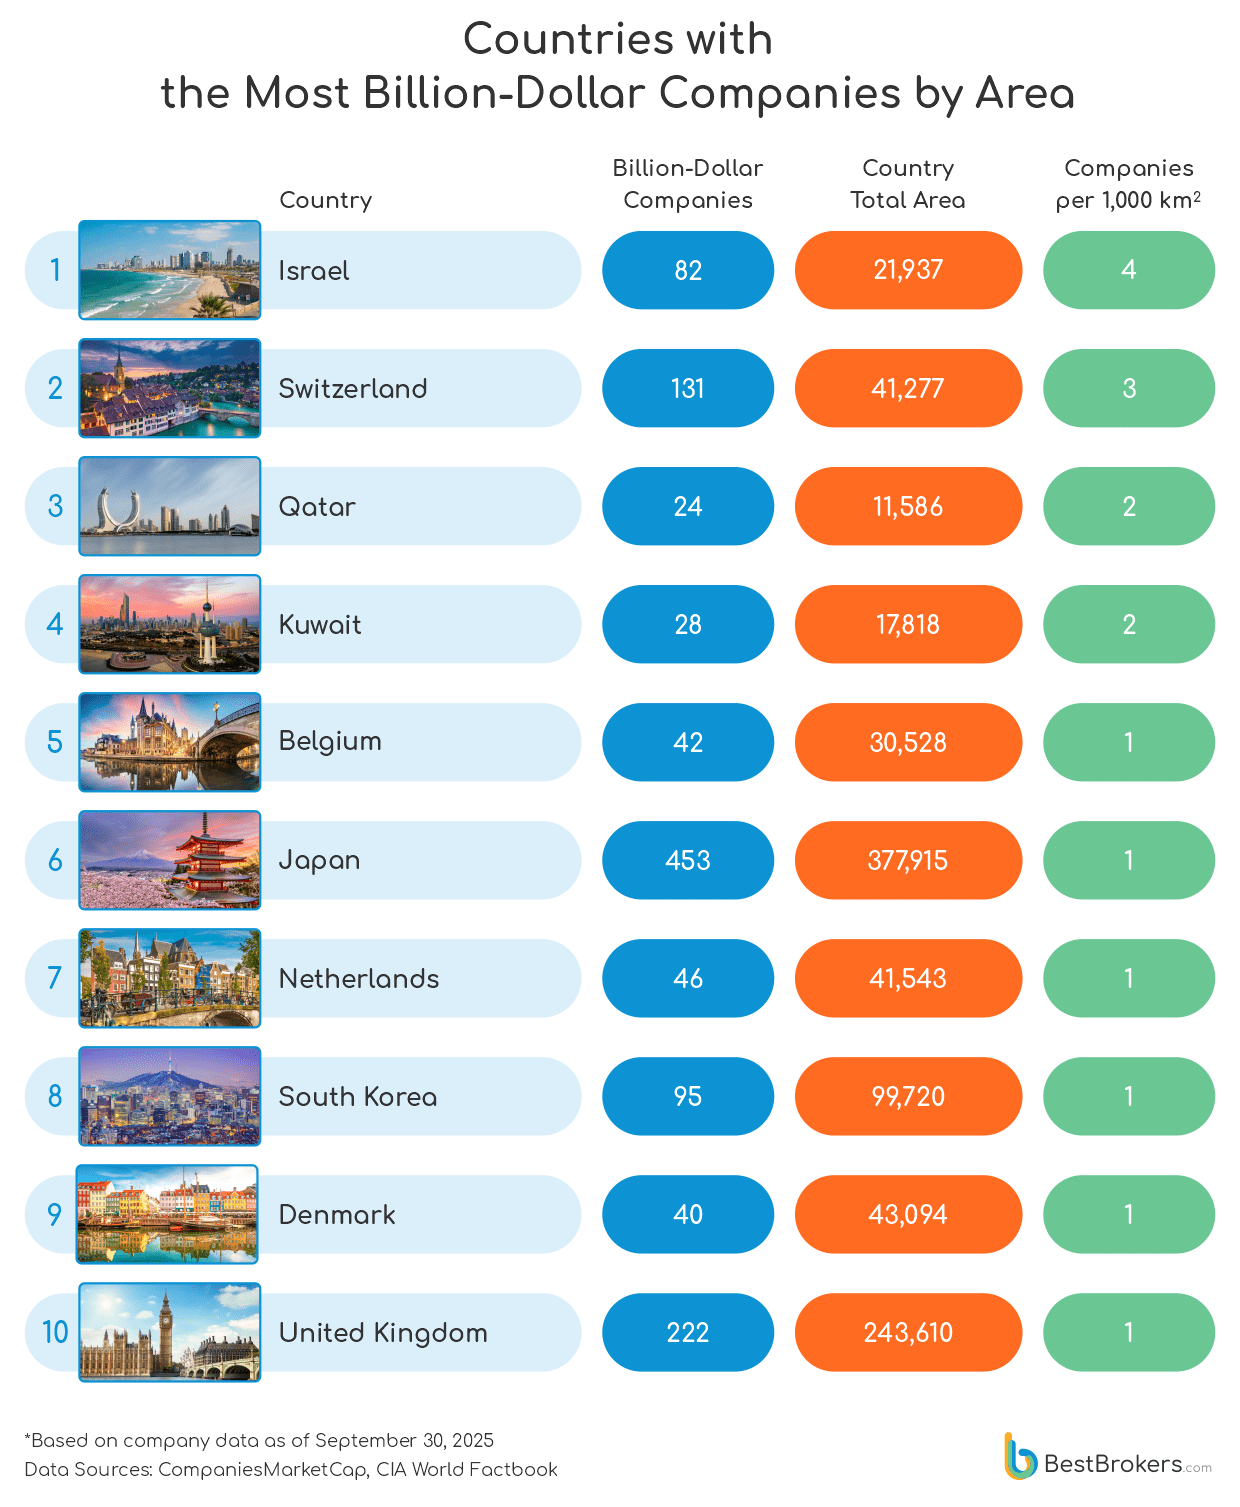
Several great examples of this can be seen in the list above, which ranks the ten countries with the highest density of billion-dollar companies or the number of companies per 1,000 square kilometres of their territory. Israel ranks first with its well-developed financial sector and its booming high-tech and defense industries that produce a remarkable concentration of billion-dollar firms across a small land area. Companies like Mobileye, Check Point, and Elbit Systems exemplify its innovation-driven economy.
With an average of 3.2 billion-dollar companies per 1,000 sq. km., Switzerland ranks 2nd. It is home to 131 large-cap businesses, which represent a mix of financial powerhouses, pharmaceutical giants such as Novartis and Roche, and iconic consumer brands including Nestlé and Garmin. Its corporate density reflects the country’s role as both a financial center and a global hub for research and industry.
The Gulf countries of Qatar and Kuwait follow in the 3rd and 4th positions. In Qatar, there are an average of 2.1 large-cap companies per 1,000 sq. km, whereas Kuwait has a slightly lower density of billion-dollar businesses at a ratio of 1.6. It seems like energy wealth has translated well into corporate concentration, but it will be interesting to see whether diversification (into finance, infrastructure, and services) can sustain this density once the oil and gas boom fades.
As large corporations are clustered in specific areas, this can fuel innovation, drive economic growth, and attract talent. At the same time, there is the risk of uneven distribution of opportunities and wealth, as well as the dangers of regions or entire regions relying on just a handful of large companies for their economic growth.
South Korea’s reliance on chaebols such as Samsung, Hyundai, and LG is a great example of this. These conglomerates dominate the country’s exports, employment, and innovation landscape, creating significant economic growth and global competitiveness. But because so much of South Korea’s economy is tied to a few corporate groups, downturns in their performance (or scandals affecting them) can ripple across the entire economy. Meanwhile, smaller businesses often struggle to compete, leading to an uneven distribution of opportunities and limiting broader economic diversity.
Billion-Dollar Companies Relative to the Economy
The concentration of large-cap companies relative to a country’s entire economy is also an interesting way to look at corporations’ strength in a country. It can show the economic structure and the market efficiency, as well as the various risks from countries’ dependence on a few major corporations or a particular sector. Once again, it is a good indicator (along with others) of whether the economy is diversified or overreliant and vulnerable to market shocks.
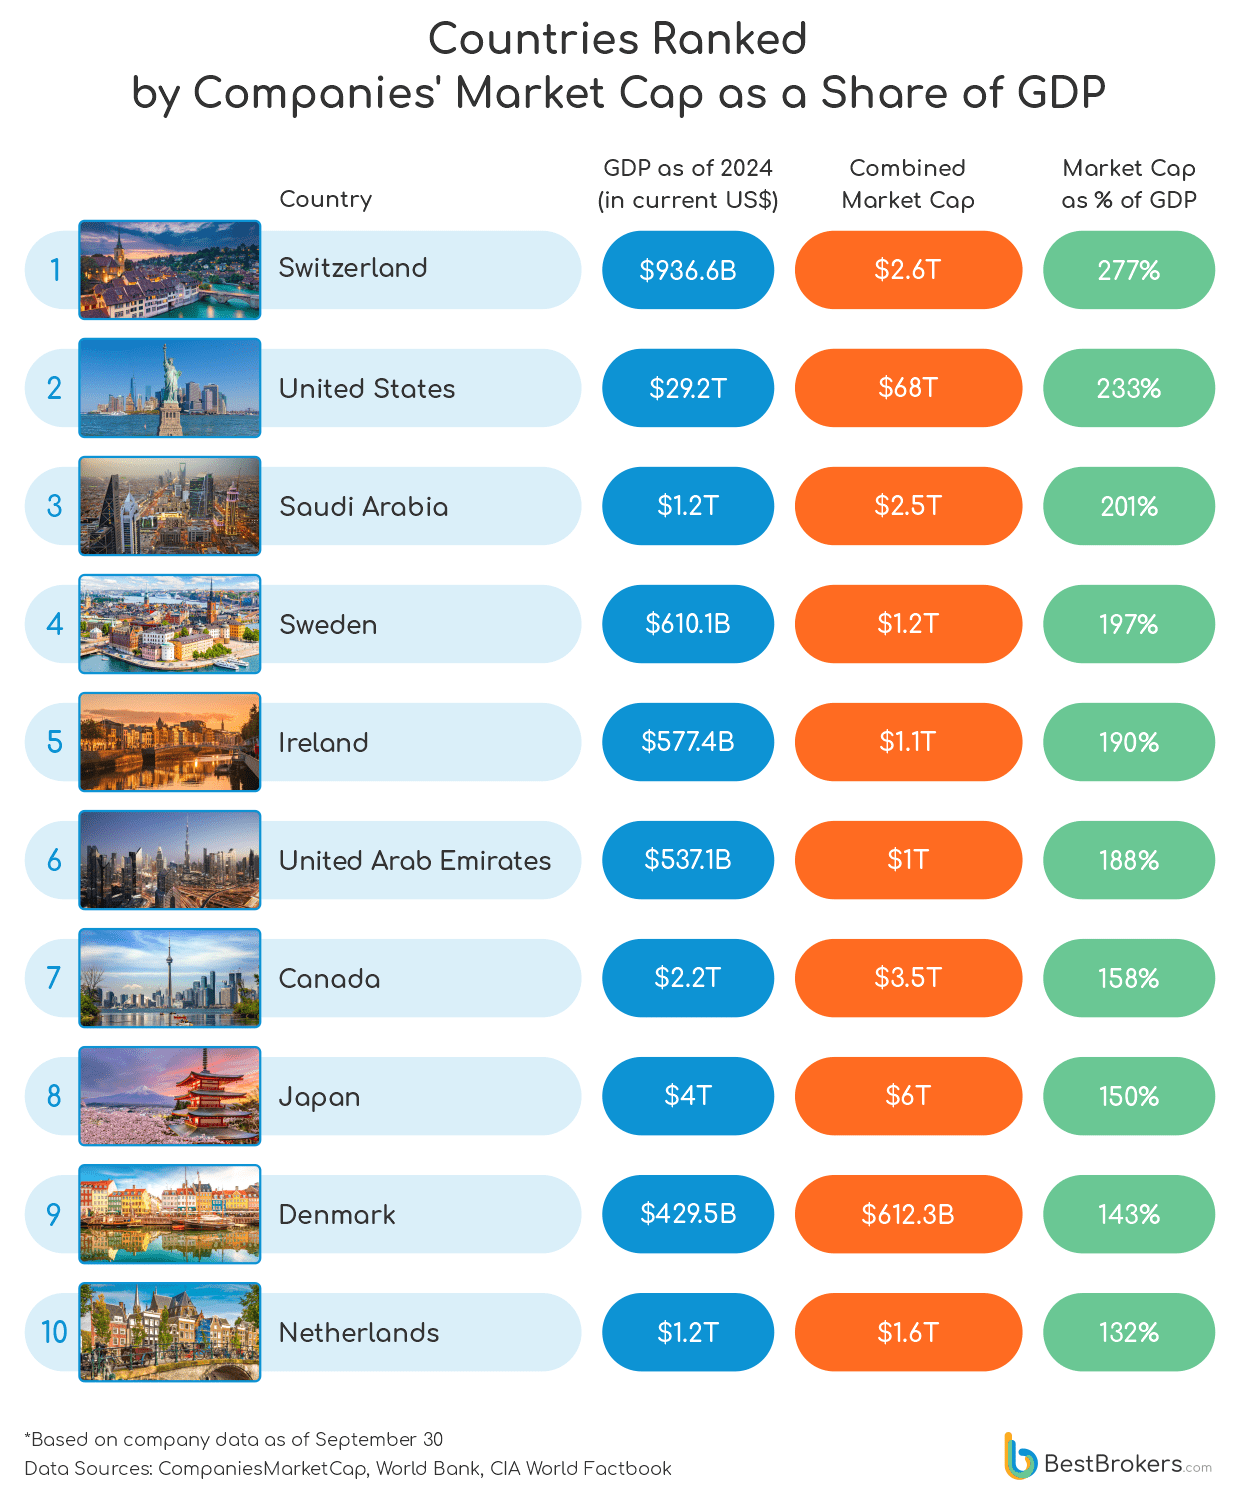
We calculated the combined market value of billion-dollar companies trading in every country as a percentage of these nations’ total output, i.e. their gross domestic product (GDP). This ratio is very similar to the so-called Buffett Indicator, which is used to assess the stock market.
What Is the Buffet Indicator?
It typically uses the total market capitalisation of all publicly traded companies within a country, which is then divided by the GDP. Higher ratios (above 120%-130%) suggest that the market is overvalued and a correction can be expected, whereas lower ratios (below 100%) show undervaluation of the companies and growth potential. It is similar to a price/sales valuation multiple but for an entire country, and it assesses markets by comparing them with a historical average.
Using this method, but counting only the listed companies with a market cap of $1 billion or more, we found out that in several countries, the value of the top companies is more than double the total output of their economies. These are Switzerland, the United States, and Saudi Arabia, where the combined market cap of the billion-dollar companies exceeds 200% of the GDP. We found another 11 nations where the aggregate market capitalisation of these companies is higher than the GDP (between 100% and 200% of it). Along with showing whether the aggregate market in a country is expensive or cheap, the indicator could be used to assess, along with other tools, how financialised an economy is. In other words, whether a country’s financial sector has increased in size and importance too much relative to its overall economy.
In highly financialised countries such as those we listed above, the economies have become dependent on financial activities and the growth of asset values. According to some economists, increased financialisation can make economies susceptible to crises such as the 2007-2008 financial crisis, which was related to, if not directly caused by, the greater importance of financial activities relative to non-financial economic activity and the use of overleverage and financial derivatives.
Final Thoughts
There is no single tool to showcase the importance and contributions of businesses to the economy. We can weigh by different metrics to make comparisons between countries but one thing is clear – absolute numbers favour the largest nations. This is why rankings such as billion-dollar companies per capita, by area or relative to the entire economy reveal different layers, different pictures of the same reality.
While the per-capita list showcases economies’ efficiency and potential for attracting talent and innovation, the concentration of billion-dollar companies by area can reveal how wealth, economic activity and opportunities are distributed over a territory. The list of companies’ aggregate capitalisation as а percentage of the GDP is also an interesting indicator, pointing to countries with well-developed financial sectors and stock markets.
However, it can also show the overreliance on financial services and the highly concentrated economies where a handful of massive corporations account for a significant portion of the total market. This is increasingly important at a time when most of the world’s wealth seems to be concentrated in the hands of just a few corporations and billionaires, while the middle class seems to be losing the assets it has earned over the past six or seven decades.
| Companies with the Most Billion-Dollar Companies per Capita | ||||
|---|---|---|---|---|
| Country | Companies with a market cap of US$1 billion or more | Combined market cap as of 30 September, 2025 | Population | Billion-dollar companies per 1 million people |
| Iceland | 6 | $11,004,675,014 | 387,558 | 15.48 |
| Switzerland | 131 | $2,598,484,790,923 | 8,870,561 | 14.77 |
| Sweden | 115 | $1,204,064,094,640 | 10,551,494 | 10.90 |
| Israel | 82 | $440,639,015,116 | 9,256,314 | 8.86 |
| Norway | 46 | $332,661,009,575 | 5,519,167 | 8.33 |
| Qatar | 24 | $171,815,834,413 | 2,979,082 | 8.06 |
| Ireland | 35 | $1,095,696,342,372 | 5,196,630 | 6.74 |
| Denmark | 40 | $612,344,002,233 | 5,948,136 | 6.72 |
| Canada | 251 | $3,538,514,948,054 | 39,299,105 | 6.39 |
| Australia | 166 | $1,784,339,712,316 | 26,451,124 | 6.28 |
| United Arab Emirates | 65 | $1,010,847,176,251 | 10,642,081 | 6.11 |
| Finland | 33 | $326,860,491,243 | 5,601,185 | 5.89 |
| Kuwait | 28 | $141,934,589,784 | 4,838,782 | 5.79 |
| United States | 1,909 | $68,020,479,844,564 | 343,477,335 | 5.56 |
| New Zealand | 24 | $105,015,352,337 | 5,172,836 | 4.64 |
| Japan | 453 | $6,028,331,936,132 | 124,370,947 | 3.64 |
| Belgium | 42 | $384,936,656,792 | 11,712,893 | 3.59 |
| United Kingdom | 222 | $3,992,246,455,943 | 68,682,962 | 3.23 |
| Saudi Arabia | 103 | $2,492,949,769,474 | 32,264,292 | 3.19 |
| Austria | 28 | $189,955,481,505 | 9,130,429 | 3.07 |
| Netherlands | 46 | $1,625,834,199,992 | 18,092,524 | 2.54 |
| France | 137 | $3,133,327,881,626 | 66,438,822 | 2.06 |
| Greece | 21 | $108,979,382,680 | 10,242,908 | 2.05 |
| South Korea | 95 | $1,567,116,792,584 | 51,748,739 | 1.84 |
| Germany | 148 | $2,818,301,576,477 | 84,548,231 | 1.75 |
| Italy | 84 | $1,092,564,936,495 | 59,499,453 | 1.41 |
| Oman | 7 | $16,252,123,505 | 5,049,269 | 1.39 |
| Spain | 61 | $1,153,130,345,842 | 47,911,579 | 1.27 |
| Portugal | 12 | $77,714,161,076 | 10,430,738 | 1.15 |
| Malaysia | 35 | $273,825,118,376 | 35,126,298 | 1.00 |
| Chile | 18 | $138,674,123,218 | 19,658,835 | 0.92 |
| Poland | 34 | $224,560,220,982 | 38,762,844 | 0.88 |
| Thailand | 52 | $374,821,542,498 | 71,702,435 | 0.73 |
| South Africa | 42 | $373,341,162,625 | 63,212,384 | 0.66 |
| Uruguay | 2 | $5,731,174,784 | 3,388,081 | 0.59 |
| Turkiye | 36 | $220,975,855,223 | 87,270,501 | 0.41 |
| Czech Republic | 4 | $49,420,218,906 | 10,809,716 | 0.37 |
| Lithuania | 1 | $1,175,963,871 | 2,854,099 | 0.35 |
| Vietnam | 35 | $156,748,758,243 | 100,352,192 | 0.35 |
| Hungary | 3 | $34,276,161,526 | 9,686,463 | 0.31 |
| Brazil | 61 | $844,761,995,236 | 211,140,729 | 0.29 |
| Argentina | 13 | $166,219,699,596 | 45,538,401 | 0.29 |
| China | 370 | $10,857,370,115,325 | 1,422,584,933 | 0.26 |
| India | 371 | $4,217,778,899,633 | 1,438,069,596 | 0.26 |
| Mexico | 30 | $461,052,010,186 | 129,739,759 | 0.23 |
| Romania | 4 | $29,016,289,574 | 19,118,479 | 0.21 |
| Kazakhstan | 4 | $48,326,817,910 | 20,330,104 | 0.20 |
| Indonesia | 39 | $399,643,963,333 | 281,190,067 | 0.14 |
| Philippines | 14 | $115,530,746,480 | 114,891,199 | 0.12 |
| Cambodia | 2 | $2,559,177,750 | 17,423,880 | 0.11 |
| Russia | 14 | $379,888,242,542 | 145,440,500 | 0.10 |
| Jordan | 1 | $1,008,585,536 | 11,439,213 | 0.09 |
| Colombia | 4 | $40,656,744,448 | 52,321,152 | 0.08 |
| Pakistan | 16 | $32,624,024,833 | 247,504,495 | 0.06 |
| Peru | 2 | $10,652,093,440 | 33,845,617 | 0.06 |
| Egypt | 1 | $6,254,094,437 | 114,535,772 | 0.01 |
| Nigeria | 1 | $1,575,180,285 | 227,882,945 | 0.004 |