
In a time when billionaires are setting new records and millionaire status is no longer the exclusive club it once was, the gap between the ultra-rich and everyone else is stretching to the extreme. With Elon Musk’s net worth recently ballooning to over $840 billion, wealth at the very top is now measured in the hundreds of billions and may soon hit a trillion dollars, a mind-boggling amount of money to be owned by any one individual.
At the same time, millions of Americans quietly cross into the top 1% based on income alone. But what does it actually take, in real dollars, to join that elite slice of earners? The team at BestBrokers dived deep into the latest statistics from the Internal Revenue Service and the U.S. Bureau of Statistics to identify the minimum annual income Americans need to earn to be considered part of the top 1% in their state in 2026. It depends, it seems, on the specific location, with individuals in some states needing to earn just over $420,000 a year to join the top 1% bracket, whereas in others, you need to make upwards of a million to make the cut.
Key Findings:
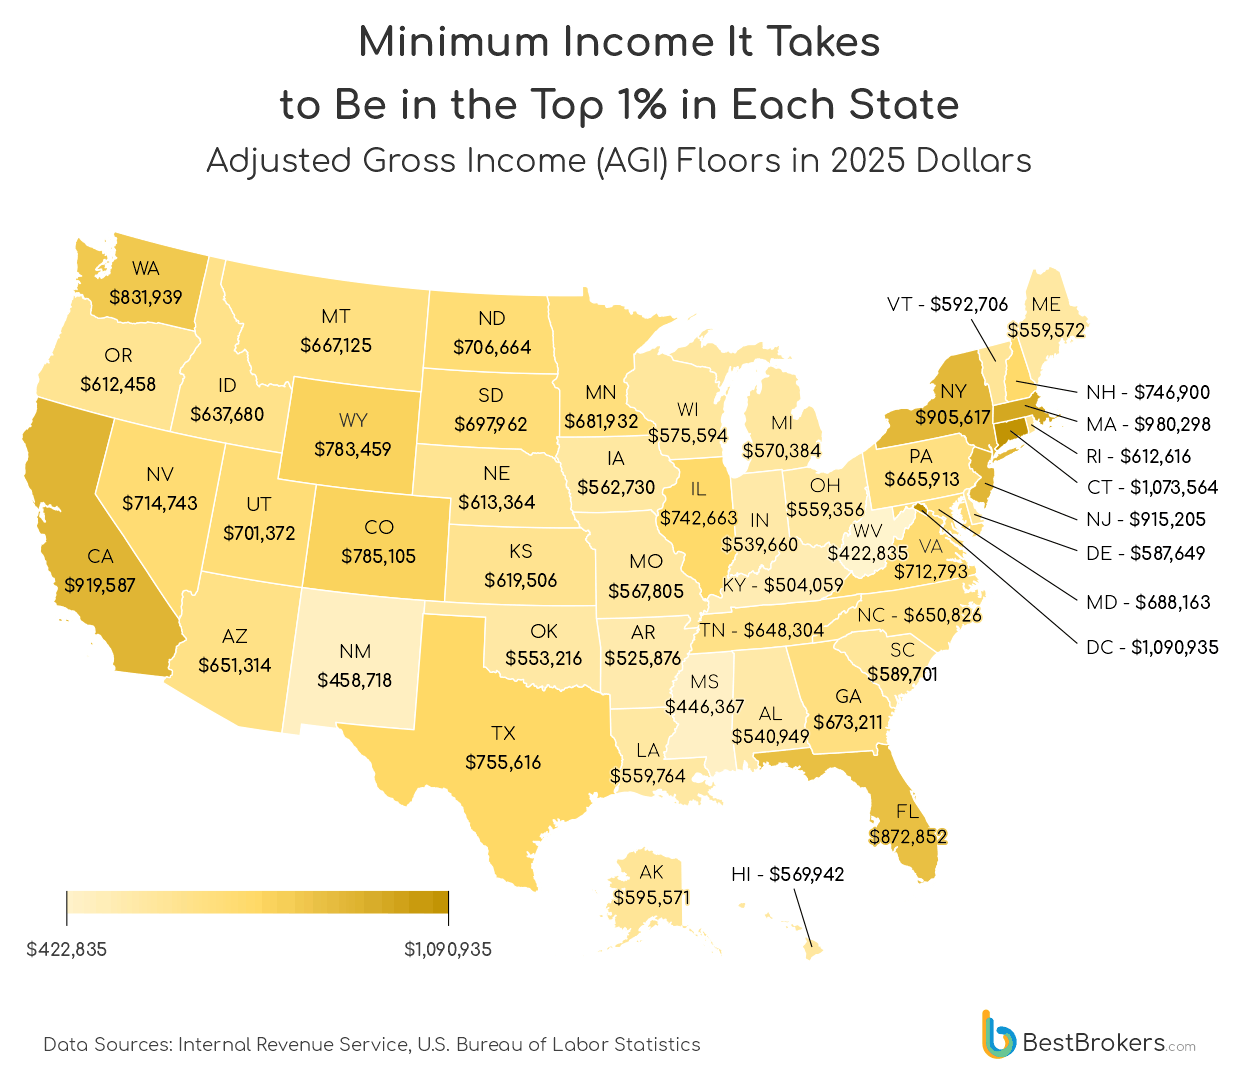
- In 2026, more than 1.5 million households in the United States earn enough income to be considered among the richest 1% of Americans. On average, they need an annual income of $742,957 to be considered part of that elite club.
- Residents in three states need to have earned below half a million dollars in tax year 2025 to join the top 1% bracket – the threshold is just $422,835 in West Virginia, it is $458,718 in New Mexico, and in Mississippi, it is $446,367.
- The highest thresholds for entering the top 1% are in the District of Columbia – $1,090,935 a year, and in Connecticut – $1,073,564, making the top 1% earners in these states practically millionaires.
What qualifies as the top 1%?
Making the top 1% is more than just about a headline salary. These rankings are based on income, measured using adjusted gross income (AGI), which includes wages, bonuses, business income, interest, dividends, and some capital gains – but not total net worth. Filing status also matters: a single filer and a married couple can face very different thresholds. On top of that, one-off windfalls, stock sales, and business exits can temporarily push taxpayers into the 1% club. The result is a moving target, where industry mix, investment activity, and local economies all shape how high the bar is in each state.
Across the U.S., the average income needed to break into the top 1% now stands at $742,957. That figure has climbed steadily in recent years, reflecting a combination of strong wage growth at the top, booming investment income, and a surge in high-paying industries such as tech, finance, and professional services. While inflation has lifted incomes across the board, gains at the very top have outpaced the rest, pushing the price of entry into the 1% club steadily higher.
Meanwhile, the minimum annual income to enter the richest 5% earners is now $291,619, on average, ranging from around $198,000 in Mississippi to $419,000 in the District of Columbia.
Location, location, location
Famously originating in real estate, the mantra ‘location, location, location’ is also valid in wealth and personal finance – here, as well as in selling property, context and placement are main drivers of success. Where you live can add or shave hundreds of thousands of dollars off what it takes to be in the top 1%.
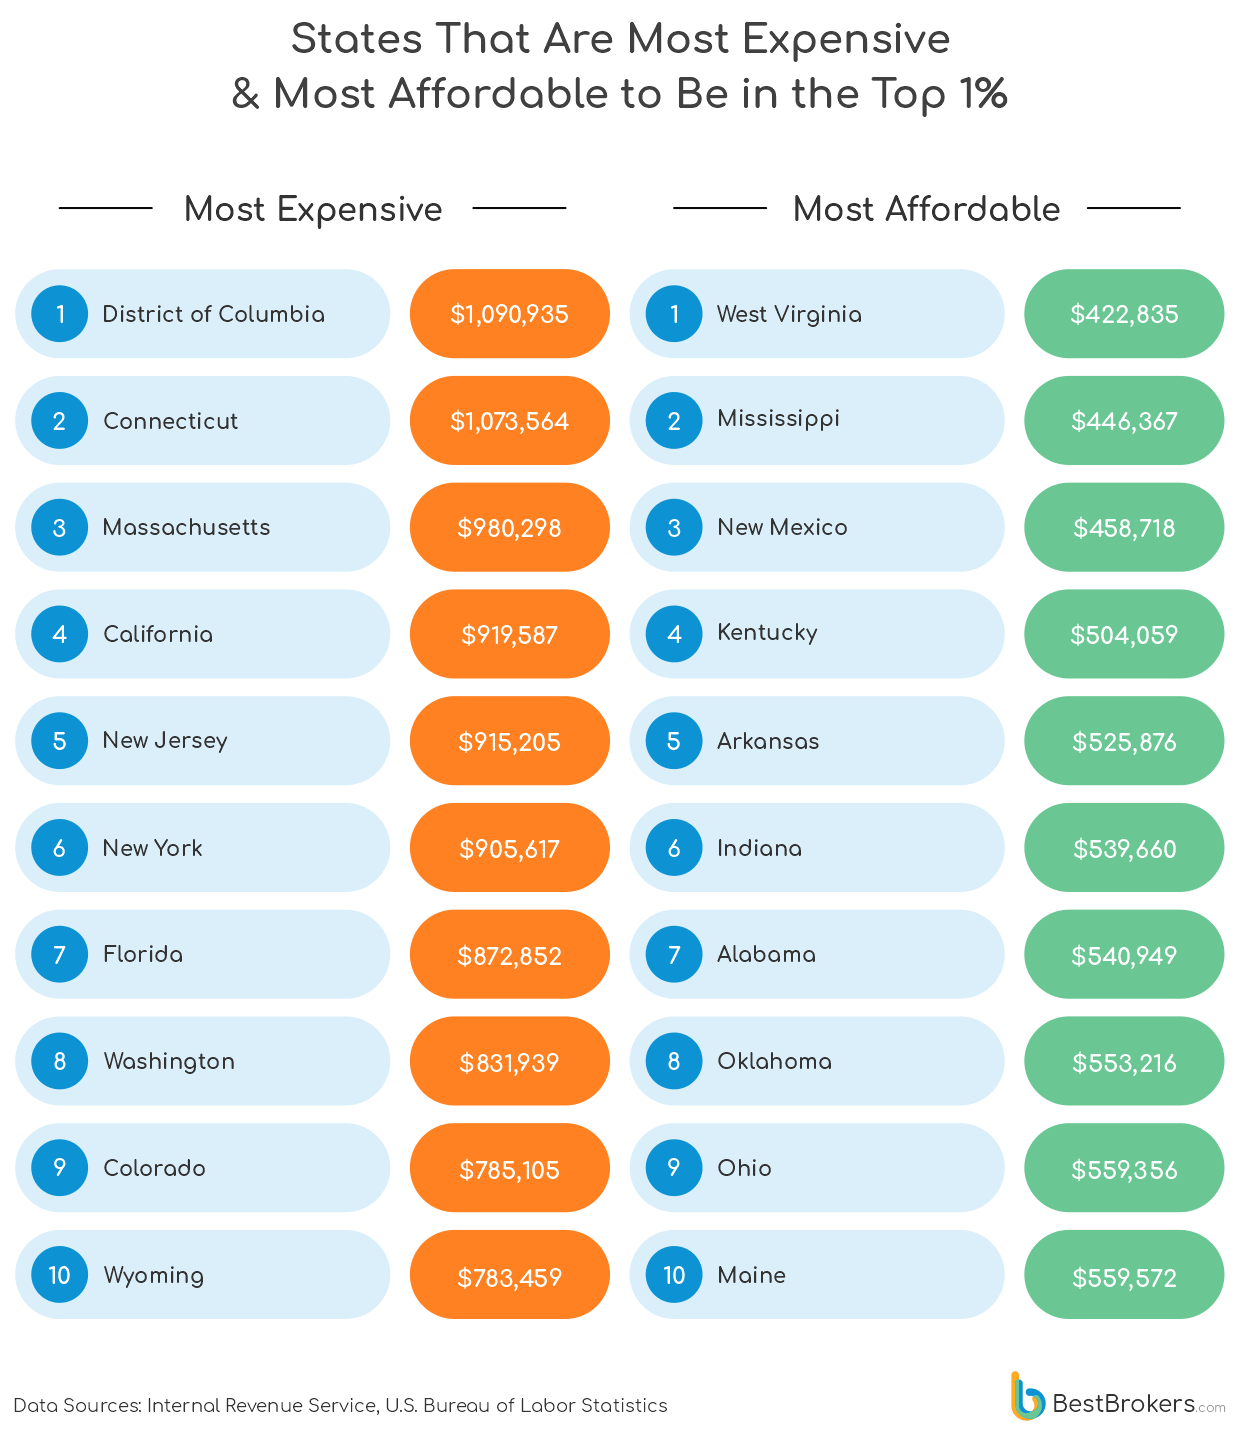
At the very top, the District of Columbia ($1.09 million) and Connecticut ($1.07 million) lead the country, followed closely by Massachusetts ($980,298). D.C., a compact federal district, functions like a hyper-concentrated urban core with a sizable upper class and the highest average income in the country. Connecticut and Massachusetts, despite having rural, lower-income areas, on the other hand, are also wealth hubs with enough millionaires to lift the elite threshold for everyone else.
Major economic hubs also dominate: California ($919,587), New Jersey ($915,205), and New York ($905,617) all require roughly $900,000 or more to crack the top tier. Hardly surprising, fast-growing and tax-friendly states such as Florida ($872,852) and Washington ($831,939) follow with their strong influx of wealth over the past decade or so.
In several states, the bar is set far lower – in West Virginia ($422,835), Mississippi ($446,367), and New Mexico ($458,718), earning under half a million dollars is enough to place you among the state’s top 1%. Apparently, the definition of “rich” has become uneven across the country. Financial, technology, and government hubs have pushed up the top-end in coastal metropolises, while smaller economies keep thresholds lower across much of the Midwest and South.
Of course, a top 1% income does not buy the same lifestyle everywhere. In places like New York, California, and D.C., housing, taxes, and everyday costs can quickly eat into even a seven-figure income. In lower-cost states, a much smaller top-tier income can stretch significantly further, translating into larger homes, lower taxes, and greater disposable income. In real terms, ‘top 1%’ status can feel very different depending on the local price tag.
Where Are America’s Top 1% Earners Concentrated the Most?
The top 1% bracket is mostly populated by a mix of high earners and asset owners: tech founders and executives, finance and investment professionals, senior corporate leaders, medical specialists, successful entrepreneurs, and individuals with substantial investment or business income. One-off events such as selling a company or exercising stock options can also temporarily push people into the top bracket. The states with the most sizable populations of top 1% earners are California (175,045), Texas (128,130), Florida (105,101), and New York (91,840): hardly surprising since these are the most populous states. The density of wealthy individuals relative to population, however, is a more telling metric.
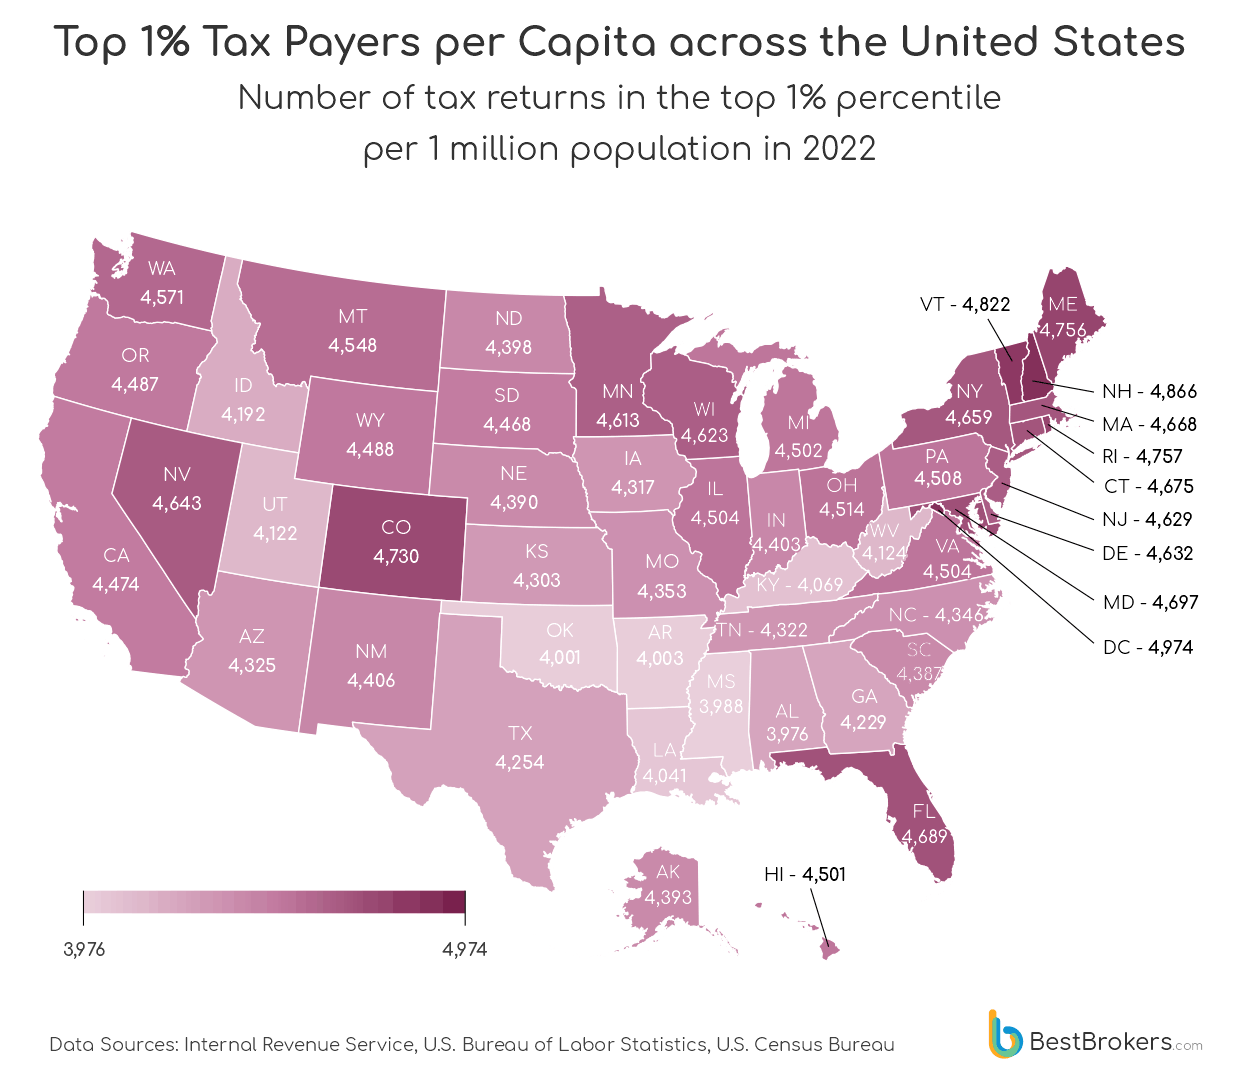
While income thresholds reveal how hard it is to enter the top 1%, per-capita concentration shows how common top earners actually are within a state’s population. For this calculation, we used the number of top-1% tax returns per one million residents. Even with 2022 data (the latest figures from the IRS), it illustrates how densely high-income earners are clustered geographically.
States like Washington, New York, Massachusetts, Maryland, and New Jersey all post elevated concentrations, reflecting well-developed ecosystems of finance, tech, government, healthcare, and professional services. The District of Columbia, with the highest concentration at around 4,974 1% households per million residents, stands out as a unique case, driven by senior government, legal, lobbying, and consulting income. Smaller, high-income states such as New Hampshire, Vermont, and Maine also rank high, due to the investment income they are associated with, as well as the many retirees with high AGI, and smaller population bases that magnify the ratio. Speaking of retirees, Florida, a longtime popular destination for retired individuals for its warm climate, no state income tax, extensive coastline and a huge number of retirement communities, also has a relatively high concentration of top 1% earners – an average of 4,689 per million population.
By contrast, states such as Alabama, Mississippi, Arkansas, and West Virginia show lower density, indicating fewer top earners relative to population, even if the income bar itself is also lower. The differences in per capita concentration are hard to ignore – they show not just the states where it is expensive or cheap to be rich, but also the states that actually host dense clusters of high earners. Of course, this is not a perfect proxy for “rich people” (it measures income, not net worth), but it is a strong indicator of where top-tier earning power is most concentrated and where economic influence is likely to be most geographically concentrated as well.
Methodology
Figures are based on state-level estimates of income thresholds to enter the top 1%, using adjusted gross income (AGI) and percentile floors from the Internal Revenue Service (IRS). Since the most recent data is from 2022, the team at BestBrokers adjusted the percentile floors to current dollars by taking into account the average annual inflation from 2022 to 2025. These income thresholds reflect the annual income that tax filers need to have earned during 2025 (taxable in 2026).
Thresholds vary by filing status, income composition, and year of data, but for consistency, we used the total numbers. Results reflect income, not net worth, and may be influenced by one-time capital gains, business sales, and investment activity. Values are estimates and should be interpreted as indicative rather than exact cutoffs.
Sources: