
Financial life is less a straight line than a winding road. Income rises, mortgages replace student loans, and eventually the size of a paycheck can matter less than what remains after taxes. Each generation travels a slightly different version of that road – shaped by the ongoing economic situation, the age at which they entered adulthood, the financial burdens they carry, and the opportunities available to them. Some move up the income ladder faster, some carry larger debts for longer, and some find that the distance between earning money and keeping it can be surprisingly wide.
To see how these differences play out in real numbers, the team at BestBrokers analyzed 2025 data from the U.S. Census Bureau and Experian on average annual earnings across generations, thе distribution across income brackets, and the types and balances of consumer debt they carry. We also examined how taxes affect take-home pay across age groups, how earnings vary by educational attainment, and how the incomes of women and men in the U.S. have changed over the past six decades.
We found that the fortunes of a generation cannot be measured by income alone – Gen X households have the highest average income at $160,448, but older generations hold some of the largest debt balances. Education remains a powerful dividing line, with households headed by someone with a bachelor’s degree or higher earning nearly four times the income of those without a high school diploma. And while women have steadily narrowed the earnings gap with men over six decades, they earned 83.9 cents for every dollar received by men in 2025.
Key Takeaways:
- Gen X earns the most, averaging $160,448 per year before tax.
- Baby Boomers carry the most debt at $579,650, leading in five of six debt types.
- Taxes bite hardest at age 45-54, reducing median income by 17.54%.
- Education pays, the gender gap narrows: degree holders reach $138,300 in annual income, while women’s earnings rose from 59.9% to 83.9% of men’s since 1965.
Americans reach their income peak in their late 40s – then the numbers turn
There is a quiet rhythm to the numbers: income gathers momentum through the first decades of adult life, rising from $80,990 among 15-24-year-olds to $131,900 by 30-34, before reaching its high point of $166,000 among 45-49-year-olds. The climb is not merely gradual – the biggest gains come as Americans move from their 20s into established careers, with average income rising by more than $85,000 between the youngest and peak age groups. Then the curve turns. At 60-64, income has fallen to $154,300; by 70-74 it is down to $96,470, and among those aged 75 and over, it reaches just $78,940.
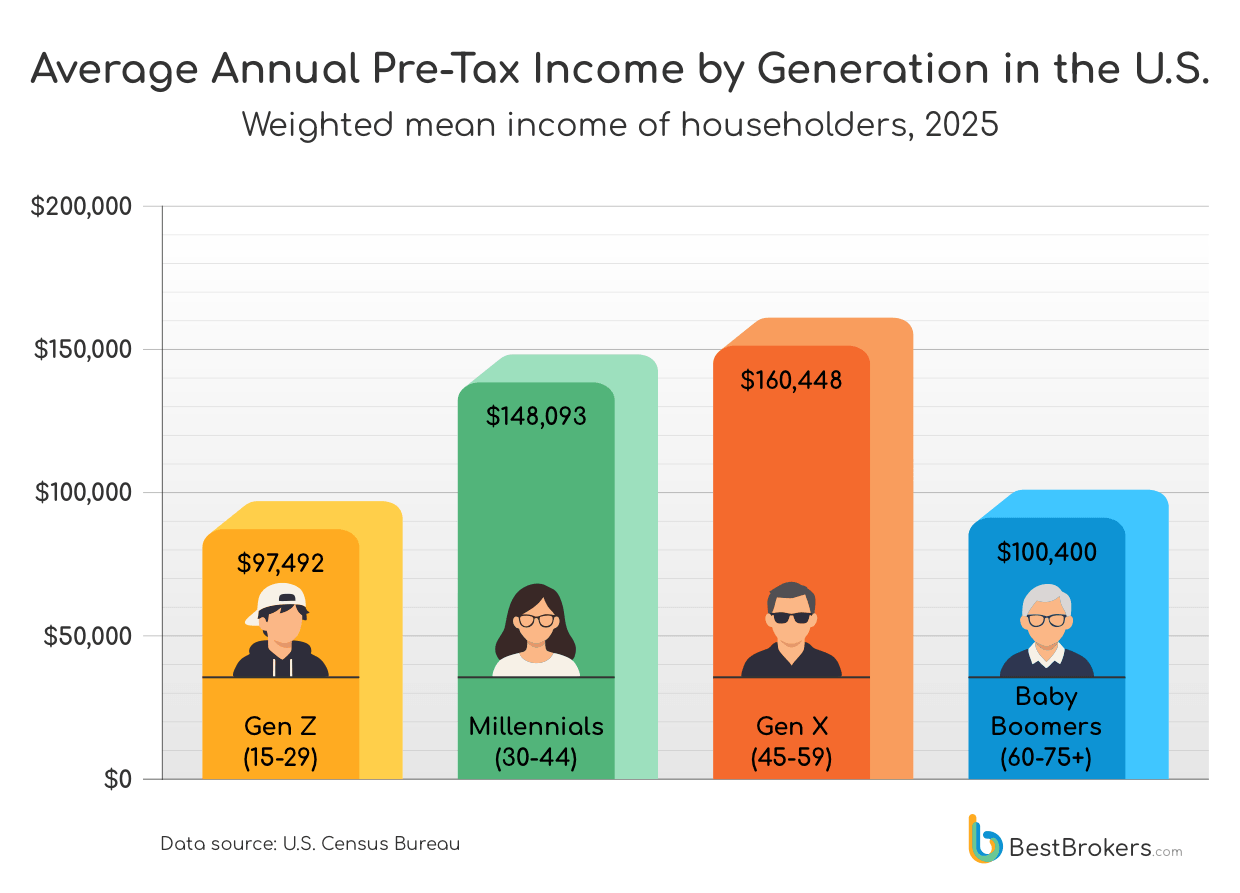
The generational figures give that arc a human shape – Gen X occupies much of those peak earning years, has a weighted mean household income of $160,448, compared with $148,093 for Millennials and $97,492 for Gen Z. Yet the story does not end at the summit: Baby Boomers and older householders average $100,400 in annual earnings before taxes, almost $60,000 below Gen X. It suggests that income is less a steady ascent than a hill to be climbed – with the steepest rise coming through early and mid-career, a high ridge around late 40s and 50s, and a gradual decline as Americans move into retirement.
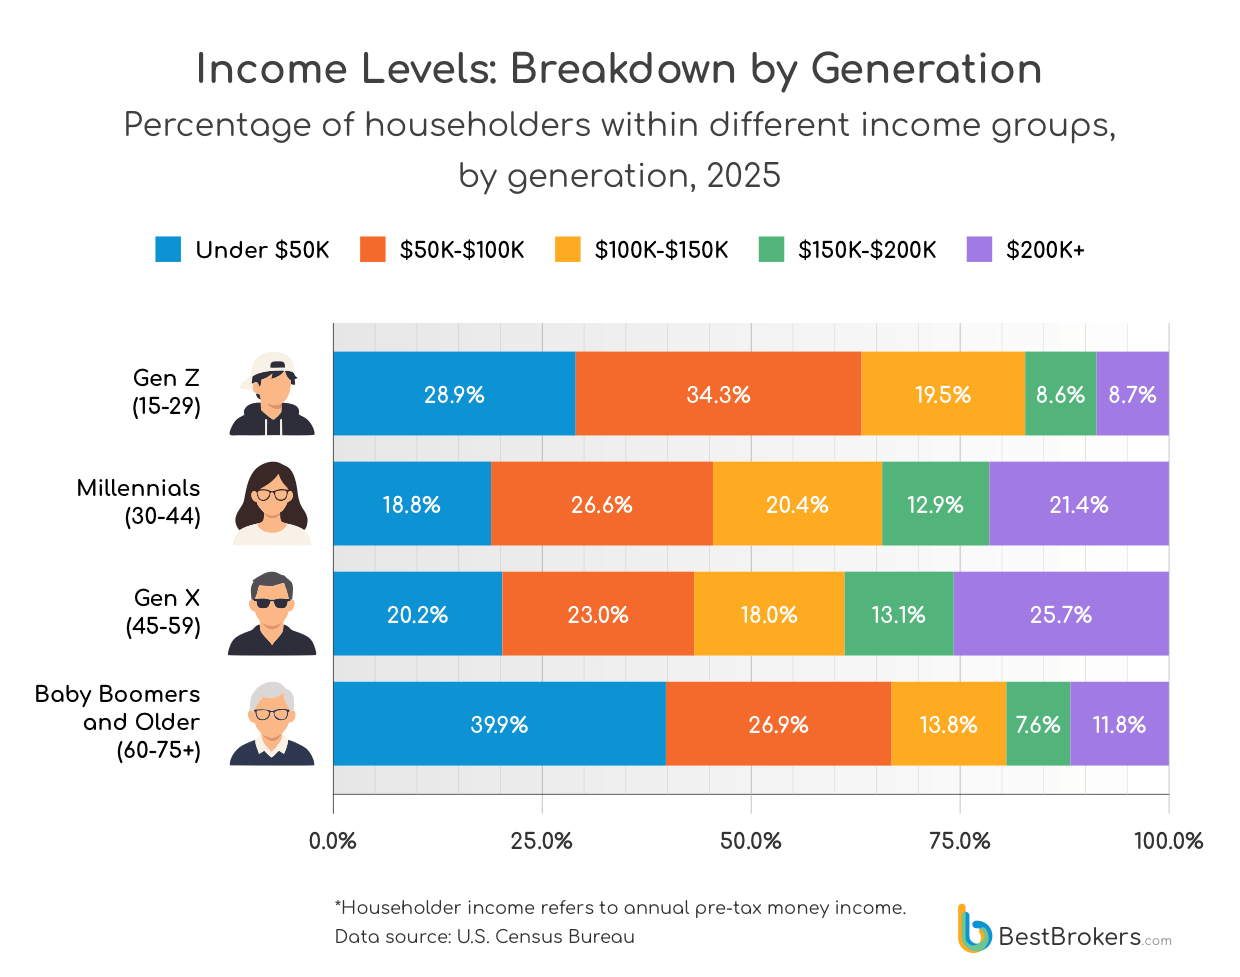
For Gen Z, the most common landing point is the $50,000-$99,999 bracket, home to 34.3% of householders within that age group, while only 8.7% make $200,000 or more. Millennials begin to move further up the ladder, with 21.4% already reaching the $200,000 mark. Gen X pushes furthest into the upper end: more than one in four householders (25.7%) earn $200,000 or more, the largest share of any generation. Older Americans are far more concentrated in the lower income brackets. Nearly four in ten Baby Boomer and older householders (39.9%) earn under $50,000 – roughly twice the share seen among Gen X and Millennials.
How American debt changes from Gen Z to retirement
Debt changes shape as Americans move through life. For Gen Z, borrowing is still largely tied to the early stages of adulthood: 40.9% have an auto loan, 26.5% have a personal loan, and 15.3% carry student debt. By the time Americans reach the Millennial years, mortgages become much more common, with 36.8% carrying at least one, alongside larger average balances across almost every type of debt. Gen X moves further into the world of homeownership and established finances, with 53.6% carrying a mortgage and 71.3% an auto loan.
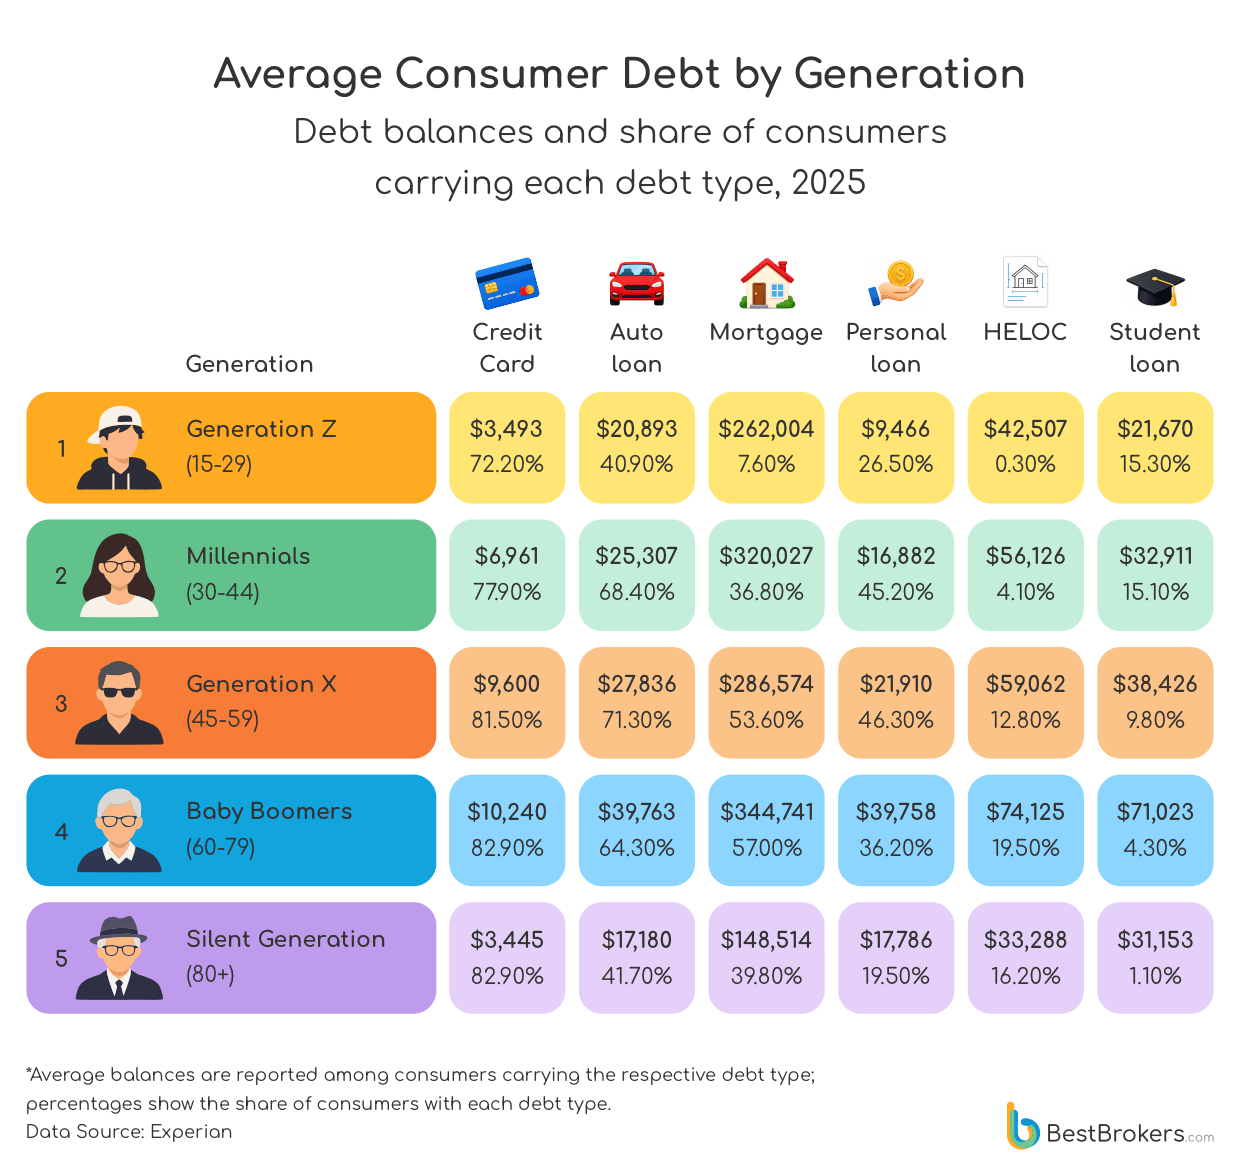
Among older age groups, the numbers become larger even as the nature of borrowing shifts. Baby Boomers carry an average mortgage of $344,741 and an average HELOC balance of $74,125 – the highest figures among all generations – while their average credit card balance reaches $10,240. Student debt, meanwhile, almost disappears with age: 15.3% of Gen Z and 15.1% of Millennials carry it, compared with just 4.3% of Baby Boomers and 1.1% of representatives of the Silent Generation. The result is a financial timeline that feels familiar: early adulthood brings student loans and first car payments, the middle years add mortgages and larger credit card balances, and later life shifts borrowing increasingly toward home equity.
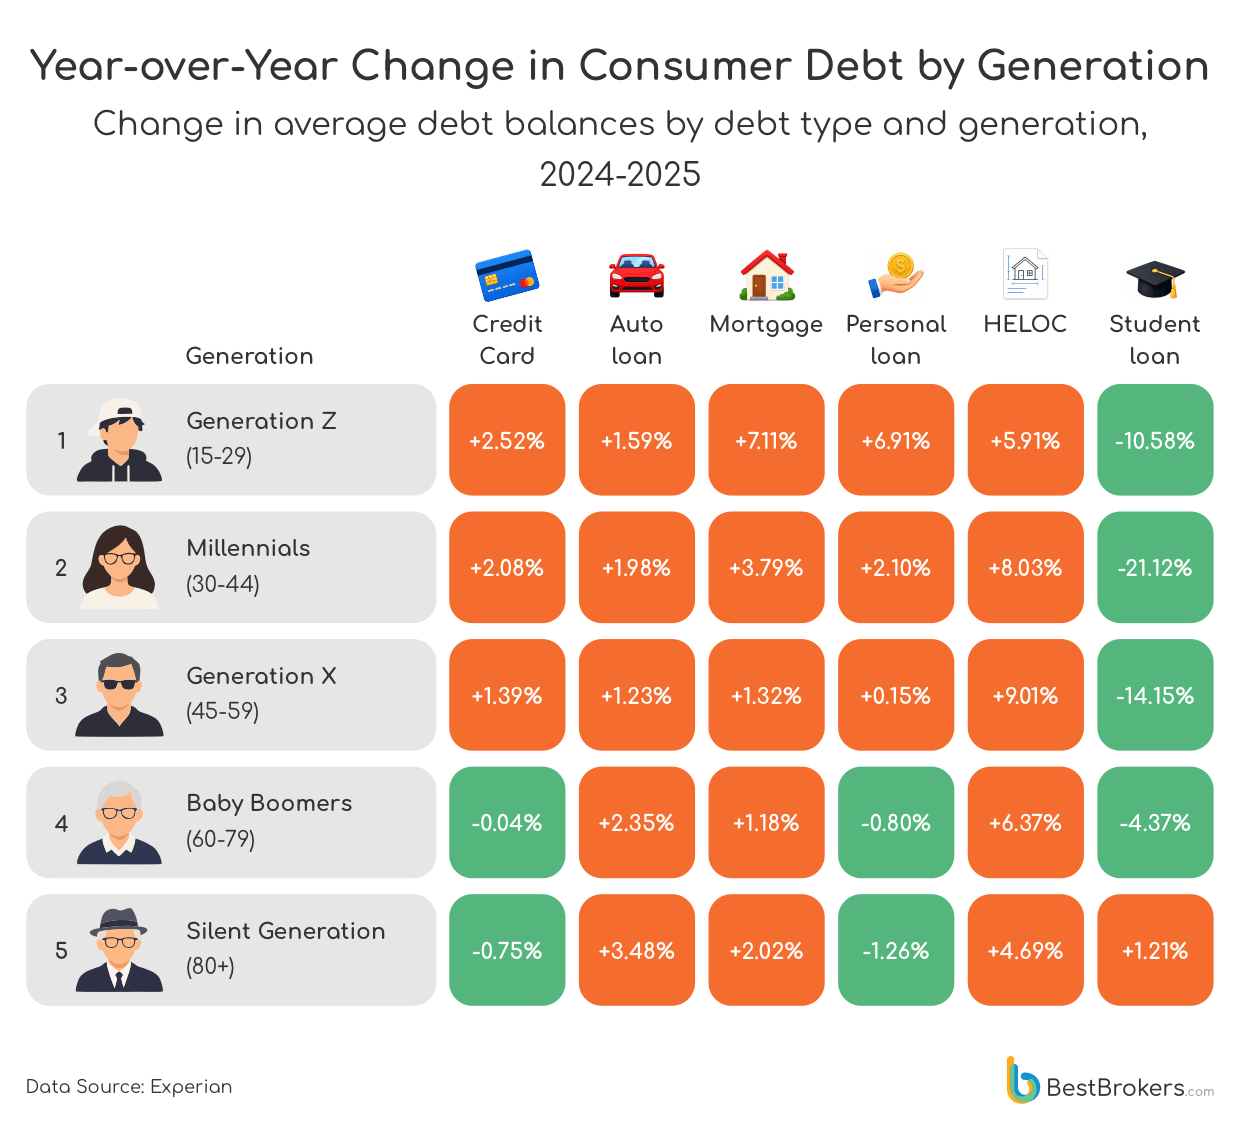
Younger generations are seeing some of the fastest increases in mortgages and personal loans: Gen Z’s average mortgage balance rose 7.11% and its personal loan balance 6.91% in a single year. Among Millennials and Gen X, however, the strongest growth is in HELOC balances, up 8.03% and 9.01% respectively, suggesting that borrowing against existing home equity becomes increasingly prominent further into adulthood. At the same time, student loan balances fell by 10.58% for Gen Z, 21.12% for Millennials and 14.15% for Gen X, but edged up 1.21% for the Silent Generation – an unusual reversal that stands apart from the declines recorded among the younger cohorts. Overall, the data shows a clear change in the type of borrowing that is growing as Americans move through different stages of their financial lives.
The age when American income loses the most to tax
The more lucrative years of working life come with a paradox: the paycheck grows, but so does the share that never makes it into the household budget. Median income rises from $60,870 before tax among 15-24-year-olds to $94,880 for 25-34-year-olds (spanning older Gen Z and younger Millennials), but the share lost to taxes jumps from 11.93% to 16.95%. It reaches its widest point at 45-54, when median income is at its highest at $120,100, but 17.54% is taken before that money reaches the bank account. The result is an intriguing twist in the income curve: the years that bring the biggest paychecks also bring the largest proportional reduction.
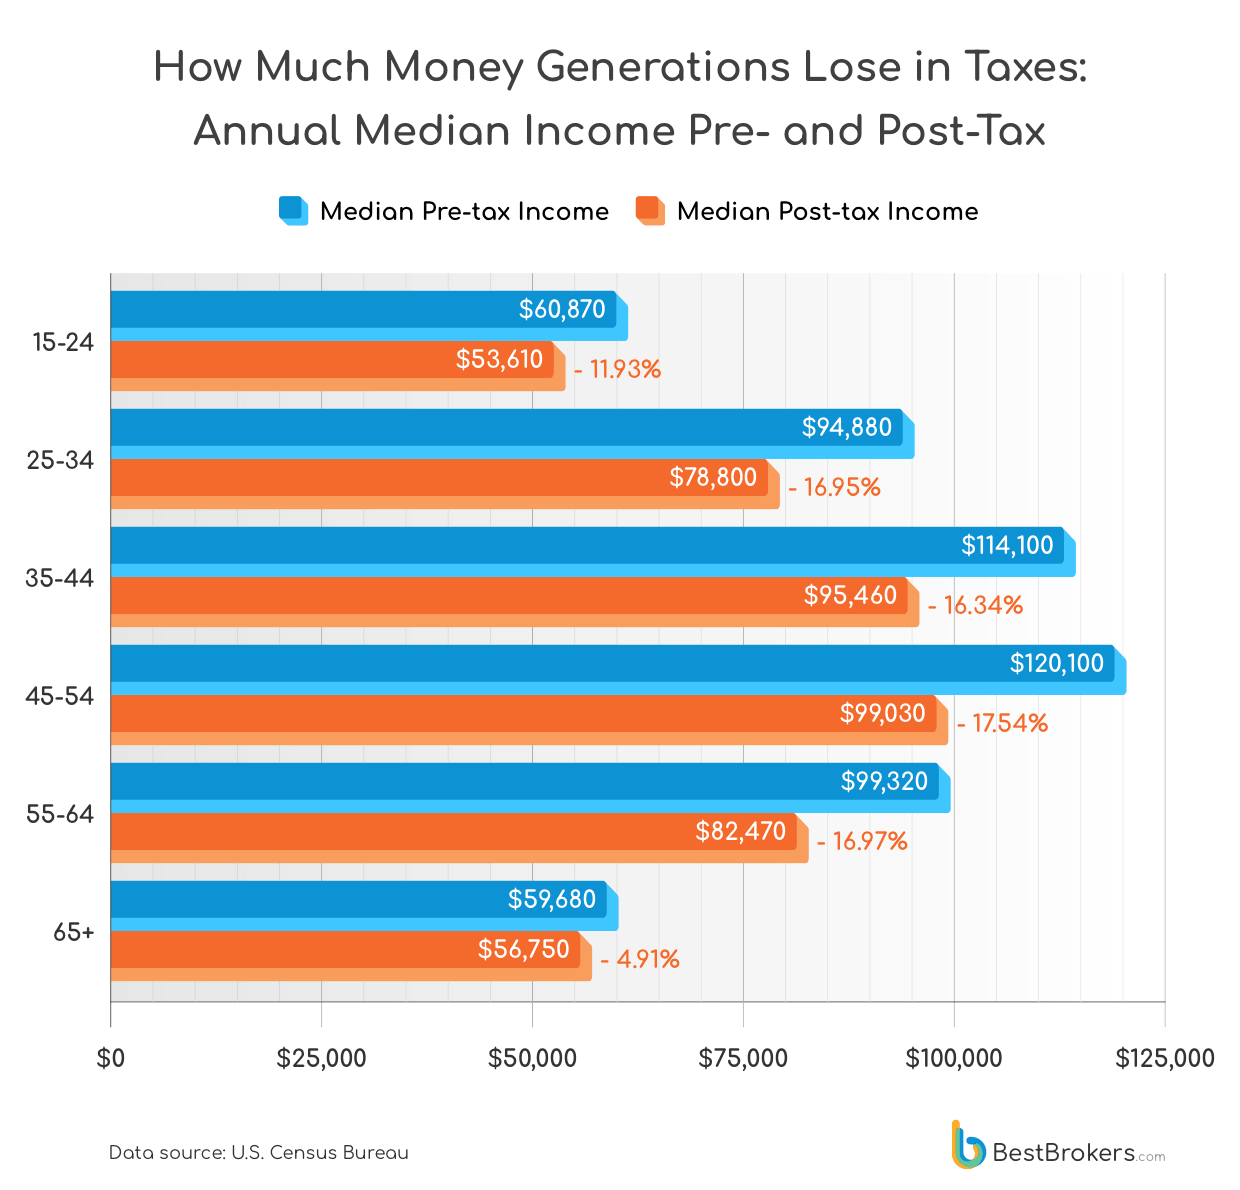
As Americans approach and enter retirement age, the tax picture changes sharply. The 55-64 group still sees median income reduced by 16.97% after tax, but among those aged 65 and over, the reduction falls to just 4.91%, and median pre-tax income drops from $99,320 to $59,680. The contrast reflects a fundamental shift in the finances of later life: the 65+ group includes a growing share of households whose income is no longer centered on employment, meaning the relationship between earnings and taxation looks very different from that of people still in their peak working years.
Median income more than triples across education levels
In America, the path from the classroom to the payslip can be measured in tens of thousands of dollars. Median pre-tax income rises from $37,090 for people heading a household without a high school diploma to $60,790 for those with a high school education and $79,880 for those who have attended college. But the largest leap comes with a degree: people with a bachelor’s degree or higher have a median pre-tax income of $138,300 – $58,420 more than those with some college education and $101,210 more than those without a high school diploma. In other words, the median income of a degree-holder is almost 3.7 times that of someone who never graduated from high school.
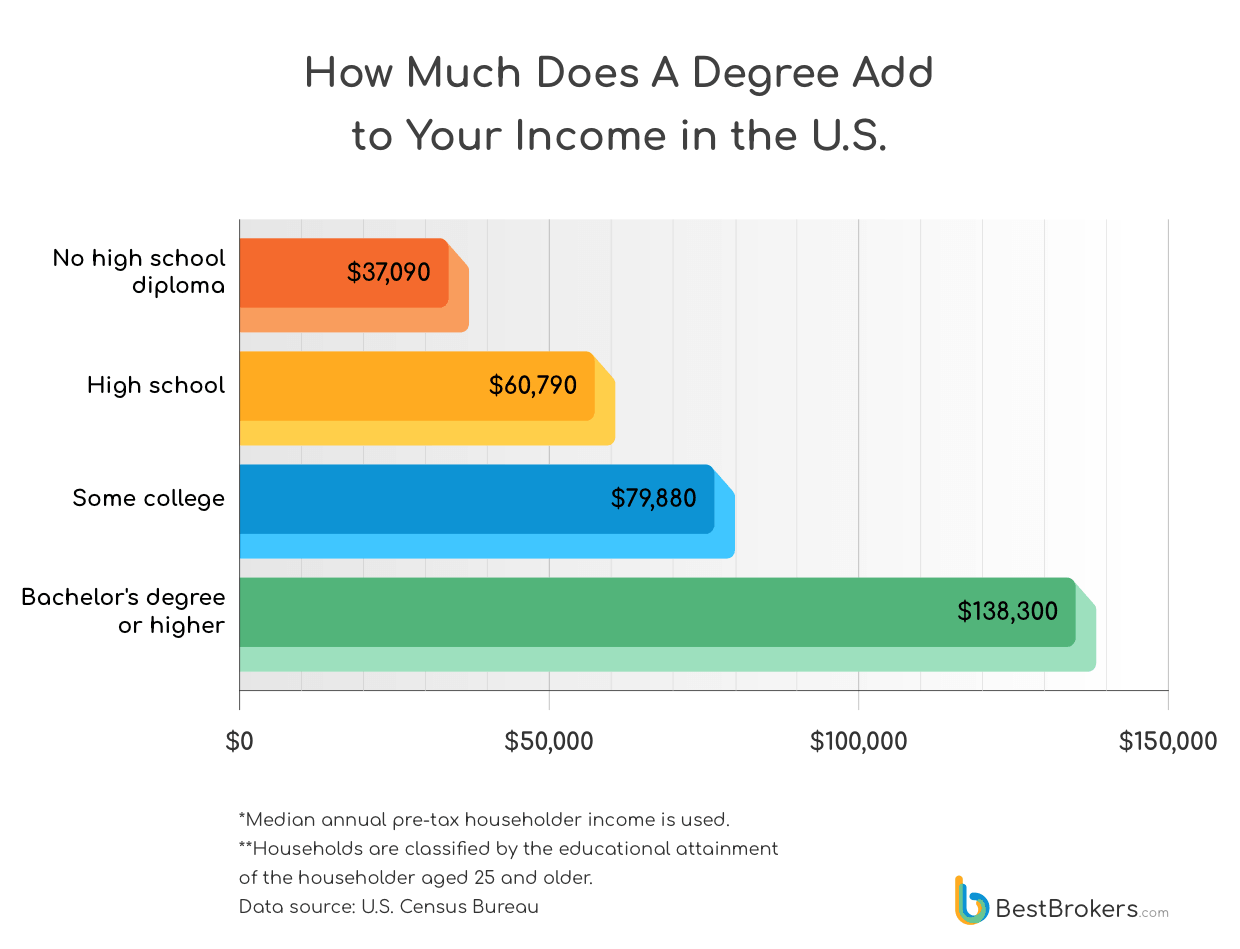
Yet even the $138,300 figure conceals another layer to the education-income equation: what someone studies can matter almost as much as whether they study at all. Research published by the Federal Reserve Bank of New York in 2025 found that the typical college graduate earns around $80,000 a year, compared with $47,000 for a worker with only a high school diploma – a college wage premium of roughly 68%. But the return varies substantially by major, with engineering, mathematics and computing, and business and economics among the fields offering the strongest financial payoffs. For an American weighing the cost of four years of academic study against the income that may follow, the question is therefore becoming more nuanced than simply degree or no degree: increasingly, it is also about which degree.
The Long Road Towards Equal Earnings
Over six decades, the American paycheck has changed profoundly for women. In 1965, women working full-time and year-round earned a median $31,970, just 59.9% of men’s $53,340. By 2025, women’s inflation-adjusted median earnings had almost doubled to $60,760, while men’s had risen to $72,380, bringing the female-to-male earnings ratio to 83.9%. The progression was not linear: the ratio actually slipped slightly between 1965 and 1975, before climbing steadily through the following decades, reaching 71.4% in 1995, 77.0% in 2005 and 79.6% in 2015.
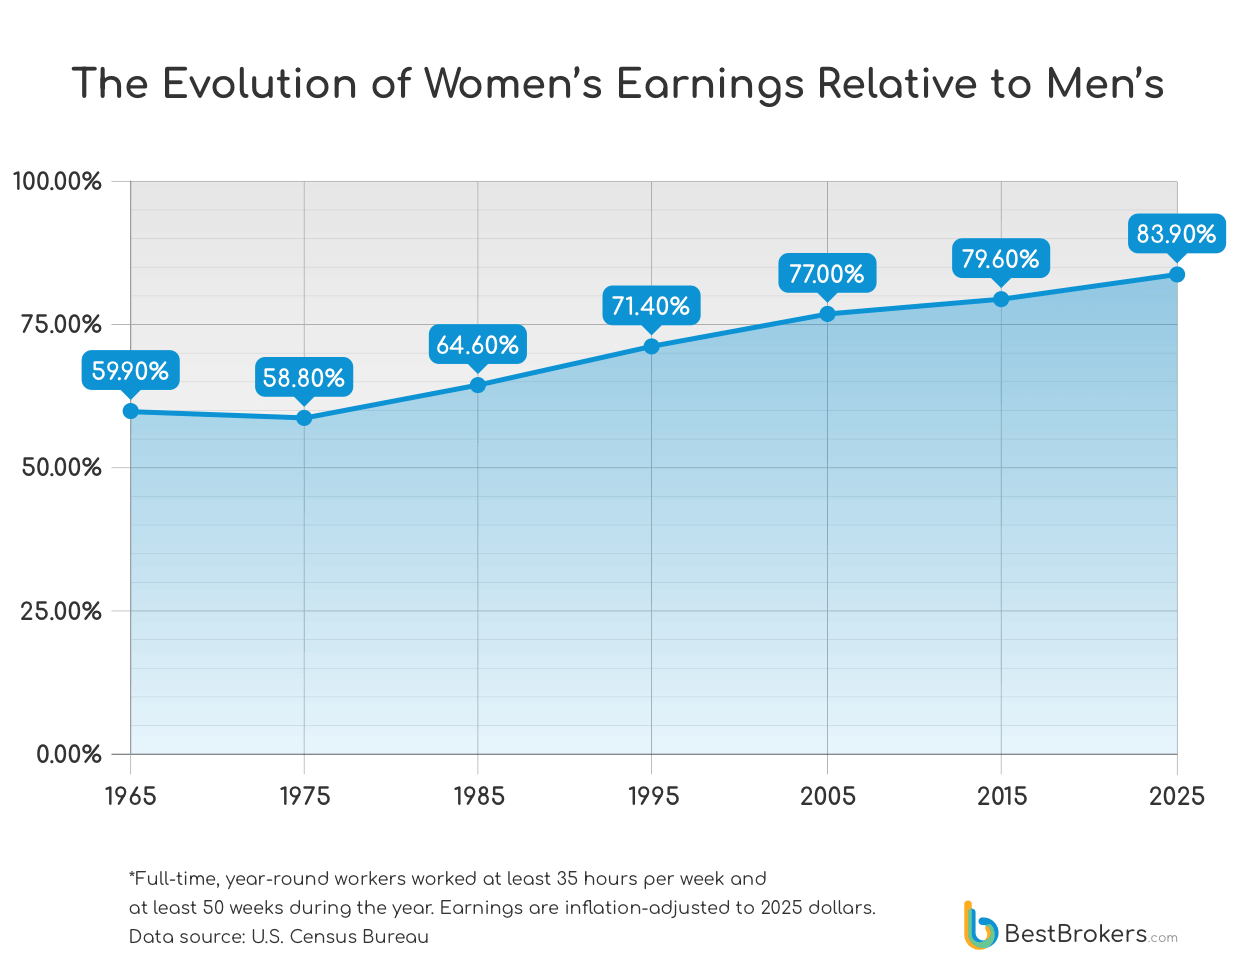
The latest figure also marks a notable turn. After falling to 80.6% in 2024, the female-to-male earnings ratio rose to 83.9% in 2025, its highest level in the series shown here. Women’s median earnings increased 3.2% in 2025, while men’s did not change significantly, according to the Census Bureau. The long arc is striking: over 60 years, women’s real median earnings increased by around 90%, compared with roughly 36% for men. The gap has by no means disappeared, but the modern American paycheck looks markedly different from the one earned by a woman entering full-time work in the mid-1960s.
Methodology
The analysis draws on data from the U.S. Census Bureau and Experian, covering household income, educational attainment, taxes, debt and earnings across different age groups and generations in the United States. Income figures are based on 2025 data and are presented in pre-tax terms unless otherwise stated, while the earnings comparison between women and men uses inflation-adjusted 2025 dollars and covers full-time, year-round workers. Generational income figures were calculated from the underlying age-group data, with generations defined according to their corresponding age ranges. Debt figures reflect average balances among consumers carrying each type of debt. Additional calculations, including percentage changes, income differences and earnings ratios, were derived from the published figures and rounded where appropriate.