

Buying a home remains one of the biggest financial milestones for Americans – and one of the most difficult to achieve. Although the housing market has become more balanced than during the post-pandemic surge, home prices remain historically high relative to incomes, while elevated mortgage rates continue to weigh on affordability. As a result, where you live still plays a decisive role in how attainable homeownership really is.
To uncover where homeownership is within reach – and where it remains a more distant goal – the team at BestBrokers analyzed the median sale price of residential properties for March 2026 across every U.S. state using data from Redfin. We then compared these figures with first-quarter 2026 per capita personal income data from the U.S. Bureau of Economic Analysis to estimate how many years of income it would take the average resident to purchase a home. Based on these findings, we ranked every state by housing affordability and identified the least and most affordable places to buy a home in America. To pinpoint the most active property markets in the United States, we examined total home sales in May 2026 and calculated sales per 100,000 residents, revealing where housing turnover is highest.
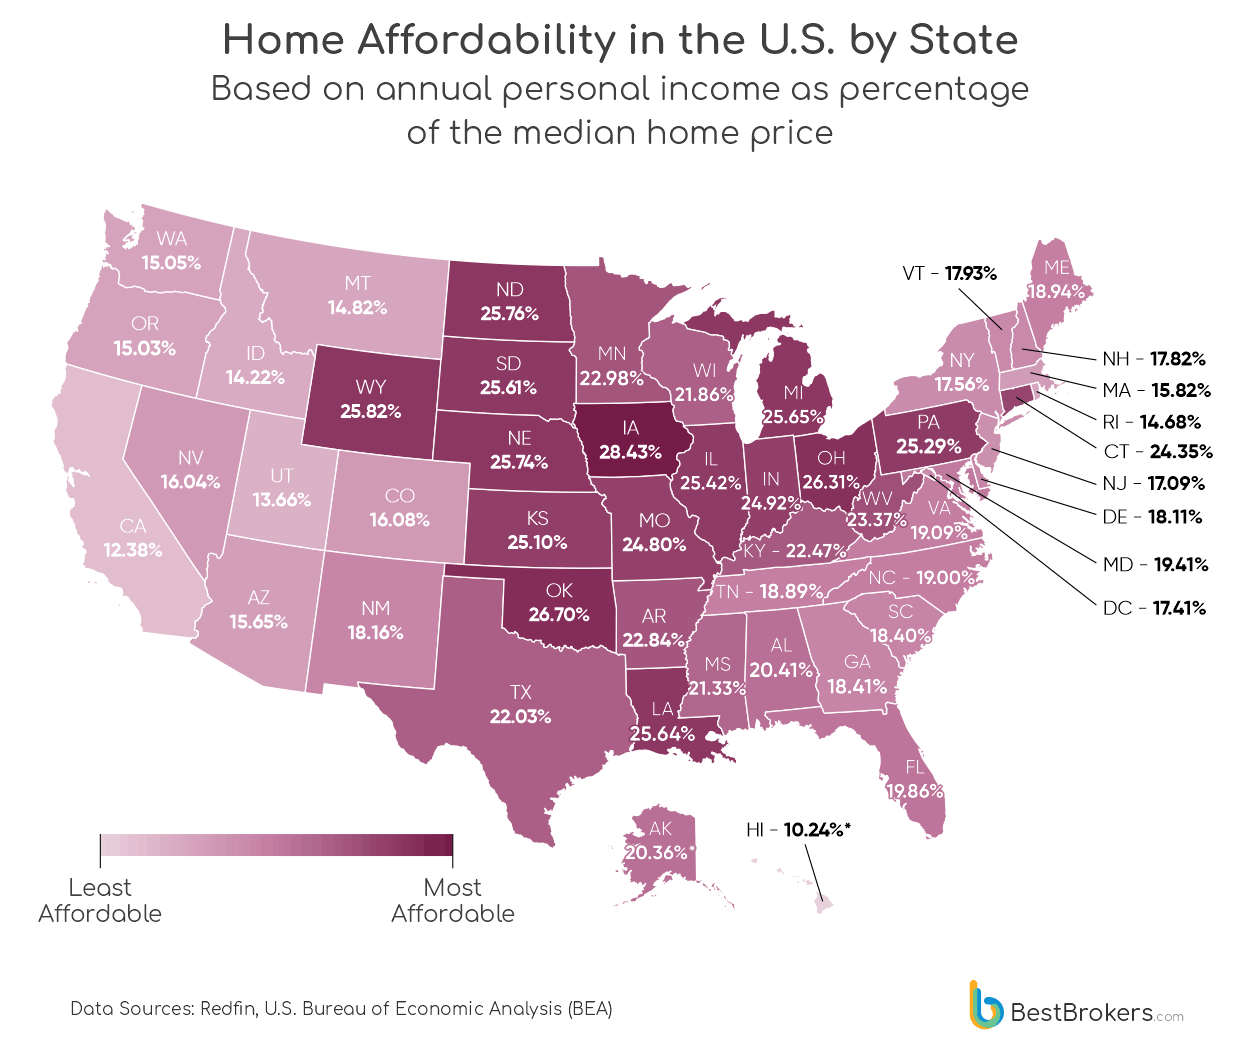
To make the numbers speak visually, we charted income per capita against median home prices across every state, turning affordability into a percentage of balance. The higher the share, the more closely earnings and housing costs move in step, while lower values reveal where the two drift further apart.
Prices Stabilize, But Affordability Pressures Persist
After years of extraordinary growth, the U.S. housing market has entered a period of relative stability. Home prices are no longer rising at the double-digit rates seen during the pandemic, but they remain near historic highs. At the same time, elevated borrowing costs continue to weigh heavily on affordability. With 30-year fixed mortgage rates hovering around 6.2% to 6.5% in 2026, buyers financing a median-priced home face significantly higher monthly payments than those who secured mortgages at roughly 3% just a few years ago, even if home prices have largely leveled off.
A notable shift over the past two years has been the steady increase in housing supply. As elevated mortgage rates continue to limit affordability, fewer buyers come along, leaving homes on the market longer and prompting many sellers to adjust their expectations. According to research by real estate listings website Realtor, existing-home inventory increased by 15.2% in 2024 and continued to rise throughout 2025. This expansion in supply has given buyers more choice, reduced competition, and strengthened negotiating power, all of which have contributed to the recent slowdown in home price growth.
Perhaps the most striking feature of the 2026 housing market is that affordability remains under significant strain across almost the entire United States. According to analysis by property data portal ATTOM, homes in 2026 were less affordable than their historical norms in 99% of the 594 U.S. counties it analysed, reflecting a widening gap between housing costs and wages over the past several years. Since 2020, home prices have risen by around 54%, while wages have increased by roughly 29% over the same period, underscoring a persistent imbalance between earnings and property values.
More recently, however, income growth has continued at a modest pace. Data from the U.S. Bureau of Economic Analysis shows that annual personal income per capita rose by 3.24%, increasing from $75,375 in Q1 2025 to $77,816 in Q1 2026. While this growth signals gradual improvement in household earnings, it remains insufficient to close the broader affordability gap that has built up over the past decade. It should be noted that BEA’s personal income statistics show what residents get from paychecks, employer-provided supplements such as insurance, business ownership, rental property, Social Security, and other government benefits, interests, and dividends.
As per our findings, the most extreme affordability pressures in the country are concentrated in Hawaii, Utah, and California. In Hawaii, the median home value stood at $750,000 in March 2026, while per capita income reached $76,797 in Q1 2026. This results in a home price-to-income ratio of 9.77, meaning it would take roughly nine years and nine months of total income to purchase a home outright under these conditions. California and Utah show similarly elevated levels of unaffordability, with ratios of 8.08 and 7.32, respectively.
Typical U.S. Homes Still Cost More Than Five Years of the Average Person’s Income
The median U.S. home sale price reached $398,771 in 2026, while per capita personal income stood at $77,816 in the first quarter of the year. This means the price of a typical home is just over five times the average person’s annual income, highlighting the persistent gap between earnings and housing costs.
U.S. States Ranked by Median Home Price-to-Income Ratio (Q1 2026)
*States are ranked from the lowest to the highest home price-to-income ratio, representing the number of annual per capita incomes needed to match the median home sale price.
Data Sources: Redfin, U.S. Bureau of Economic Analysis (BEA)
Historically, the District of Columbia recorded the highest median home value in the United States throughout the 1940s and 1950s, according to the U.S. Census Bureau. That changed in 1960, when Hawaii overtook it, a position the Aloha State has retained ever since. Today, Hawaii and California share the highest median home value in the country and also top our ranking of the least affordable housing markets.
At the opposite end of the spectrum, Iowa and Oklahoma emerge as the most affordable states for homebuyers, with annual personal income per capita accounting for 28.43% and 26.70% of the median home price, respectively, meaning the average resident would need less than four years of total income to purchase a typical home outright.
Diverging Regional Trends in U.S. Personal Income Growth
Looking beyond home prices, the highest levels of personal income per capita in the United States are found in the District of Columbia ($117,513), Connecticut ($101,065), and Massachusetts ($98,721), while the lowest are recorded in Mississippi ($55,449) and West Virginia ($59,595).
U.S. States Where Personal Income per Capita Increased the Most YoY
Data Source: U.S. Bureau of Economic Analysis (BEA)
Perhaps the more interesting insight emerges when examining income growth over time. Between Q1 2025 and Q1 2026, Kansas recorded the strongest increase in personal income per capita, with earnings rising 5.55% year over year, followed closely by New Mexico (5.51%), Nebraska (5.15%), and North Dakota (5.09%). However, faster income growth does not necessarily translate into greater housing affordability. Despite ranking second for income growth, New Mexico residents would still need the equivalent of 5.5 years of income to purchase a typical home, while Nebraska and North Dakota remain considerably more affordable, requiring less than four years of income on average.
The slowest income growth was recorded in parts of the Mid-Atlantic and Southeast, with Delaware (1.23%), Maryland (1.59%), and the District of Columbia (1.77%) at the bottom of the ranking. This weak income momentum is particularly notable given that many of these areas already face some of the highest housing costs in the country. In practice, subdued income growth in high-cost markets further tightens affordability conditions, as earnings fail to keep pace with elevated home prices and borrowing costs.
Midwest and Plains States Dominate U.S. Housing Affordability Rankings
In total, in 12 U.S. states, fewer than four years of income are required to purchase a median-priced home, highlighting a clear affordability cluster at the lower end of the market. Iowa and Oklahoma lead this group, with price-to-income ratios of 3.52 and 3.75, respectively, meaning the average resident would need approximately 3 years and 6 months to 3 years and 9 months of total income to afford a home outright, assuming all earnings were saved. Both states also rank among the most budget/ cheapest housing markets in the country, with median home prices of $245,000 in Iowa and $255,000 in Oklahoma.
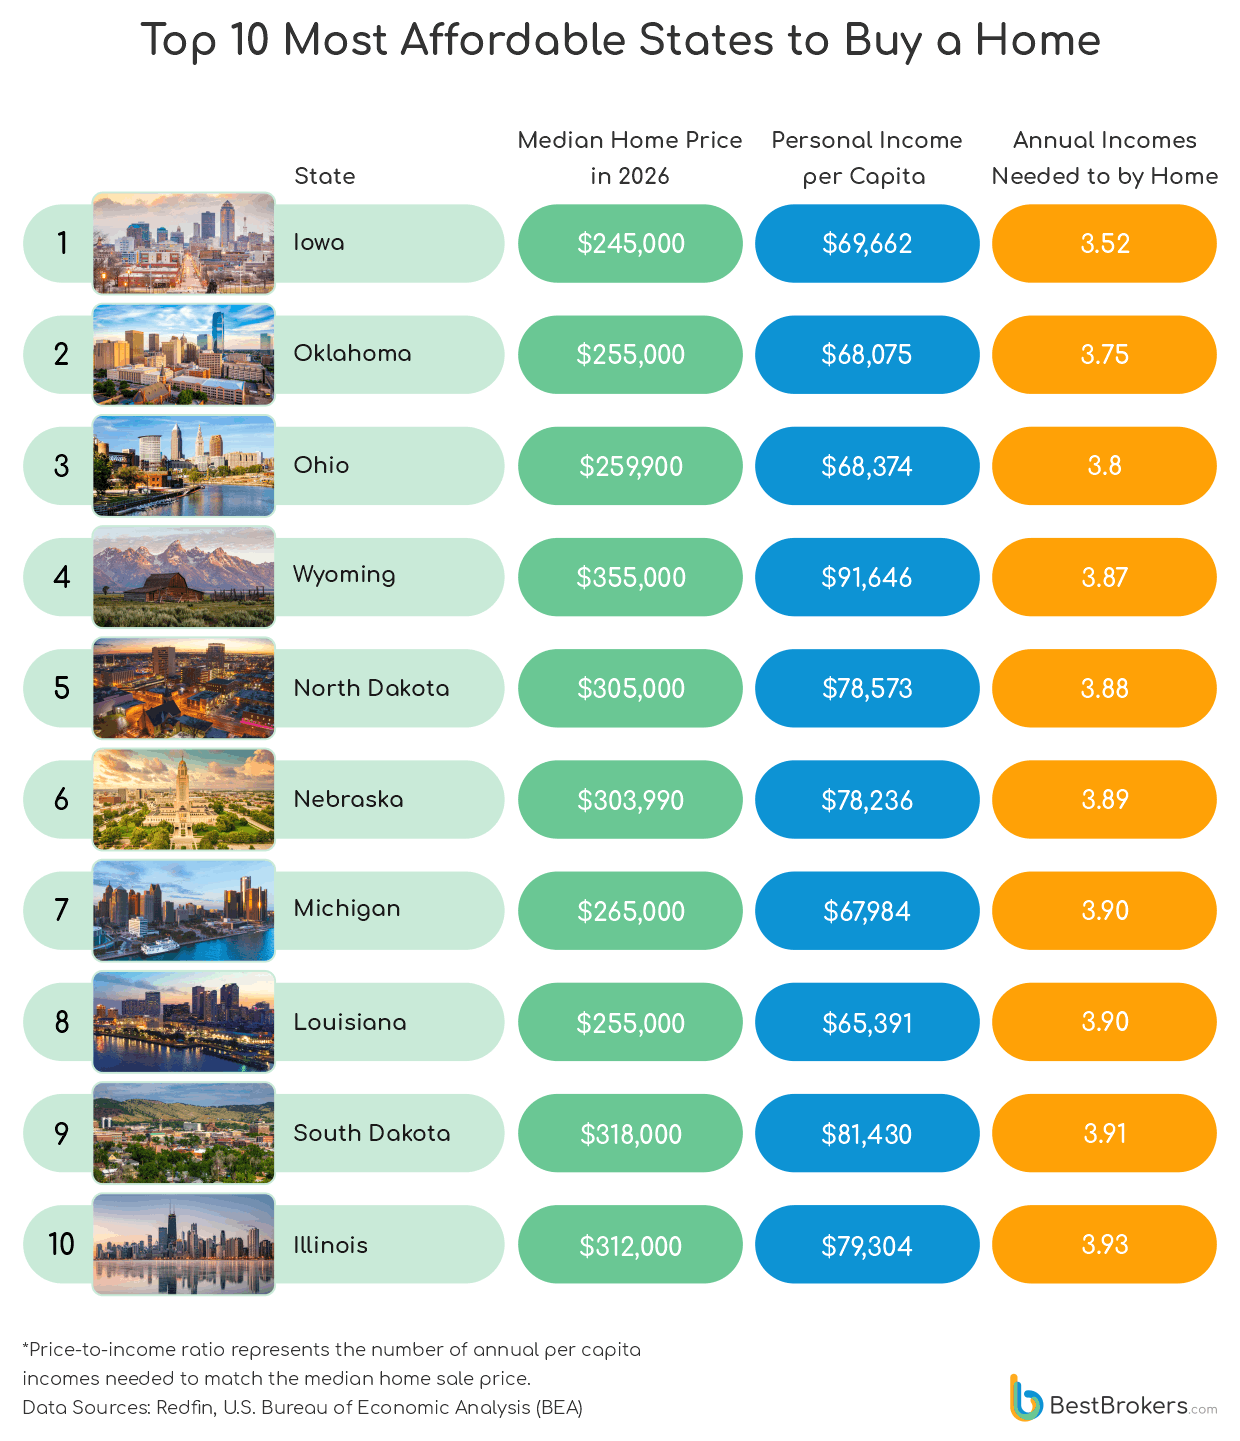
Ohio, Wyoming, and North Dakota round out the top five, with ratios clustered between 3.80 and 3.90, meaning that personal income per capita accounts for roughly 25-26% of the median home price in these states. While this appears relatively manageable in theory, in practice, affordability is shaped by a range of additional factors, including mortgage rates, savings capacity, and regional cost-of-living pressures, which can make homeownership significantly more challenging than the ratios alone suggest.
When looking at the top 10, the most affordable states are largely concentrated in the Midwest and parts of the Great Plains, a region characterised by lower median home prices, more moderate population growth, and comparatively stable income levels. However, while affordability ratios appear favourable on paper, these figures often mask underlying constraints such as limited high-paying job markets, lower population density, and uneven economic opportunities, which can influence both income potential and long-term housing demand in these states.
U.S. States Facing the Highest Housing Affordability Pressures
While the affordability pressures in Hawaii, California, and Utah have already been highlighted, we now turn our attention to states that make it into the headlines less often – Idaho ranks just outside the top three most unaffordable housing markets, with a price-to-income ratio of 7.03, meaning it would take just over seven years of income to afford a median-priced home of $464,413. The state’s affordability challenges have been shaped in part by strong inward migration in recent years, particularly from higher-cost West Coast states, which has driven up demand and pushed home prices higher at a faster pace than local incomes.
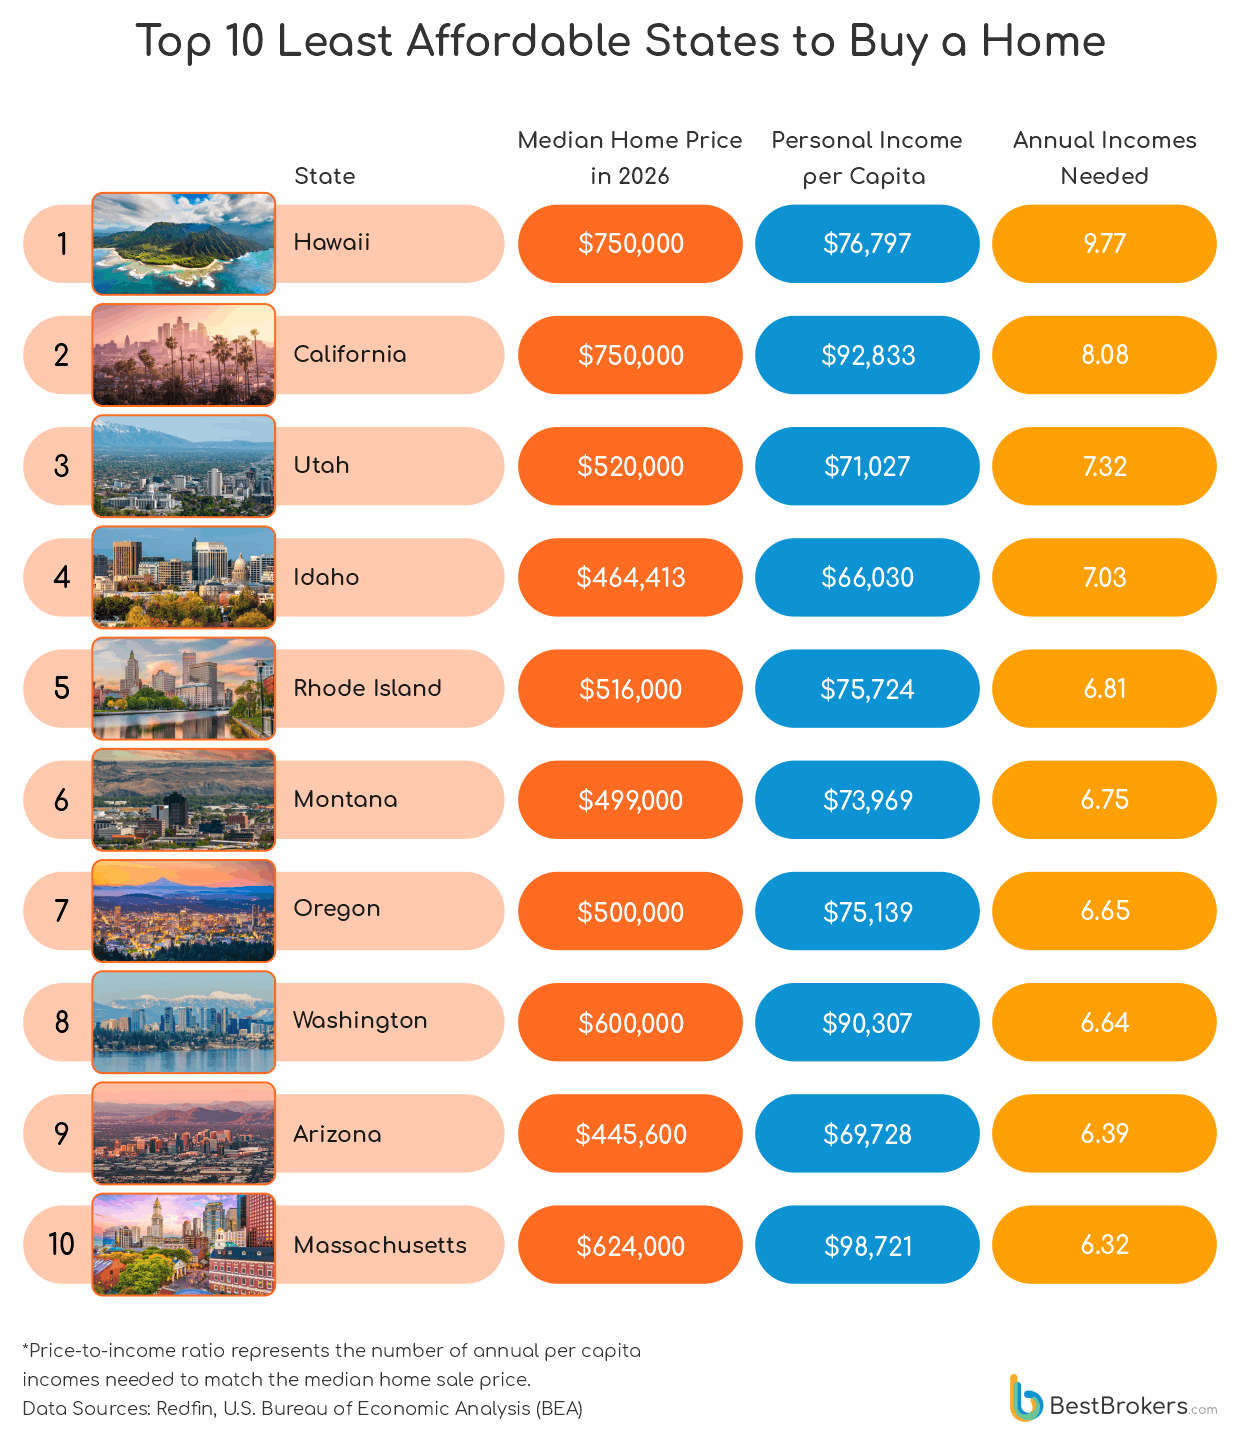
Rounding out the top five, Rhode Island posts a price-to-income ratio of 6.81, reflecting a sharp deterioration in affordability. The state has climbed from 10th to 5th place in the ranking since 2023, depicting how quickly housing pressures have intensified despite relatively modest income growth. This shift has been driven by persistently tight housing supply and rising home values, particularly in coastal and urban areas, where demand has remained structurally strong.
Montana, Oregon, Washington, Arizona, and Massachusetts complete the top 10, each requiring more than 6.3 years of income to purchase a median-priced home. While these figures highlight significant affordability pressures within the United States, they remain broadly comparable to other high-cost developed housing markets, where elevated prices relative to incomes have also become a structural challenge in major urban and coastal regions globally.
America’s Most Active Housing Markets in 2026
Across the United States, home buying activity is broadly steady, with most states clustering between 80 and 120 homes sold per 100,000 residents. It’s a kind of baseline rhythm – consistent, predictable, almost uneventful.
But Missouri breaks that pattern entirely – it leads the nation at 229, nearly double the typical range and far ahead of Nevada (172) and Nebraska (160), which rank second and third. The Sun Belt forms another layer of intensity, but not a uniform one. Florida (129), Arizona (115), Tennessee (115), North Carolina (114), and Georgia (99) all show elevated activity, while Texas (86) sits noticeably lower than expected for its size and growth narrative.
At the other end, expensive coastal markets move more slowly: California (60), New York (50), Massachusetts (75), New Jersey (75), and Hawaii (68). Here, high prices and locked-in mortgages appear to suppress turnover.
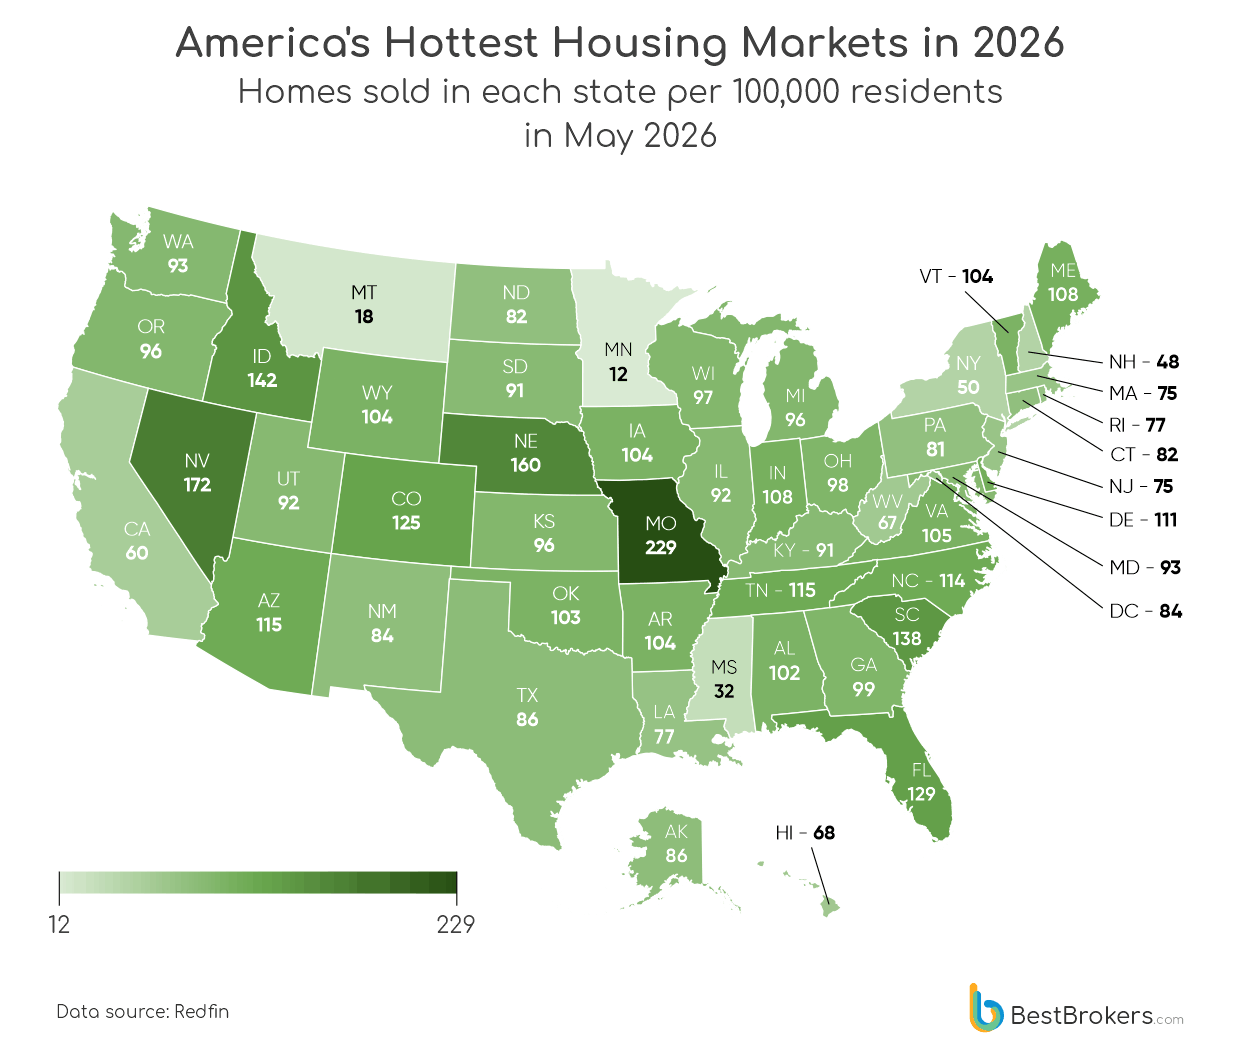
Overall, the gap is extreme: from Missouri’s 229 down to Minnesota’s 12 – almost a twenty-fold difference, revealing a U.S. housing market that doesn’t move as one system, but as many different speeds at once.
Methodology
For this report, the team at BestBrokers analyzed U.S. housing market data for 2026 using figures from Redfin, one of the country’s largest real estate brokerages. The dataset includes monthly median sales prices for different property types across all states, providing a consistent view of housing costs nationwide.
To measure affordability, we combined this with personal income data from the U.S. Bureau of Economic Analysis. We used Q1 2026 state-level income figures, shown in seasonally adjusted annual rates, including both total income and income per capita. To keep the comparison aligned in time, we matched Q1 income data with March 2026 housing prices.
From this, we calculated a price-to-income ratio for each state by dividing median home prices by per capita income, then ranked states accordingly. We also calculated income as a share of median home prices to further show affordability differences.
Finally, to identify the most active housing markets, we used Redfin’s latest available sales data for May 2026 and adjusted it for population size by calculating homes sold per 100,000 residents in each state.
The Most Affordable U.S. States to Buy a Home
| Region | Personal Income per capita Q1 2026 | MEDIAN SALE PRICE NSA ($) | Price to Income Ratio | Income as % of Home Price |
|---|---|---|---|---|
| Hawaii | $76,797 | $750,000 | 9.766006485 | 10.24% |
| California | $92,833 | $750,000 | 8.079023623 | 12.38% |
| Utah | $71,027 | $520,000 | 7.321159559 | 13.66% |
| Idaho | $66,030 | $464,413 | 7.033363623 | 14.22% |
| Rhode Island | $75,724 | $516,000 | 6.814220062 | 14.68% |
| Montana | $73,969 | $499,000 | 6.746069299 | 14.82% |
| Oregon | $75,139 | $500,000 | 6.654333968 | 15.03% |
| Washington | $90,307 | $600,000 | 6.644003233 | 15.05% |
| Arizona | $69,728 | $445,600 | 6.390546122 | 15.65% |
| Massachusetts | $98,721 | $624,000 | 6.32084359 | 15.82% |
| Nevada | $74,591 | $465,000 | 6.233996059 | 16.04% |
| Colorado | $87,956 | $547,000 | 6.2190186 | 16.08% |
| New Jersey | $89,724 | $525,000 | 5.85127725 | 17.09% |
| District of Columbia | $117,513 | $675,000 | 5.74404534 | 17.41% |
| New York | $91,287 | $520,000 | 5.696320396 | 17.56% |
| New Hampshire | $88,190 | $495,000 | 5.612881279 | 17.82% |
| Vermont | $76,171 | $424,900 | 5.578238437 | 17.93% |
| Delaware | $71,551 | $395,000 | 5.520537798 | 18.11% |
| New Mexico | $63,570 | $349,995 | 5.505663049 | 18.16% |
| South Carolina | $64,395 | $350,000 | 5.435204597 | 18.40% |
| Georgia | $66,096 | $359,000 | 5.431493585 | 18.41% |
| Tennessee | $69,876 | $370,000 | 5.295094167 | 18.89% |
| Maine | $72,933 | $385,000 | 5.278817545 | 18.94% |
| North Carolina | $69,720 | $367,000 | 5.263912794 | 19.00% |
| Virginia | $81,123 | $424,900 | 5.237725429 | 19.09% |
| Maryland | $82,487 | $425,000 | 5.152327033 | 19.41% |
| Florida | $78,051 | $393,000 | 5.035169312 | 19.86% |
| Alaska | $81,386 | $399,700 | 4.911164082 | 20.36% |
| Alabama | $60,426 | $296,000 | 4.898553603 | 20.41% |
| Mississippi | $55,449 | $260,000 | 4.68899349 | 21.33% |
| Wisconsin | $72,103 | $329,900 | 4.575399082 | 21.86% |
| Texas | $73,785 | $335,000 | 4.540218202 | 22.03% |
| Kentucky | $61,797 | $275,000 | 4.45005421 | 22.47% |
| Arkansas | $62,803 | $275,000 | 4.378771715 | 22.84% |
| Minnesota | $80,442 | $350,000 | 4.350960941 | 22.98% |
| West Virginia | $59,595 | $255,000 | 4.278882457 | 23.37% |
| Connecticut | $101,065 | $415,000 | 4.106268243 | 24.35% |
| Missouri | $68,910 | $277,825 | 4.031708025 | 24.80% |
| Indiana | $67,272 | $269,900 | 4.012070401 | 24.92% |
| Kansas | $71,546 | $285,000 | 3.983451206 | 25.10% |
| Pennsylvania | $75,839 | $299,900 | 3.954429779 | 25.29% |
| Illinois | $79,304 | $312,000 | 3.934227782 | 25.42% |
| South Dakota | $81,430 | $318,000 | 3.905194646 | 25.61% |
| Louisiana | $65,391 | $255,000 | 3.899619214 | 25.64% |
| Michigan | $67,984 | $265,000 | 3.897975994 | 25.65% |
| Nebraska | $78,236 | $303,990 | 3.885551409 | 25.74% |
| North Dakota | $78,573 | $305,000 | 3.881740547 | 25.76% |
| Wyoming | $91,646 | $355,000 | 3.873600594 | 25.82% |
| Ohio | $68,374 | $259,900 | 3.801152485 | 26.31% |
| Oklahoma | $68,075 | $255,000 | 3.745868527 | 26.70% |
| Iowa | $69,662 | $245,000 | 3.516981999 | 28.43% |