

Gold has carried its extraordinary momentum into 2026, climbing above $5,100 as investors sought a safe haven amid geopolitical tensions, expectations of looser U.S. monetary policy and continued uncertainty across global markets. Strong central bank demand and record inflows into gold-backed exchange-traded funds have provided further support, keeping the precious metal firmly in the spotlight even as prices have become increasingly volatile.
Central banks have remained a powerful force in the gold market in 2026, continuing to build reserves as governments reassess the role of gold in an increasingly uncertain financial landscape. Purchases reflect a range of strategies, from strengthening reserve diversification and reducing exposure to currency volatility to building a buffer against geopolitical and economic risks. At the same time, some central banks have reduced their holdings as they rebalance reserves or respond to liquidity needs, highlighting that gold remains both a strategic asset and an actively managed component of national reserves.
As of September 2026, gold has remained a focal point of global financial markets, even as prices have oscillated in response to shifts in monetary policy expectations and dollar strength. In view of this, the BestBrokers team analysed the latest central bank gold holdings data from the World Gold Council to identify which countries have expanded their official reserves most significantly in 2026 and which have reduced them, offering a detailed view of how sovereign reserve strategies have evolved alongside broader macroeconomic and market developments.
What Has Been Driving Gold’s Rally?
Gold’s performance in 2026 has been fuelled by a combination of investment demand, central bank buying, geopolitical uncertainty, and macroeconomic dynamics. Investment demand has remained an important part of the picture. In the first quarter of 2026, total gold demand including over-the-counter trading reached 1,231 tonnes, up 2% year-on-year, while its value rose 74% to a record $193 billion. Bar and coin investment was particularly strong, increasing 42% to 474 tonnes, with China accounting for a record 207 tonnes.
Central banks have provided another source of persistent demand. They added an estimated 244 tonnes to their reserves during the first quarter, above both the previous quarter and the five-year quarterly average. The World Gold Council’s 2026 Central Bank Gold Reserves Survey also suggests that this buying is not simply a response to short-term price movements: 89% of respondents expect global official gold reserves to increase over the next 12 months, while a record 45% expect their own holdings to rise.
Monetary policy has remained a key short-term driver. Expectations of lower U.S. interest rates tend to support gold by reducing the relative appeal of yield-bearing assets, while higher Treasury yields and a stronger dollar can weigh on demand. Geopolitical tensions, trade disputes, and concerns over government debt have provided an additional reason for investors and central banks to diversify reserves.
ETF demand has become more uneven after strong inflows earlier in the year. In June, gold-backed ETFs recorded $8.9 billion in global outflows, with every region seeing withdrawals, although first-half flows remained positive at $8 billion. This suggests that investor appetite has cooled rather than disappeared, leaving gold supported by central bank and physical demand while remaining sensitive to shifts in rates, yields, and the dollar.
Central Banks with the Largest Gold Reserves in 2026
Gold has experienced an exceptionally volatile 2026. The year began with a sharp rally, as gold set more than 12 all-time highs and reached an intraday record of $5,595.47 per ounce on January 29. The rally was followed by a steep correction, with gold briefly falling below $4,000 in late June. Much of the first-half volatility can be attributed to geopolitical risk, investor positioning, and profit-taking, while stronger-than-expected rates and a stronger U.S. dollar added pressure on prices.
July brought the first monthly gain in five months, with gold rising 1.1% as softer inflation data and a weaker dollar reduced expectations of further Federal Reserve rate hikes. However, the recovery remained limited: by early August, gold was trading around $4,050 per ounce, with investors still weighing the outlook for U.S. rates against persistent geopolitical tensions and inflation concerns. Within just a couple of weeks, it briefly rose above $4,600 per troy ounce, driven by slower U.S. inflation and easing geopolitical risks, while the U.S. Treasury expanded its long-term bond buybacks.
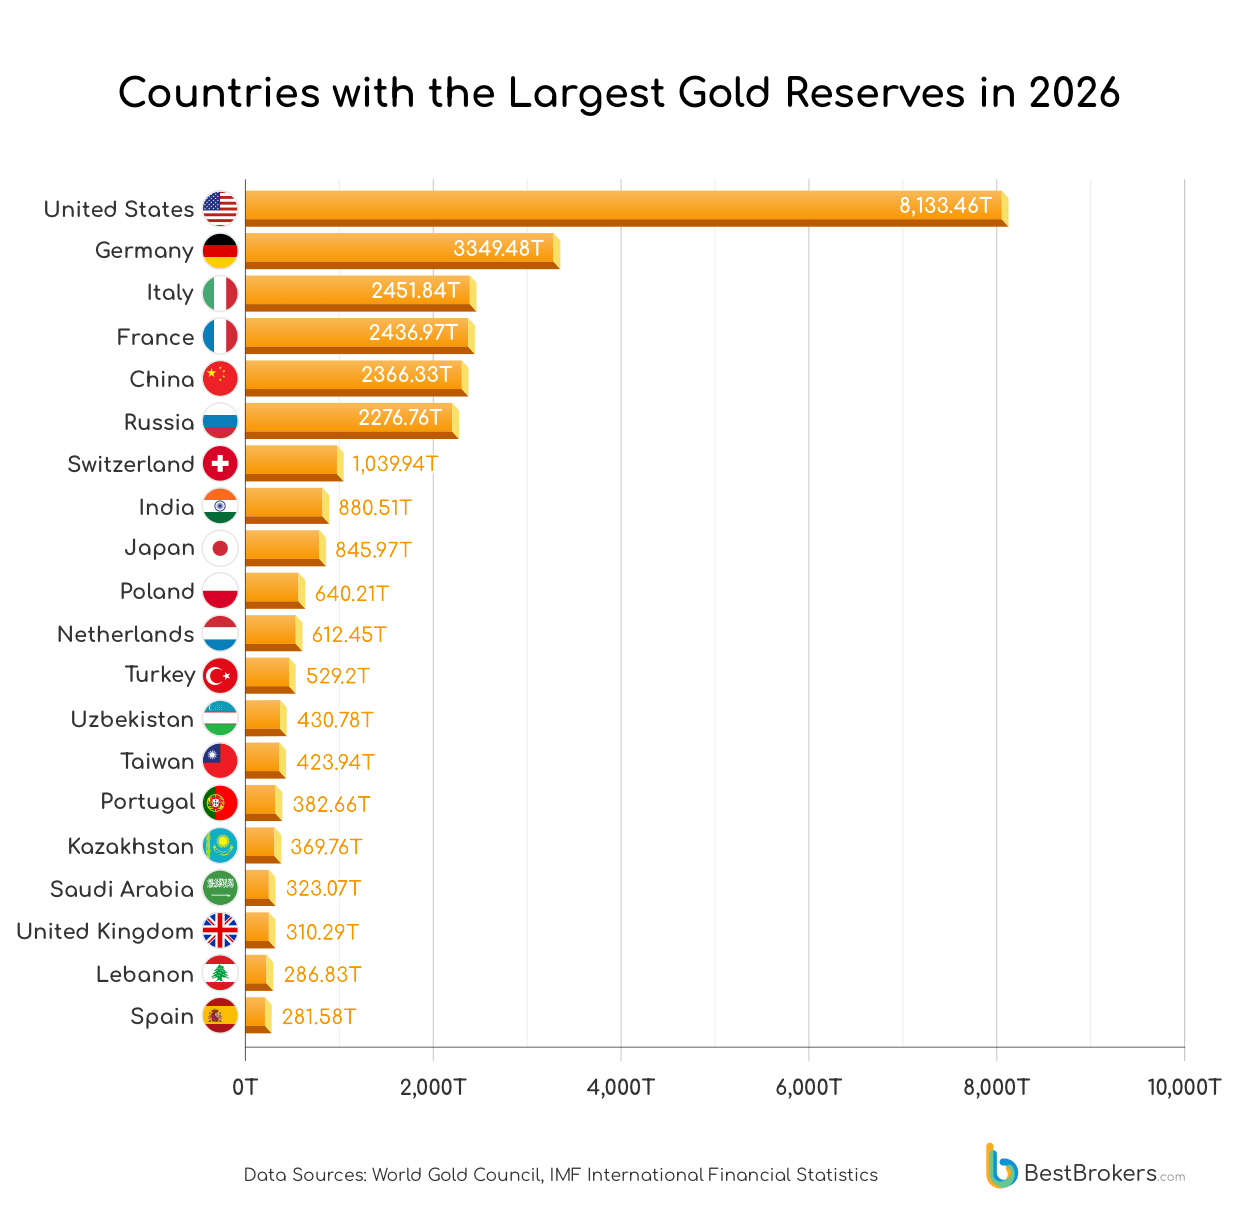
Gold’s importance, of course, extends beyond private investors, serving as a key reserve asset held by central banks to diversify holdings, support financial stability, and strengthen confidence in national currencies. The nation holding the largest official gold reserve remains the United States, with 8,133.46 tonnes, representing 81.40% of its total foreign reserves. Germany and Italy follow, with 3,349.48 tonnes and 2,451.83 tonnes, respectively. Other countries with substantial holdings include France (2,436.97 tonnes) and China (2,366.33 tonnes). Russia, Switzerland, India, and Japan also maintain significant reserves, with Russia at 2,276.76 tonnes and Switzerland approaching 1,040 tonnes.
Following significant gold purchases – 18.2 tonnes in May and another 18.6 tonnes in June, Poland officially entered the top 10 countries with the largest gold reserves, surpassing Turkey and the Netherlands. The acquisition brought Poland’s total gold purchases in the first half of 2026 to 82.2 tonnes, highlighting its continued push to strengthen its bullion holdings.
It should be noted that not all nations report their gold holdings to the IMF, so actual totals may vary. Collectively, the ten largest national reserves account for 66.48% of all gold held by official institutions, while the top five countries alone hold 51%.
Nations’ Gold Reserves Per Capita
Despite some countries holding substantial total reserves, per capita gold holdings provide a different perspective, offering insight into the relative ‘gold wealth’ of large and small economies.
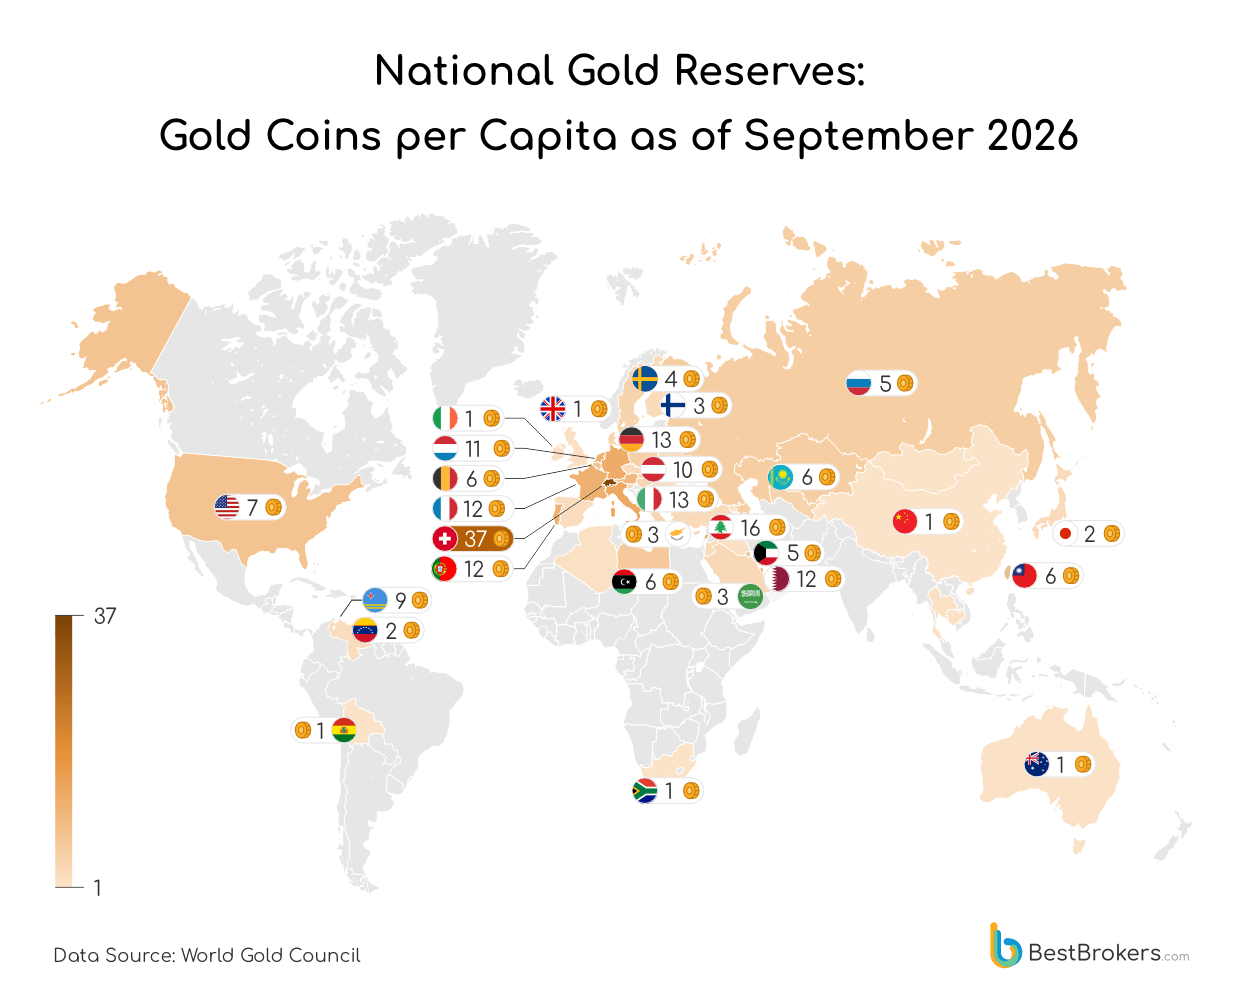
The United States, while maintaining the largest overall reserve, ranks only 12th in per capita terms, with 23.3 grams per citizen, equivalent to 0.75 troy ounces, or roughly seven small gold coins (each containing 0.1 troy ounces or 3.39 grams).
Switzerland, by contrast, holds the seventh-largest overall reserve, but its small population of approximately 9 million elevates it to first place in per capita holdings, with a little over 115 grams (3.7 troy ounces) per person, or the equivalent of 37 small gold coins, the highest per capita total worldwide.
Lebanon ranks second, with roughly 16 small gold coins per person, followed by Italy and Germany, each with about 13 coins per citizen, despite little change in their reserves over decades. Qatar also ranks highly, with 115.2 tonnes of gold, equivalent to around 12 coins per person, alongside Portugal (382.66 tonnes) and France (2,437 tonnes), which similarly translate to roughly 12 coins per citizen.
Other notable countries by per capita holdings include Singapore and the Netherlands, each with about 11 coins per person, while Austria follows with 10 coins. Ranking 11th is the Caribbean island of Aruba, whose 3.11 tonnes of gold for a population of just 108,000 surpasses the United States in per capita terms.
Gold Buying Persists as Reserve Strategies Diverge
Since the start of 2026, central bank gold activity has shifted from the broad, synchronised accumulation seen in 2022-2024 towards a more fragmented, two-way flow. Net purchases remain positive, but the pace is less uniform, with continued reserve diversification increasingly offset by intermittent selling and balance-sheet adjustments, often linked to liquidity needs.
What has changed most is not the direction of flows, but their character: gold is being accumulated more selectively and managed more actively within reserves, rather than added consistently as a one-way strategic hedge. Official-sector demand therefore remains supportive, but has become less predictable and more sensitive to short-term financial and geopolitical conditions.
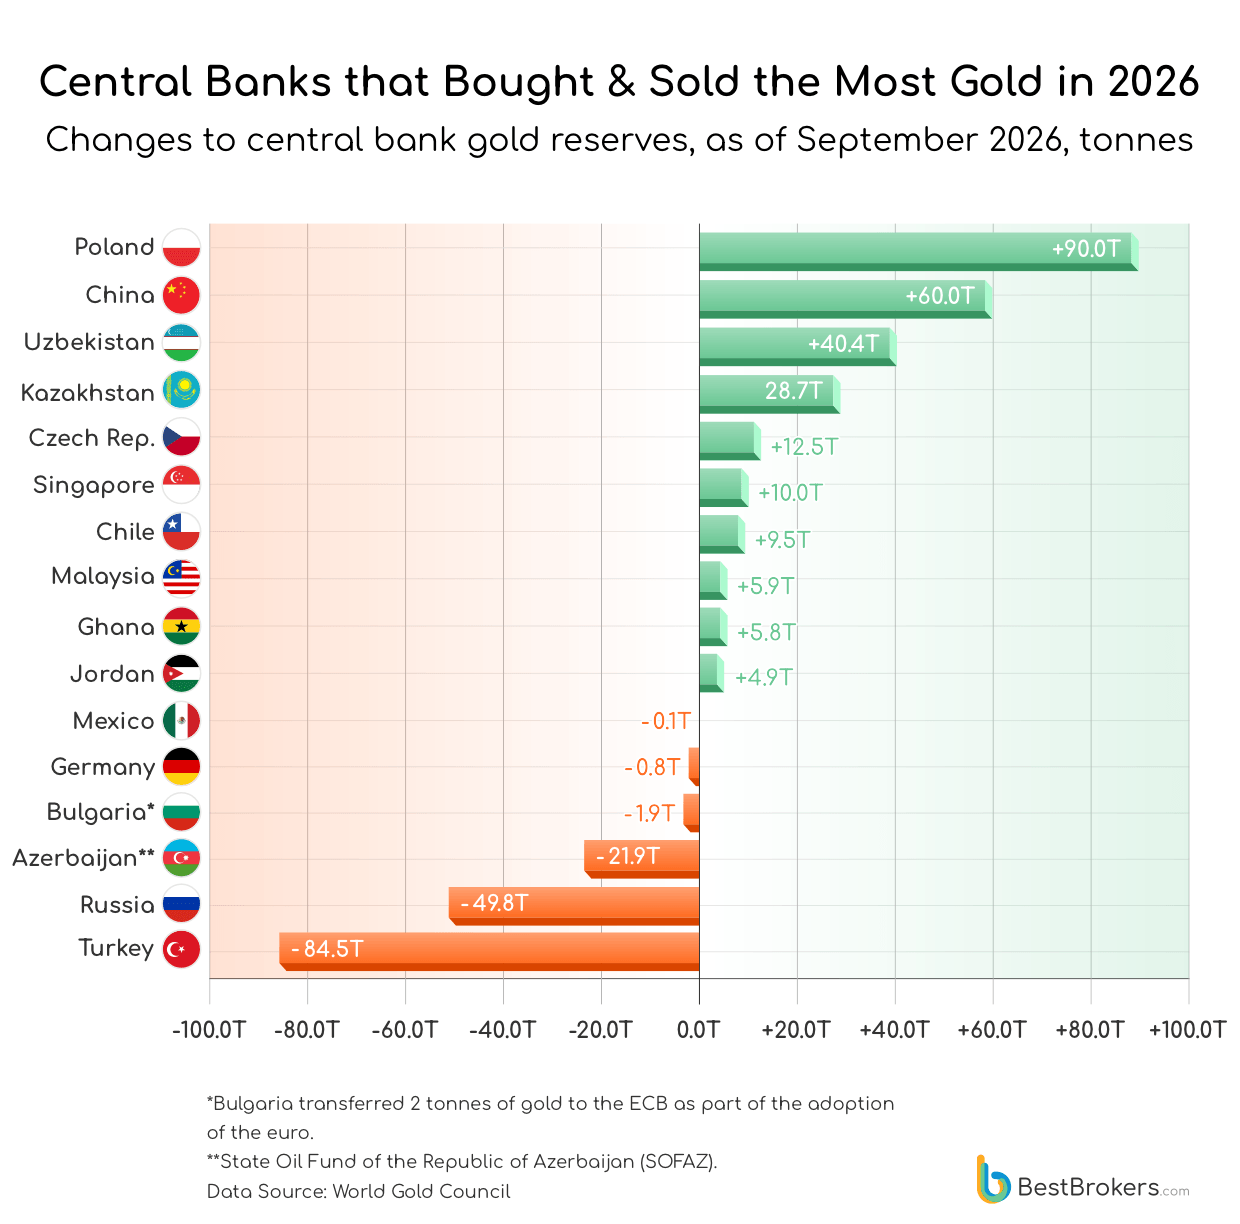
Poland has continued its rapid gold-buying spree, adding 20.2 tonnes in January alone, followed by 11.2 tonnes in February, 14 tonnes in March, 18.2 tonnes in April and 18.6 tonnes in May. Further acquisitions of 26.4 tonnes over the summer months brought its total gold purchases this year to 90 tonnes, extending an accumulation trend that has added more than 400 tonnes to its reserves since 2023. The latest buying pushed Poland into the top tier of global gold holders, placing it 10th worldwide by official gold reserves.
China followed as the second-largest buyer, adding 60 tonnes in 2026. Its monthly purchases accelerated from 1.2 tonnes in January and 0.9 tonnes in February to 14.9 tonnes in June and 19.9 tonnes in July. The continued acceleration highlights China’s long-term, systematic accumulation strategy, and the use of gold as a strategic reserve asset for diversification and resilience rather than short-term market gains.
Uzbekistan ranked third among the largest buyers, adding 40.4 tonnes overall. Its purchases included 8.7 tonnes in January, 7.8 tonnes in February, 8.7 tonnes in March, a reduction of 1.2 tonnes in April, followed by another 8.7 tonnes in May and 8.7 tonnes in June, before reducing its holdings by 0.9 tonnes in July. Kazakhstan added 28.7 tonnes in 2026 so far, while the Czech Republic continued its steady accumulation with 12.5 tonnes. Singapore and Chile also increased their holdings, adding 10 tonnes and 9.5 tonnes, respectively.
On the selling side, Turkey has emerged as the largest net seller, reducing its official gold holdings by 84.5 tonnes in 2026. The decline was concentrated in the first three months of the year, including a 60.4-tonne reduction in March, followed by smaller disposals in May, June, and July. The decline marks a sharp reversal from its earlier net-buying stance and reflects concentrated disposals linked to liquidity and foreign-exchange needs, with gold also being used through swap operations.
The Central Bank of the Republic of Türkiye (CBRT) has been actively using gold reserves amid heightened pressure on the Turkish lira and financial markets. Not all of these operations have been reflected as changes in reported official gold holdings, with some announced separately as liquidity-management transactions. When these additional gold trades and reserve changes are taken into account, Turkey has reduced its gold holdings by more than 123 tonnes since January 2026.
Russia is now the second-largest seller, with 49.8 tonnes sold in 2026, including monthly reductions ranging from 6.2 to 9.3 tonnes. The changes have primarily been linked to domestic fiscal and liquidity-management needs, with gold serving as a flexible reserve asset amid a heavily constrained external financial environment. The contrast between continued accumulation by major buyers and concentrated selling elsewhere illustrates how central banks are increasingly using gold both as a long-term reserve asset and as a tool for managing immediate financial pressures.
The second quarter nevertheless brought a renewed acceleration in official-sector demand. According to the World Gold Council’s Q2 2026 Gold Demand Trends report, central banks and other institutions bought 289 tonnes during the quarter, more than five times the revised Q1 level. The increase brought first-half central bank demand to around 345 tonnes, showing that the selling seen among some reserve managers has not translated into a broader retreat from gold.
Who Does Not Own Any Gold?
Despite being one of the world’s top gold-mining nations, Canada is among the very few countries that hold no gold in their official reserves. The Bank of Canada fully sold off its bullion holdings over the past two decades and today reports 0 tonnes of gold as part of its international reserves. This decision reflects a longstanding policy view that U.S. Treasury securities and other highly liquid assets are better suited for reserve management than gold, which former deputy governor Timothy Lane once described as not fitting Canada’s ‘asset-matching framework’.
Norway is another notable example. During World War II, its central bank evacuated about 50 tonnes of gold to the United Kingdom and the United States to support the government-in-exile. After the war, parts of the hoard were returned, but in 2004, Norges Bank announced the sale of nearly all of its remaining bullion, keeping only seven bars and some coins for historical and exhibition purposes. Today, Norway officially reports 0 tonnes of gold in its reserves.
These cases stand in sharp contrast to most other advanced economies, where gold continues to represent a significant share of central bank reserves. They highlight that not all major economies consider the precious metal essential to reserve strategy, even countries with large mining industries like Canada or with historical stockpiles like Norway.
| National Gold Reserves: Gold per Capita Held by Central Banks | |||||||
|---|---|---|---|---|---|---|---|
| Country | Population 2026 | Gold Holdings | Share of Total Reserves | Holdings as of | Gold Holdings in Troy Ounces | Gold per Capita, gram per person | Gold per Capita, ounce per person |
| United States | 349,035,000 | 8,133.46 | 81.40% | Jul 2026 | 261,496,865 | 23.30 | 0.75 |
| Germany | 83,644,300 | 3,349.48 | 81.00% | Apr 2026 | 107,688,151 | 40.04 | 1.29 |
| Italy | 58,926,200 | 2,451.84 | 77.10% | Jul 2026 | 78,828,379 | 41.61 | 1.34 |
| France | 66,746,400 | 2,436.97 | 78.50% | Apr 2026 | 78,350,382 | 36.51 | 1.17 |
| China, P.R.: Mainland | 1,412,910,000 | 2,366.33 | 8.10% | Jul 2026 | 76,079,400 | 1.67 | 0.05 |
| Russian Federation | 143,394,000 | 2,276.76 | 41.30% | Jul 2026 | 73,199,423 | 15.88 | 0.51 |
| Switzerland | 9,007,800 | 1,039.94 | 12.40% | Jun 2026 | 33,434,736 | 115.45 | 3.71 |
| India | 1,476,630,000 | 880.51 | 16.20% | Jul 2026 | 28,309,088 | 0.60 | 0.02 |
| Japan | 122,428,000 | 845.97 | 8.50% | Jun 2026 | 27,198,666 | 6.91 | 0.22 |
| Poland | 37,843,200 | 640.21 | 28.20% | Jul 2026 | 20,583,087 | 16.92 | 0.54 |
| Netherlands | 18,448,800 | 612.45 | 70.00% | Apr 2026 | 19,690,845 | 33.20 | 1.07 |
| Turkey | 87,926,100 | 529.20 | 51.80% | Jul 2026 | 17,014,175 | 6.02 | 0.19 |
| Uzbekistan | 37,724,200 | 430.78 | 87.20% | Jul 2026 | 13,849,891 | 11.42 | 0.37 |
| Taiwan | 23,011,300 | 423.94 | 8.30% | Apr 2026 | 13,629,893 | 18.42 | 0.59 |
| Portugal | 10,395,400 | 382.66 | 75.70% | Apr 2026 | 12,302,903 | 36.81 | 1.18 |
| Kazakhstan | 21,083,600 | 369.76 | 75.50% | Jul 2026 | 11,887,921 | 17.54 | 0.56 |
| Saudi Arabia | 35,165,800 | 323.07 | 7.90% | May 2026 | 10,386,859 | 9.19 | 0.30 |
| United Kingdom | 69,931,500 | 310.29 | 19.20% | Jul 2026 | 9,975,963 | 4.44 | 0.14 |
| Lebanon | 5,897,470 | 286.83 | 79.10% | Mar 2025 | 9,221,927 | 48.64 | 1.56 |
| Spain | 47,850,800 | 281.58 | 29.50% | Apr 2026 | 9,052,929 | 5.88 | 0.19 |
| Austria | 9,107,270 | 280.05 | 71.30% | Jun 2026 | 9,003,929 | 30.75 | 0.99 |
| Thailand | 71,559,600 | 234.52 | 11.00% | Jul 2026 | 7,539,941 | 3.28 | 0.11 |
| Belgium | 11,774,600 | 227.40 | 55.00% | Jun 2026 | 7,310,942 | 19.31 | 0.62 |
| Singapore | 5,905,750 | 203.54 | 5.90% | Jul 2026 | 6,543,948 | 34.46 | 1.11 |
| Azerbaijan | 10,454,900 | 178.10 | 31.80% | Jun 2026 | 5,726,048 | 17.04 | 0.55 |
| Iraq | 48,007,400 | 175.64 | 24.80% | May 2026 | 5,646,955 | 3.66 | 0.12 |
| Algeria | 48,028,300 | 173.56 | 33.70% | Jun 2026 | 5,579,956 | 3.61 | 0.12 |
| Brazil | 213,563,000 | 172.45 | 6.10% | Jun 2026 | 5,544,235 | 0.81 | 0.03 |
| Venezuela | 28,633,700 | 161.22 | 91.50% | Jun 2018 | 5,183,359 | 5.63 | 0.18 |
| Libya | 7,539,850 | 146.65 | 18.60% | Apr 2026 | 4,714,963 | 19.45 | 0.63 |
| Philippines | 117,724,000 | 133.52 | 16.80% | Jul 2026 | 4,292,680 | 1.13 | 0.04 |
| Egypt | 120,101,000 | 129.67 | 31.60% | Jul 2026 | 4,168,912 | 1.08 | 0.03 |
| Sweden | 10,701,000 | 125.72 | 22.30% | Jul 2026 | 4,041,968 | 11.75 | 0.38 |
| South Africa | 65,453,100 | 125.53 | 22.20% | Jul 2026 | 4,035,968 | 1.92 | 0.06 |
| Mexico | 132,998,000 | 120.04 | 5.70% | Jun 2026 | 3,859,503 | 0.90 | 0.03 |
| Qatar | 3,173,560 | 116.18 | 24.80% | Jul 2026 | 3,735,281 | 36.61 | 1.18 |
| Greece | 9,897,120 | 114.74 | 65.20% | Apr 2026 | 3,688,971 | 11.59 | 0.37 |
| Hungary | 9,585,820 | 110.01 | 20.70% | Jun 2026 | 3,536,972 | 11.48 | 0.37 |
| Korea | 51,600,400 | 104.45 | 3.10% | Jun 2026 | 3,358,042 | 2.02 | 0.07 |
| Romania | 18,800,600 | 103.62 | 15.60% | Jul 2026 | 3,331,474 | 5.51 | 0.18 |
| Indonesia | 287,887,000 | 87.04 | 7.80% | Jul 2026 | 2,798,490 | 0.30 | 0.01 |
| Czech Rep. | 10,527,800 | 84.08 | 6.00% | Jul 2026 | 2,703,247 | 7.99 | 0.26 |
| Australia | 27,227,100 | 79.87 | 14.30% | Jul 2026 | 2,567,980 | 2.93 | 0.09 |
| Kuwait | 5,102,770 | 78.98 | 22.20% | Jun 2026 | 2,539,179 | 15.48 | 0.50 |
| Jordan | 11,589,500 | 77.76 | 36.90% | Jul 2026 | 2,499,980 | 6.71 | 0.22 |
| United Arab Emirates | 11,574,700 | 74.51 | 3.70% | Jun 2026 | 2,395,425 | 6.44 | 0.21 |
| Denmark | 6,023,520 | 66.55 | 6.90% | Jul 2026 | 2,139,583 | 11.05 | 0.36 |
| Pakistan | 259,300,000 | 64.82 | 31.40% | Jul 2026 | 2,084,115 | 0.25 | 0.01 |
| Argentina | 46,003,700 | 61.74 | 16.80% | Jul 2026 | 1,984,947 | 1.34 | 0.04 |
| Cambodia | 18,051,200 | 57.30 | 30.30% | Jul 2026 | 1,842,272 | 3.17 | 0.10 |
| Serbia | 6,641,960 | 54.79 | 20.20% | Jul 2026 | 1,761,560 | 8.25 | 0.27 |
| Belarus | 8,937,020 | 53.94 | 49.40% | Jun 2026 | 1,734,286 | 6.04 | 0.19 |
| Kyrgyz Rep. | 7,400,460 | 48.69 | 79.50% | Jun 2026 | 1,565,475 | 6.58 | 0.21 |
| Malaysia | 36,385,100 | 44.79 | 4.40% | Jul 2026 | 1,439,989 | 1.23 | 0.04 |
| Finland | 5,621,740 | 43.86 | 25.80% | Apr 2026 | 1,409,989 | 7.80 | 0.25 |
| Bulgaria | 6,667,660 | 41.04 | 64.30% | Jul 2026 | 1,319,490 | 6.16 | 0.20 |
| Peru | 34,922,100 | 34.67 | 4.80% | Jan 2026 | 1,114,671 | 0.99 | 0.03 |
| Slovak Rep. | 5,451,340 | 31.69 | 23.40% | Apr 2026 | 1,018,992 | 5.81 | 0.19 |
| Ukraine | 39,535,800 | 27.37 | 6.90% | Jul 2026 | 879,993 | 0.69 | 0.02 |
| Ecuador | 18,444,500 | 26.28 | 27.70% | Jun 2026 | 844,956 | 1.42 | 0.05 |
| Syrian Arab Republic | 26,472,500 | 25.80 | 16.70% | Jun 2011 | 829,489 | 0.97 | 0.03 |
| Ghana | 35,697,600 | 24.40 | 36.40% | Jun 2026 | 784,478 | 0.68 | 0.02 |
| Bolivia | 12,768,611 | 23.38 | 84.80% | Jul 2026 | 751,817 | 1.83 | 0.06 |
| Morocco | 38,762,400 | 22.12 | 5.40% | Jun 2026 | 711,201 | 0.57 | 0.02 |
| Afghanistan | 45,047,100 | 21.87 | 25.50% | May 2021 | 703,003 | 0.49 | 0.02 |
| Nigeria | 242,432,000 | 21.54 | 5.40% | Jun 2026 | 692,368 | 0.09 | 0.00 |
| Guatemala | 18,968,000 | 15.51 | 6.00% | Jul 2026 | 498,596 | 0.82 | 0.03 |
| Bangladesh | 177,818,000 | 14.28 | 5.90% | Jul 2026 | 459,160 | 0.08 | 0.00 |
| Cyprus | 1,382,330 | 13.87 | 64.40% | Jun 2026 | 445,996 | 10.04 | 0.32 |
| Guinea | 15,442,000 | 13.16 | 52.00% | Sep 2025 | 423,155 | 0.85 | 0.03 |
| Mauritius | 1,265,060 | 12.42 | 14.60% | Jun 2026 | 399,197 | 9.81 | 0.32 |
| Ireland | 5,356,950 | 12.04 | 11.60% | Apr 2026 | 386,997 | 2.25 | 0.07 |
| Chile | 19,957,326 | 9.79 | 2.40% | Jun 2026 | 314,898 | 0.49 | 0.02 |
| Paraguay | 7,095,280 | 8.19 | 10.60% | Nov 2025 | 263,423 | 1.15 | 0.04 |
| Nepal | 29,629,400 | 7.99 | 4.90% | Dec 2025 | 256,811 | 0.27 | 0.01 |
| Mongolia | 3,556,800 | 7.88 | 15.80% | Jan 2026 | 253,361 | 2.22 | 0.07 |
| Georgia | 3,804,640 | 7.83 | 13.50% | Jul 2026 | 251,857 | 2.06 | 0.07 |
| Tajikistan | 10,978,600 | 7.42 | 18.20% | Feb 2023 | 238,406 | 0.68 | 0.02 |
| North Macedonia | 1,804,060 | 6.89 | 15.50% | Jul 2026 | 221,632 | 3.82 | 0.12 |
| Tunisia | 12,415,100 | 6.84 | 9.40% | Oct 2025 | 219,998 | 0.55 | 0.02 |
| Oman | 5,706,546 | 6.73 | 4.50% | Mar 2025 | 216,297 | 1.18 | 0.04 |
| Latvia | 1,835,940 | 6.66 | 14.10% | Apr 2026 | 213,998 | 3.63 | 0.12 |
| Lithuania | 2,797,340 | 5.82 | 10.50% | May 2026 | 186,999 | 2.08 | 0.07 |
| Colombia | 53,936,200 | 4.68 | 0.90% | Jan 2026 | 150,306 | 0.09 | 0.00 |
| Bahrain | 1,675,570 | 4.67 | 9.20% | Mar 2026 | 149,999 | 2.78 | 0.09 |
| Zimbabwe | 17,273,600 | 4.57 | 37.90% | Jun 2026 | 146,930 | 0.26 | 0.01 |
| Brunei Darussalam | 470,037 | 4.55 | 11.50% | Feb 2026 | 146,158 | 9.67 | 0.31 |
| Slovenia | 2,114,570 | 4.23 | 15.50% | Jun 2026 | 135,999 | 2.00 | 0.06 |
| Mozambique | 36,639,900 | 3.94 | 12.20% | Jul 2025 | 126,574 | 0.11 | 0.00 |
| Albania | 2,751,020 | 3.73 | 5.60% | Feb 2026 | 119,999 | 1.36 | 0.04 |
| Bosnia and Herzegovina | 3,114,240 | 3.48 | 4.80% | Mar 2025 | 111,999 | 1.12 | 0.04 |
| Aruba, Kingdom of the Netherlands | 108,164 | 3.11 | 15.30% | May 2026 | 99,999 | 28.76 | 0.92 |
| Luxembourg | 687,448 | 2.24 | 9.50% | Apr 2026 | 71,999 | 3.26 | 0.10 |
*Figures rounded
Updated: September 17, 2026
Data Source:
- World Gold Council
- London Bullion Market (LBMA), New York Stock Exchange (NYSE)
- World Population Review:
- U.S. Mint: American Eagle Coins
- International Monetary Fund
Methodology
To prepare this report, the team at BestBrokers used the most current data about official central banks’ gold reserves published by the World Gold Council. This is an international trade association for the gold industry, which collects gold holdings data from the International Monetary Fund, the Bank for International Settlements, central banks, and other sources. It should be noted, however, that certain countries are excluded from the database as they are known to have gold reserves but do not report it officially.
Another territory not included in our calculations is Curacao and Sint Maarten. The WGC has combined data for the two Caribbean nations, but they are separate constituent countries of the Kingdom of the Netherlands, which is why we did not list them jointly.
For the per-capita gold reserve ranking, we used publicly available population estimates for 2026. We had to convert the tonnes of gold to troy ounces, so all calculations were based on a conversion rate of 32,150.70 ounces for 1 tonne. For the gold coins, we looked for a small coin and used the American Eagle Gold Proof Coin, 1/10 ounce as an example. It is a one-tenth-ounce coin with a $5 face value, which is 0.650 inches (16.50 mm) in diameter. The coin contains 0.1000 gold troy ounces and weighs 0.1091 troy ounces (3.393 g). It is minted in the United States but many other countries have similar coins.
Here are a few measurements and rates we used for the calculations:
- 1 tonne of gold = 32,150.70 gold troy ounces
- 1 tonne = 1,000,000 grams
- 1 gold troy ounce = 10 coins (1/10 ounce gold coin)