
With crypto prices exploding since January, more and more mining facilities are entering the game, as the global mining hashrate increased by 20% in 2024 alone. This amounts to an enormous investment in specialized ASIC miners, but the required hardware is not the only major cost when it comes to crypto mining.
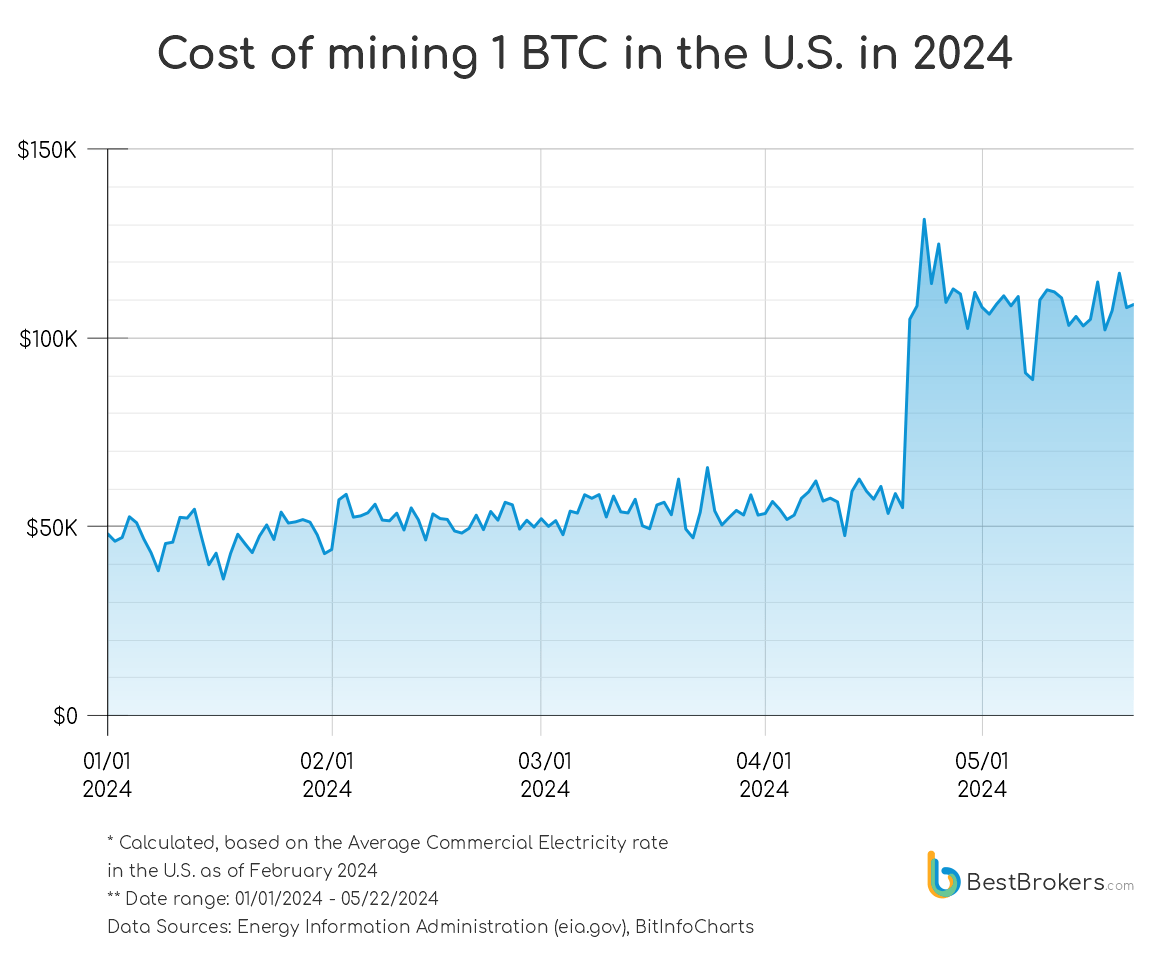
The halving of the Bitcoin block reward on 20 April 2024 resulted in doubling the power consumption for producing one bitcoin (as the reward for mining one block halved from 6.25 to 3.125 BTC). With this in mind, the team at BestBrokers decided to put in perspective the enormous amounts of electrical power used for mining Bitcoin globally.
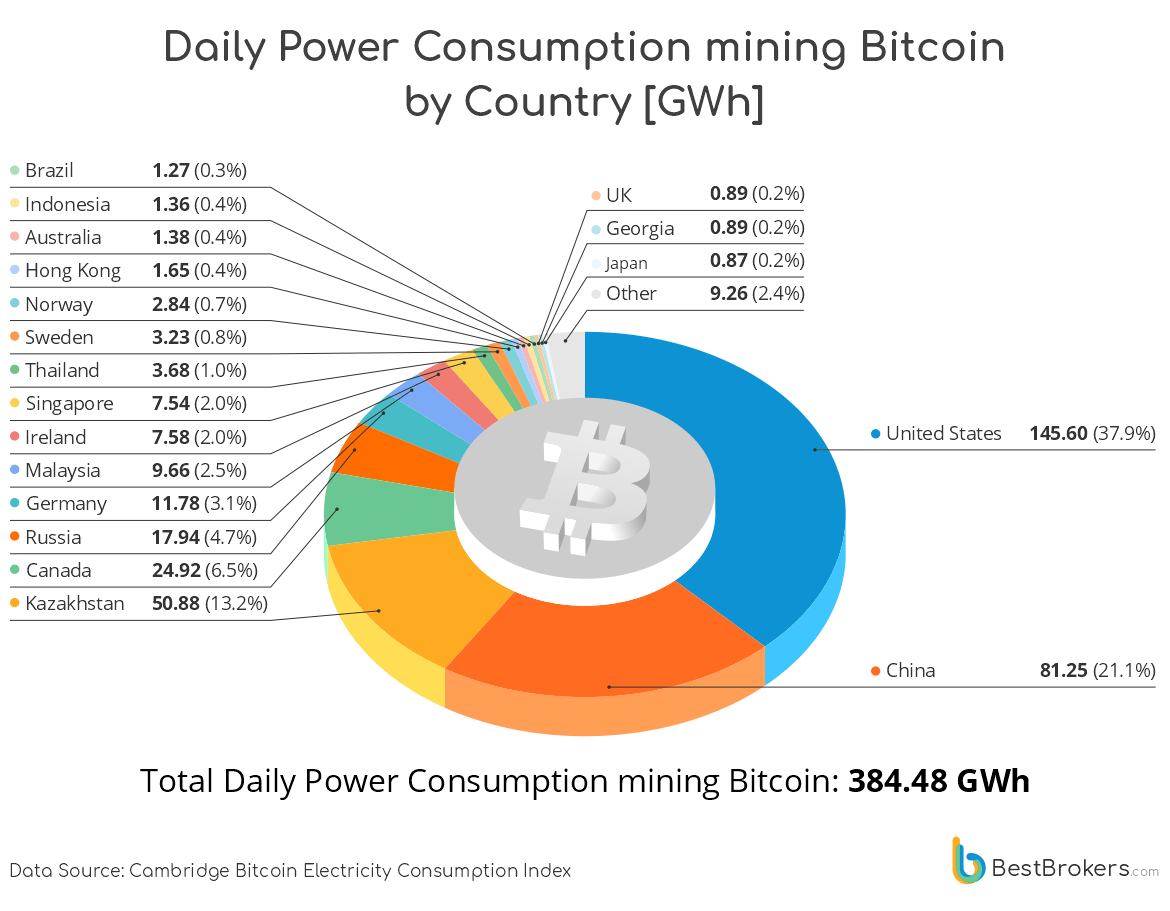
Currently there are 450 Bitcoins mined daily and this costs the mining facilities a whopping 384,481,670 kWh of electrical power. This comes at 140,336 GWh yearly and is more than the annual electricity consumption of most countries, save for the 26 most power-consuming ones.
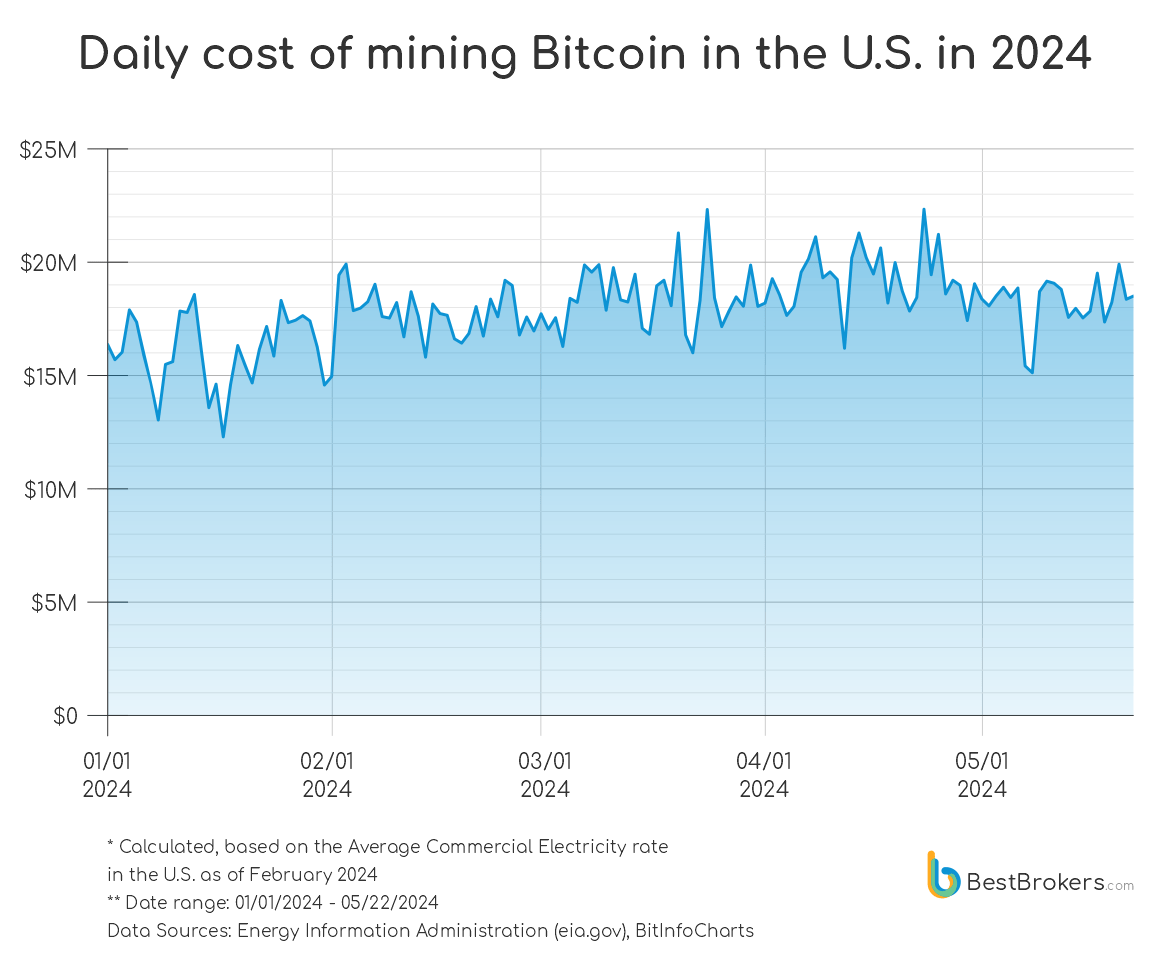
Mining facilities, based in the U.S. are responsible for the major share of this global production at 37.9% or 145.6 million kWh daily. This enormous amount results in just 170.41 BTC mined per 24 hours and if we take the U.S. average business electricity rate of $0.1281 per kWh as of February 2024 (latest data from eia.gov), this would mean $18.65M are spent daily on electricity alone.
When this power expenditure was resulting in 340.82 BTC mined up until 20 April 2024 before the halving, it was still economically feasible to mine Bitcoin in the U.S. by using grid power entirely. This is no longer the case and the fact the U.S. mining facilities are still operational points to the notion that they are relying mostly on their own renewable energy sources and/or have special deals with suppliers.
Detailed breakdown of mining costs in the U.S. in 2024
We pulled historical Blockchain hashrate data from BitInfoCharts and combined it with the most recent data on the geographic distribution of the Bitcoin network’s computing power from the Cambridge Bitcoin Electricity Consumption Index. This, together with the average efficiency of the current Bitcoin mining hardware, allowed us to calculate the total amount of electric energy used to mine bitcoin in the U.S. in 2024 and what that would have cost if the electricity were purchased from the grid suppliers at the average business rate (data from EIA).
Here is a detailed breakdown of the daily cost of mining Bitcoin in the U.S. in 2024 so far:
This has been the daily cost of mining 1 BTC in the U.S. in 2024. We can see clearly how it doubles after the halving in April.
Putting this in perspective
The daily consumption of 145.6 GWh for Bitcoin mining in the U.S. is about 1.34% of the total daily power consumption in the country. Despite the small percentage this is still an enormous amount of electricity, keeping in mind that the U.S. is a heavily-industrialized country and is consuming a lot. When we extrapolate this daily consumption to a year, we get 53,144 GWh. This would be enough for:
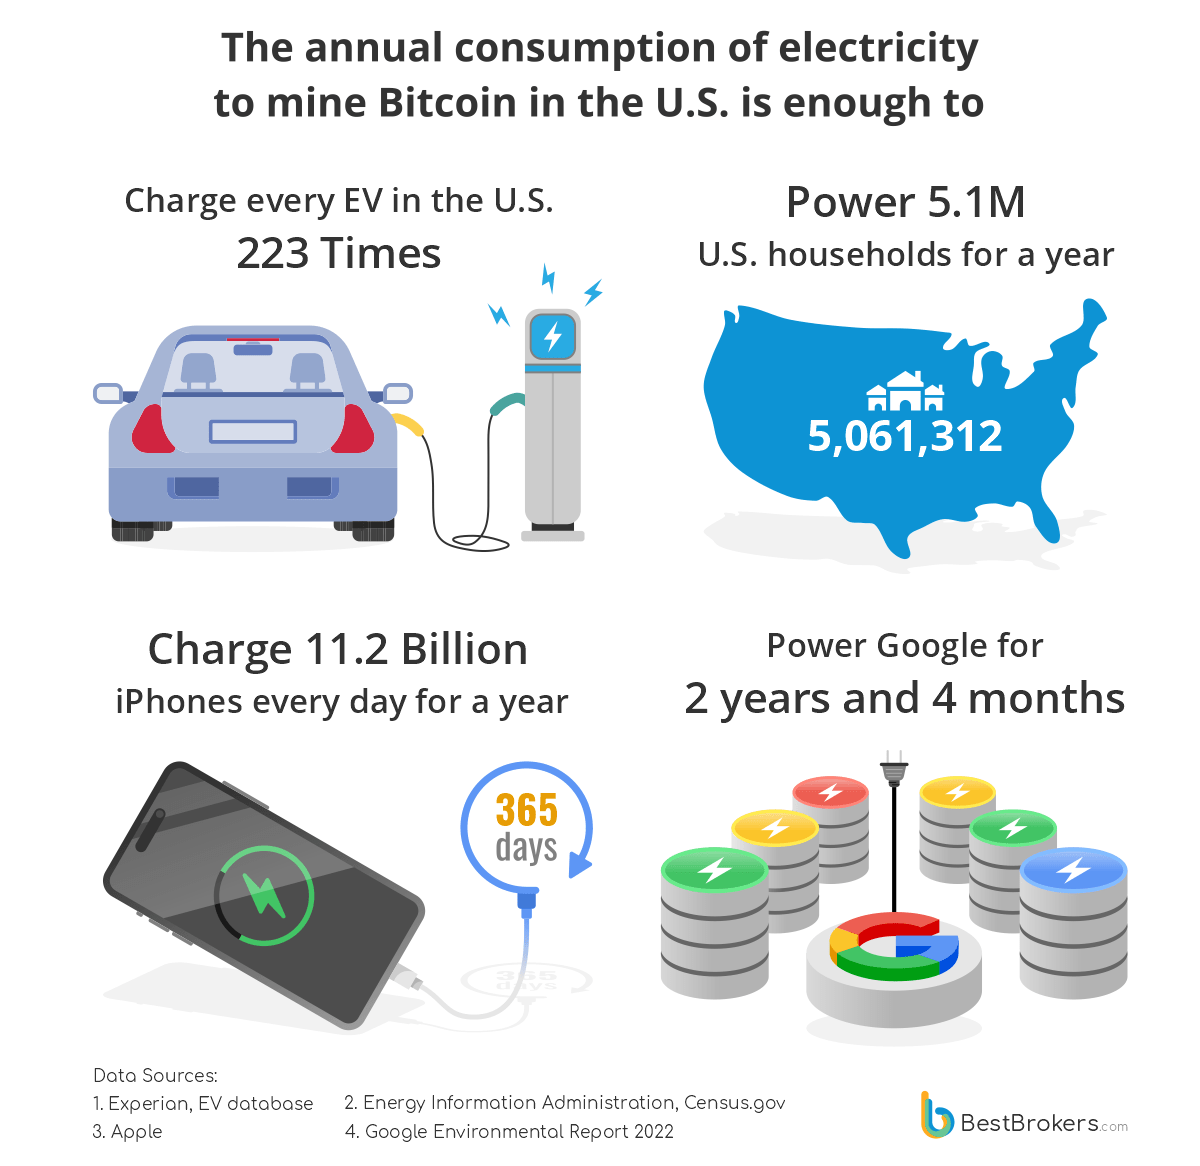
Charge every EV in the U.S. 223 times
According to the Experian Automotive Market Trends report there are 3.3 million EVs in the U.S. as per Q4 2023 data. The EV database estimates the average EV battery capacity to be 72.1 kWh. Thus, we can calculate that charging every EV in the U.S. once would consume 237.93 GWh:
3,300,000 × 72.1 = 237,930,000 kWh = 237.93 GWh
When we divide the total yearly consumption for Bitcoin mining in the U.S. by this number, we can see that we can charge every EV in the U.S. 223 times:
53,143.78 / 237.93 = 223.36
Power 5.1 million households for a year
According to the Energy Information Administration (EIA) the average U.S. household consumes 10,500 kWh annually. This would
53,143,775,890 / 10,500 = 5,061,312
As there are 131,434,000 households in the U.S. according to the latest Census data, this would mean Bitcoin mining in the U.S. could power 3.85% of all households.
Charge 11.2 billion iPhone’s daily for a year
The latest iPhone 15 has a battery capacity of 3349 mAh. At 3.7V this would come at 12.95 Wh per charge. Annually, this adds up to 4.73 kWh.
53,143,775,890 / 4.73 = 11,235,470,589.9 = 11.24B
Power the entire Google infrastructure for 2 years and 4 months
According to Google’s 2022 Environmental Report, the power consumption of Google is 22,288.8 GWh. This would mean the could power Google for over 2 years and 4 months:
53,143 / 22,288.8 = 2.38
The global picture
When we look at the global picture, we can see that China comes in second, accounting for 21.1% of the Total Electrical Power used for mining, despite the harsh regulations, limiting mining operations there. Kazakhstan notably sits at the third spot with 13.2% of the total mining hashrate. What is remarkable, is the fact that Kazakhstan uses 19.2% of their entire electricity consumption to mine Bitcoin.
Methodology
We took the most recent data on geographic distribution of the Bitcoin network’s computing power from the Cambridge Bitcoin Electricity Consumption Index and we extrapolated the current Bitcoin hashrate by Country based on the total network hashrate and the relative shares of the different countries.
Bitcoin mining hashrate is given in hashes per second (H/s) or multiples of that, as modern hardware is able to perform trillions of SHA-256 hashing operations per second or Terahashes per second (TH/s). These cryptographic operations are done using specialized mining hardware called an ASIC miner and are what keeps the entire Bitcoin network operational.
The efficiency of the ASIC miners is calculated in Joules per TH. It represents the amount of electrical energy in Joules to perform 1 trillion hashes.
1 Joule per second = 1 Watt = 0.001 Kilowatt.
To calculate exactly how much power is used to mine one Bitcoin, we took 5 of the most-common and currently economically-practical ASIC miners and calculated their average hashrate at 139.2 TH/s and average efficiency at 26.41 J/TH:
| Miner | Hashrate [TH/s] | Power Consumption [Wh] | Efficiency [J/TH] |
|---|---|---|---|
| Bitmain Antminer S19 Pro | 110 | 3250 | 29.55 |
| Bitmain Antminer S19 Pro+ Hyd | 198 | 5445 | 27.50 |
| Bitmain Antminer S19 XP | 140 | 3010 | 21.50 |
| Bitmain Antminer S19j Pro+ | 122 | 3355 | 27.50 |
| MicroBT Whatsminer M50S | 126 | 3276 | 26.00 |
| AVERAGE: | 139.2 | 3667 | 26.41 |
The way the Bitcoin blockchain works is the network automatically adjusts its difficulty based on the total network hashrate, so that a new block is mined every 10 minutes. Thus, there are 6 blocks mined per hour or 144 blocks mined every 24 hours. With the current block reward at 3.125 BTC this means 450 Bitcoins are mined globally on a daily basis.
When we know the total blockchain hashrate at the time of compiling this report is 606.59 EH/s (exahashes per second, 1 EH/s = 1,000,000 TH/s) we can calculate that at 26.41J/TH of average efficiency there are 606,590,000 x 26.41 = 16,020,041,900 Joules of electrical energy spent every second. This equals 16,020,041.9 kWh of electricity spent every hour. When we multiply this by 24 we get 384,481,670.41 kWh or 384.482 GWh spent daily on Bitcoin production. If we divide this by the 450 Bitcoins that are mined every day, we get an average of
854,403.71 kWh of electrical power to mine 1 Bitcoin
Raw Data
| Country | Hashrate [PH/s] | BTC mined / day | Power Consumption per hour [kWh] | Power Consumption per Day [GWh] | Power Consumption per Year [GWh] | Total Power Consumption [GWh] | Mining Consumption as % of Total Consumption |
|---|---|---|---|---|---|---|---|
| United States | 229,710.00 | 170.41 | 6,066,641.10 | 145.60 | 53,143.78 | 3,979,000 | 1.34% |
| China | 128,180.00 | 95.09 | 3,385,233.80 | 81.25 | 29,654.65 | 7,806,000 | 0.38% |
| Kazakhstan | 80,280.00 | 59.56 | 2,120,194.80 | 50.88 | 18,572.91 | 97,000 | 19.15% |
| Canada | 39,320.00 | 29.17 | 1,038,441.20 | 24.92 | 9,096.74 | 555,000 | 1.64% |
| Russia | 28,310.00 | 21.00 | 747,667.10 | 17.94 | 6,549.56 | 996,000 | 0.66% |
| Germany | 18,590.00 | 13.79 | 490,961.90 | 11.78 | 4,300.83 | 512,000 | 0.84% |
| Malaysia | 15,240.00 | 11.31 | 402,488.40 | 9.66 | 3,525.80 | 151,000 | 2.33% |
| Ireland | 11,960.00 | 8.87 | 315,863.60 | 7.58 | 2,766.97 | 33,000 | 8.38% |
| Singapore | 11,900.00 | 8.83 | 314,279.00 | 7.54 | 2,753.08 | 53,000 | 5.19% |
| Thailand | 5,810.00 | 4.31 | 153,442.10 | 3.68 | 1,344.15 | 203,000 | 0.66% |
| Sweden | 5,100.00 | 3.78 | 134,691.00 | 3.23 | 1,179.89 | 131,000 | 0.90% |
| Norway | 4,480.00 | 3.32 | 118,316.80 | 2.84 | 1,036.46 | 131,931 | 0.79% |
| Hong Kong | 2,610.00 | 1.94 | 68,930.10 | 1.65 | 603.83 | 46,000 | 1.31% |
| Australia | 2,170.00 | 1.61 | 57,309.70 | 1.38 | 502.03 | 237,000 | 0.21% |
| Indonesia | 2,150.00 | 1.59 | 56,781.50 | 1.36 | 497.41 | 282,000 | 0.18% |
| Brazil | 2,000.00 | 1.48 | 52,820.00 | 1.27 | 462.70 | 577,000 | 0.08% |
| United Kingdom | 1,400.00 | 1.04 | 36,974.00 | 0.89 | 323.89 | 287,000 | 0.11% |
| Georgia | 1,400.00 | 1.04 | 36,974.00 | 0.89 | 323.89 | 13,000 | 2.49% |
| Japan | 1,370.00 | 1.02 | 36,181.70 | 0.87 | 316.95 | 913,000 | 0.03% |
| Netherlands | 1,260.00 | 0.93 | 33,276.60 | 0.80 | 291.50 | 113,000 | 0.26% |
| France | 1,240.00 | 0.92 | 32,748.40 | 0.79 | 286.88 | 447,000 | 0.06% |
| Iceland | 959.61 | 0.71 | 25,343.30 | 0.61 | 222.01 | 19,000 | 1.17% |
| Ukraine | 909.56 | 0.67 | 24,021.48 | 0.58 | 210.43 | 134,000 | 0.16% |
| Paraguay | 896.93 | 0.67 | 23,687.92 | 0.57 | 207.51 | 7,700 | 2.69% |
| Venezuela | 854.70 | 0.63 | 22,572.63 | 0.54 | 197.74 | 71,000 | 0.28% |
| Libya | 849.97 | 0.63 | 22,447.71 | 0.54 | 196.64 | 27,000 | 0.73% |
| Iran | 756.83 | 0.56 | 19,987.88 | 0.48 | 175.09 | 302,000 | 0.06% |
| Italy | 664.97 | 0.49 | 17,561.86 | 0.42 | 153.84 | 300,000 | 0.05% |
| Mexico | 651.33 | 0.48 | 17,201.63 | 0.41 | 150.69 | 301,000 | 0.05% |
| Romania | 533.27 | 0.40 | 14,083.66 | 0.34 | 123.37 | 51,000 | 0.24% |
| South Korea | 452.78 | 0.34 | 11,957.92 | 0.29 | 104.75 | 568,000 | 0.02% |
| Argentina | 351.83 | 0.26 | 9,291.83 | 0.22 | 81.40 | 127,000 | 0.06% |
| Uzbekistan | 310.77 | 0.23 | 8,207.44 | 0.20 | 71.90 | 58,000 | 0.12% |
| Kuwait | 309.62 | 0.23 | 8,177.06 | 0.20 | 71.63 | 65,000 | 0.11% |
| Greece | 279.29 | 0.21 | 7,376.05 | 0.18 | 64.61 | 52,000 | 0.12% |
| Vietnam | 253.58 | 0.19 | 6,697.05 | 0.16 | 58.67 | 229,000 | 0.03% |
| Mongolia | 247.44 | 0.18 | 6,534.89 | 0.16 | 57.25 | 7,800 | 0.73% |
| Turkey | 244.16 | 0.18 | 6,448.27 | 0.15 | 56.49 | 284,000 | 0.02% |
| Estonia | 190.58 | 0.14 | 5,033.22 | 0.12 | 44.09 | 8,800 | 0.50% |
| Switzerland | 182.62 | 0.14 | 4,822.99 | 0.12 | 42.25 | 58,000 | 0.07% |
| Serbia | 181.11 | 0.13 | 4,783.12 | 0.11 | 41.90 | 31,000 | 0.14% |
| Hungary | 166.87 | 0.12 | 4,407.04 | 0.11 | 38.61 | 44,000 | 0.09% |
| India | 163.61 | 0.12 | 4,320.94 | 0.10 | 37.85 | 1,443,000 | 0.00% |
| Spain | 142.07 | 0.11 | 3,752.07 | 0.09 | 32.87 | 234,000 | 0.01% |
| Laos | 134.79 | 0.10 | 3,559.80 | 0.09 | 31.18 | 6,100 | 0.51% |
| Poland | 126.70 | 0.09 | 3,346.15 | 0.08 | 29.31 | 158,000 | 0.02% |
| Finland | 125.39 | 0.09 | 3,311.55 | 0.08 | 29.01 | 84,000 | 0.03% |
| Belarus | 121.11 | 0.09 | 3,198.52 | 0.08 | 28.02 | 41,000 | 0.07% |
| Egypt | 105.86 | 0.08 | 2,795.76 | 0.07 | 24.49 | 168,000 | 0.01% |
| Tajikistan | 97.37 | 0.07 | 2,571.54 | 0.06 | 22.53 | 16,000 | 0.14% |
| Oman | 78.64 | 0.06 | 2,076.88 | 0.05 | 18.19 | 33,000 | 0.06% |
| South Africa | 77.24 | 0.06 | 2,039.91 | 0.05 | 17.87 | 191,000 | 0.01% |
| Uruguay | 64.35 | 0.05 | 1,699.48 | 0.04 | 14.89 | 14,000 | 0.11% |
| Portugal | 60.84 | 0.05 | 1,606.78 | 0.04 | 14.08 | 48,000 | 0.03% |
| Colombia | 54.02 | 0.04 | 1,426.67 | 0.03 | 12.50 | 76,000 | 0.02% |
| Azerbaijan | 52.67 | 0.04 | 1,391.01 | 0.03 | 12.19 | 25,000 | 0.05% |
| Austria | 46.20 | 0.03 | 1,220.14 | 0.03 | 10.69 | 69,000 | 0.02% |
| Armenia | 45.29 | 0.03 | 1,196.11 | 0.03 | 10.48 | 6,100 | 0.17% |
| Bulgaria | 43.07 | 0.03 | 1,137.48 | 0.03 | 9.96 | 30,000 | 0.03% |
| Dominican Republic | 42.51 | 0.03 | 1,122.69 | 0.03 | 9.83 | 15,000 | 0.07% |
| Angola | 40.51 | 0.03 | 1,069.87 | 0.03 | 9.37 | 15,000 | 0.06% |
| Croatia | 34.90 | 0.03 | 921.71 | 0.02 | 8.07 | 16,000 | 0.05% |
| United Arab Emirates | 30.74 | 0.02 | 811.84 | 0.02 | 7.11 | 129,000 | 0.01% |
| Saudi Arabia | 30.44 | 0.02 | 803.92 | 0.02 | 7.04 | 329,000 | 0.00% |
| Czech Republic | 26.53 | 0.02 | 700.66 | 0.02 | 6.14 | 62,000 | 0.01% |
| Bangladesh | 26.15 | 0.02 | 690.62 | 0.02 | 6.05 | 78,000 | 0.01% |
| North Macedonia | 24.79 | 0.02 | 654.70 | 0.02 | 5.74 | 6,700 | 0.09% |
| Albania | 23.02 | 0.02 | 607.96 | 0.01 | 5.33 | 7,400 | 0.07% |
| Latvia | 17.91 | 0.01 | 473.00 | 0.01 | 4.14 | 6,900 | 0.06% |
| New Zealand | 17.52 | 0.01 | 462.70 | 0.01 | 4.05 | 41,000 | 0.01% |
| Denmark | 17.40 | 0.01 | 459.53 | 0.01 | 4.03 | 38,000 | 0.01% |
| Guatemala | 15.42 | 0.01 | 407.24 | 0.01 | 3.57 | 13,000 | 0.03% |
| Luxembourg | 13.08 | 0.01 | 345.44 | 0.01 | 3.03 | 6,500 | 0.05% |
| Costa Rica | 12.79 | 0.01 | 337.78 | 0.01 | 2.96 | 11,000 | 0.03% |
| Nigeria | 12.26 | 0.01 | 323.79 | 0.01 | 2.84 | 27,000 | 0.01% |
| Chile | 11.57 | 0.01 | 305.56 | 0.01 | 2.68 | 81,000 | 0.00% |
| Bosnia and Herzegovina | 10.27 | 0.01 | 271.23 | 0.01 | 2.38 | 11,000 | 0.02% |
| Morocco | 10.16 | 0.01 | 268.33 | 0.01 | 2.35 | 35,000 | 0.01% |
| Slovenia | 8.69 | 0.01 | 229.50 | 0.01 | 2.01 | 14,000 | 0.01% |
| Bhutan | 7.81 | 0.01 | 206.26 | <0.01 | 1.81 | 3,300 | 0.05% |
| Ecuador | 7.24 | 0.01 | 191.21 | <0.01 | 1.67 | 27,000 | 0.01% |
| Turkmenistan | 6.41 | <0.01 | 169.29 | <0.01 | 1.48 | 15,000 | 0.01% |
| Bolivia | 6.35 | <0.01 | 167.70 | <0.01 | 1.47 | 9,700 | 0.02% |
| Iraq | 6.13 | <0.01 | 161.89 | <0.01 | 1.42 | 53,000 | 0.00% |
| Sudan | 4.23 | <0.01 | 111.71 | <0.01 | 0.98 | 13,000 | 0.01% |
| Honduras | 4.14 | <0.01 | 109.34 | <0.01 | 0.96 | 8,200 | 0.01% |
| Sri Lanka | 4.12 | <0.01 | 108.81 | <0.01 | 0.95 | 15,000 | 0.01% |
| Israel | 3.48 | <0.01 | 91.91 | <0.01 | 0.81 | 63,000 | 0.00% |
| Cameroon | 3.39 | <0.01 | 89.53 | <0.01 | 0.78 | 6,100 | 0.01% |
| Myanmar | 3.35 | <0.01 | 88.47 | <0.01 | 0.78 | 17,000 | 0.00% |
| Panama | 2.88 | <0.01 | 76.06 | <0.01 | 0.67 | 9,500 | 0.01% |
| Kyrgyzstan | 2.84 | <0.01 | 75.00 | <0.01 | 0.66 | 12,000 | 0.01% |
| Algeria | 2.51 | <0.01 | 66.29 | <0.01 | 0.58 | 69,000 | 0.00% |
| Afghanistan | 2.43 | <0.01 | 64.18 | <0.01 | 0.56 | 5,500 | 0.01% |
| Moldova | 2.35 | <0.01 | 62.06 | <0.01 | 0.54 | 9,700 | 0.01% |
| Ghana | 2.20 | <0.01 | 58.10 | <0.01 | 0.51 | 18,000 | <0.01% |
| Philippines | 1.77 | <0.01 | 46.75 | <0.01 | 0.41 | 98,000 | <0.01% |
| Cambodia | 1.16 | <0.01 | 30.64 | <0.01 | 0.27 | 11,000 | <0.01% |
| Slovakia | 1.15 | <0.01 | 30.37 | <0.01 | 0.27 | 26,000 | <0.01% |
| Kenya | 0.93 | <0.01 | 24.44 | <0.01 | 0.21 | 9,100 | <0.01% |
| Peru | 0.86 | <0.01 | 22.83 | <0.01 | 0.20 | 52,000 | <0.01% |
| Pakistan | 0.86 | <0.01 | 22.61 | <0.01 | 0.20 | 132,000 | <0.01% |
| Zimbabwe | 0.75 | <0.01 | 19.74 | <0.01 | 0.17 | 8,300 | <0.01% |
| Montenegro | 0.57 | <0.01 | 15.03 | <0.01 | 0.13 | 2,900 | <0.01% |
| Ethiopia | 0.04 | <0.01 | 0.94 | <0.01 | 0.01 | 9,500 | <0.01% |
| Lithuania | 0.03 | <0.01 | 0.81 | <0.01 | 0.01 | 12,000 | <0.01% |
Power Consumption by Country data source
Total network hashrate data source