
As Bitcoin prices have swung sharply in early 2026, pulling back from late-2025 highs and showing increased volatility, the economics of mining are once again under pressure. Margins that briefly expanded during the last rally have tightened, particularly for independent miners facing high electricity costs. At the same time, the global hashrate, despite being historically high, has dropped sharply from the record levels it reached late last year – in December, it consistently hovered around and exceeded 1 zetahashes per second.
Following the Bitcoin Halving in 2024, block rewards remain structurally lower, forcing miners to rely more heavily on transaction fees and price appreciation to stay profitable. However, the price dips and uneven fee activity in 2026 have made revenue streams less predictable. Electricity has now firmly cemented itself as the dominant operating cost, and even short-term price corrections are enough to push less efficient miners toward breakeven – or below it. To see whether securing the Bitcoin network still justifies the energy it consumes, the team at BestBrokers decided to put into perspective the enormous amounts of electrical power used for mining Bitcoin globally.
We discovered that Bitcoin’s daily issuance of 450 coins comes with an immense energy cost: keeping the network running at its current pace requires more than 350 gigawatt-hours of electricity every single day, adding up to almost 128 terawatt-hours over the course of a year. That level of consumption rivals – and in many cases exceeds – the annual power demand of entire economies. Put simply, securing the Bitcoin network now requires electricity on a national scale.
Key Takeaways:
- Bitcoin mining facilities around the world consume 350.3 GWh of electricity every day just to mine a total of 450 BTC per day. This amounts to 128 TWh per year, exceeding the annual energy demands of nations like Sweden, Norway, or the Netherlands.
- U.S.-based miners are responsible for the largest share of energy consumption, requiring 132.6 GWh per 24 hours since they mine the most Bitcoins – an average of 170 BTC per day.
- The cost of electricity to mine 1 BTC has surged over the past two years in the U.S.: currently, it is above $106,000, while Bitcoin trades around $71,000.
Detailed Breakdown of Mining Costs in the U.S. in 2025
We pulled historical Blockchain hashrate data from Blockchain.com and combined it with the most recent data on the geographic distribution of the Bitcoin network’s computing power from the Cambridge Bitcoin Electricity Consumption Index and Chain Bulletin. This, together with the average efficiency of the current Bitcoin mining hardware, allowed us to calculate the total amount of electric energy used to mine Bitcoin in the U.S. right now and what that would have cost if the electricity were purchased from the grid suppliers at the average business rate ($0.1363 as of December 2025, data from EIA).
Here is a detailed breakdown of the daily cost of mining Bitcoin in the U.S. over the past year:
Daily Cost of Bitcoin Mining in the U.S. in 2026
Cost of energy for mining operations based on daily consumption and average monthly electricity price (commercial)
Sources: Blockchain.com, ChainBulletin, EIA
Over the past year, Bitcoin mining operations have consumed steadily increasing amounts of electricity. At the same time, rising power prices for commercial users have pushed operating costs higher, with daily electricity expenses for the sector reaching approximately $20-$23 million in November and December. In January, however, driven by lower BTC prices and various events such as weather-related shutdowns across the U.S., the global hashrate dropped, suggesting slower operations and overall lower profitability. In October, the average hashrate for the month exceeded 1,000 EH/s; in November, it was around 970 EH/s, and in December, it once again jumped to approximately 1,050 EH/s. Since January, the global hashrate has consistently stayed below 1,000, with temporary dips of 20% in some cases.
As of March 2026, mining 1 Bitcoin in the U.S. requires more than 750 kWh, which at $0.1363 (the latest available average price for businesses), costs approximately $106,135. The chart below clearly shows the declining profitability of Bitcoin mining in the U.S. We compared the daily costs of energy to mine 1 Bitcoin with the price of the cryptocurrency, which plummeted to roughly $65,000 in February.
Profitability Timeline: Cost of Mining 1 BTC in the U.S. vs. Bitcoin Price
Sources: Blockchain.com, ChainBulletin, EIA
Putting this into perspective
Bitcoin mining in the United States consumes approximately 132.6 GWh of electricity per day, which corresponds to about 1.1% of total daily U.S. electricity demand. While this share may appear modest in percentage terms, it represents a very large absolute volume of energy, particularly given that the United States is already one of the world’s most energy-intensive and highly industrialized economies.
When annualized, this daily consumption amounts to roughly 48,397 GWh per year, an energy footprint substantial enough to power entire sectors or serve as a meaningful point of comparison with other large-scale electricity uses, such as transportation electrification or residential demand.
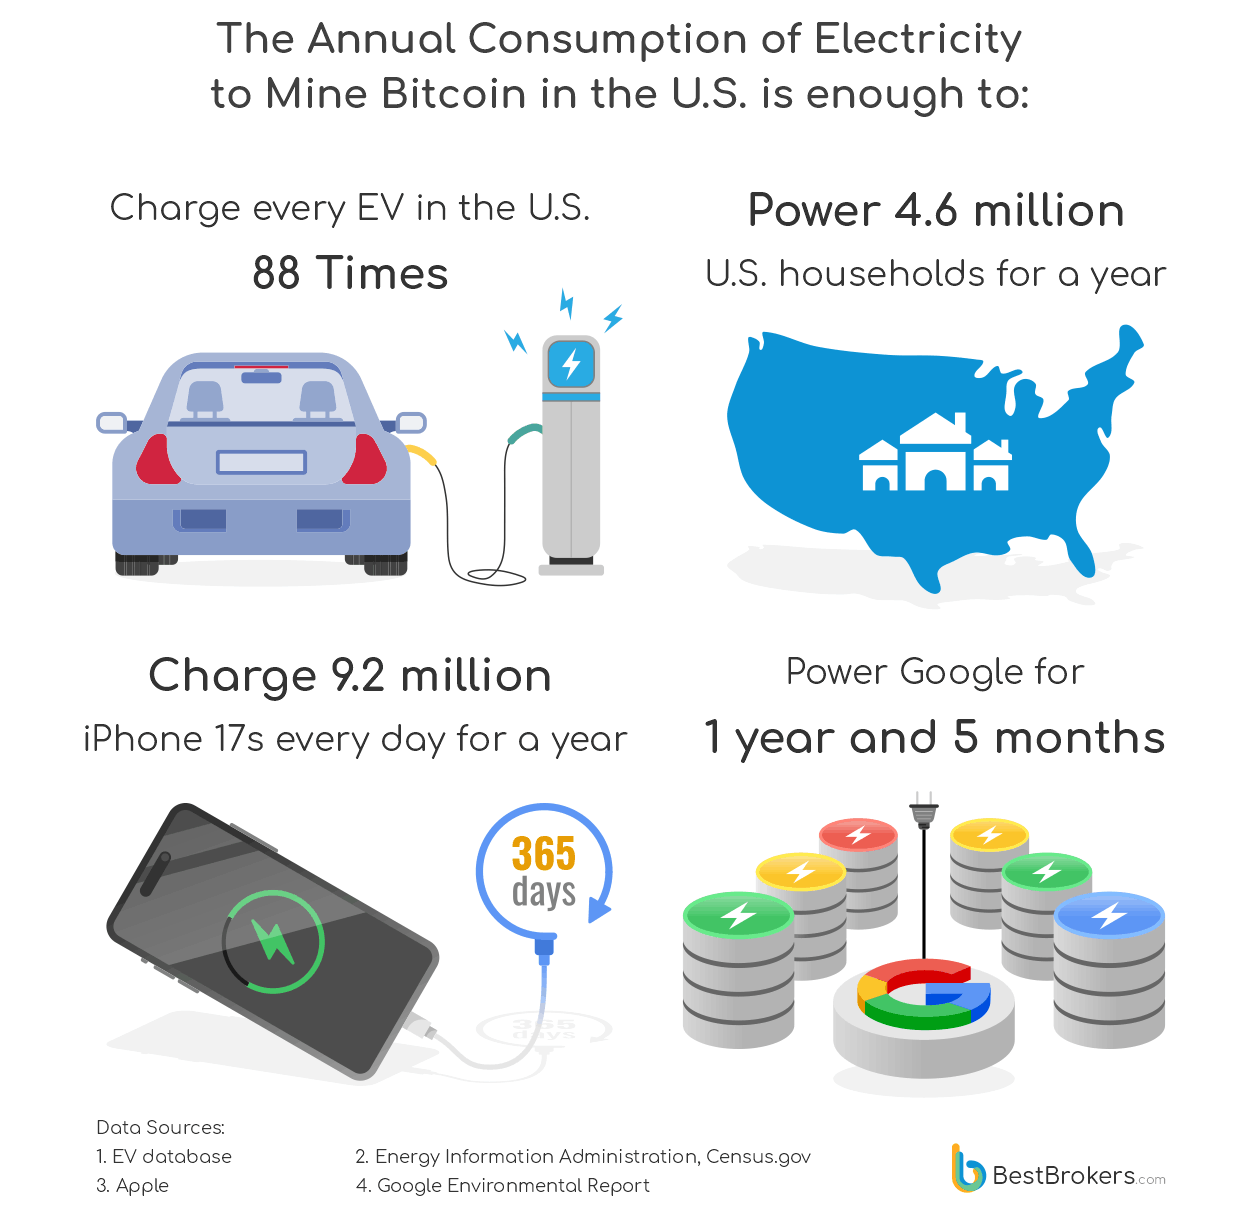
Charging Every EV on American Roads 126 Times
According to the International Energy Agency (IEA), there were approximately 6.3 million electric vehicles (EVs) in the United States at the beginning of 2025. With new EV sales reaching 1.2 million last year, the number of EVs on American roads should be close to 7.5 million. Based on EV Database estimates, the average EV battery capacity is 72.8 kWh. Multiplying these figures implies that a single full charge of the entire U.S. EV fleet would require about 546 GWh of electricity.
7,500,000 × 72.8 = 546,000,000 kWh = 546 GWh
Dividing the total annual electricity consumption of Bitcoin mining in the United States by this figure indicates that the same amount of energy could fully charge every electric vehicle in the country approximately 88 times over the course of a year.
48,397.25 ÷546 = 88.6 times
Powering U.S. households
According to the U.S. Energy Information Administration (EIA), the average American household consumes approximately 10,500 kWh of electricity per year. Using the estimated 48,397 GWh of annual electricity consumed by Bitcoin mining in the United States, this amount of energy could supply electricity to roughly:
48,397,246,667 kWh ÷ 10,500 kWh ≈ 4.6 million households
Based on the latest U.S. Census estimate of 132.6 million households, this implies that the electricity used for Bitcoin mining in the U.S. is equivalent to the annual power consumption of approximately 3.5% of all U.S. households.
Charging 9 billion iPhones daily for a year
The iPhone 17 has a battery capacity of 3,692 mAh. At a nominal voltage of 3.7 V, this corresponds to approximately 14.351 Wh per full charge. Charging one device once per day for an entire year therefore requires about 5.24 kWh. Dividing total annual Bitcoin mining electricity consumption by this figure yields:
48,397,246,667 kWh ÷ 5.24 kWh ≈ 9.24 billion
In other words, the electricity consumed by U.S. Bitcoin mining in a year could fully charge over 11 billion iPhones every day for an entire year.
Powering Google’s global operations
According to Google’s 2025 Environmental Report, the company’s global electricity consumption totaled 32,727.8 GWh in 2024. Comparing this to annual Bitcoin mining electricity use in the U.S. shows that:
48,397 GWh ÷ 32,727.8 GWh ≈ 1.5
This means that the electricity consumed by Bitcoin mining in the United States could power Google’s entire global infrastructure for 1 year and 9 months.
The Global Picture
At the global level, the United States accounts for approximately 38% of the total mining operations, and therefore, of the entire electricity consumption associated with Bitcoin mining, making it the largest user worldwide. China follows in second place, representing around 21.2% of global electricity use for Bitcoin mining, despite the presence of regulatory restrictions that limit mining activity within the country.
Daily Energy Needs for BTC Mining by Country
Total Daily Energy Consumption for Mining Bitcoin: 417.18 GWh
Sources: Cambridge Bitcoin Electricity Consumption Index, ChainBulletin
Kazakhstan ranks third, contributing roughly 13.2% of the global Bitcoin hashrate and mining-related power use. In relative terms, the electric consumption of mining operations (16.91 TWh) represents a significant share of the country’s electricity demand. It accounts for a staggering 14.1% of total national energy consumption, which distinguishes Kazakhstan from other major mining jurisdictions.
Methodology
We took the most recent data on geographic distribution of the Bitcoin network’s computing power from the Cambridge Bitcoin Electricity Consumption Index and ChainBulletin and we extrapolated the current Bitcoin hashrate by Country based on the total network hashrate and the relative shares of the different countries.
Bitcoin mining hashrate is given in hashes per second (H/s) or multiples of that, as modern hardware is able to perform trillions of SHA-256 hashing operations per second or Terahashes per second (TH/s). These cryptographic operations are done using specialized mining hardware called an ASIC miner and are what keep the entire Bitcoin network operational.
The efficiency of the ASIC miners is calculated in Joules per TH. It represents the amount of electrical energy in Joules to perform 1 trillion hashes.
1 Joule per second = 1 Watt = 0.001 Kilowatt.
To calculate exactly how much power is used to mine one Bitcoin, we took the 5 best (new and economically-effective) miners and calculated their average hashrate at 243 TH/s and average efficiency at 16.2 J/TH:
Average Efficiency of top 5 miners [J/TH], rough estimate, industry specs
| Miner model | Efficiency (J/TH) | Power (W) | Hashrate, TH/s |
|---|---|---|---|
| Antminer S21 | 17 | 3,500 | 200 |
| Antminer S21 XP | 15 | 3,600 | 240 |
| WhatsMiner M60S | 16 | 3,600 | 225 |
| WhatsMiner M66S++ | 15 | 5,500 | 360 |
| Avalon A1566 | 18 | 3,420 | 190 |
| Average efficiency | 16.20 | 3,924 | 243 |
The way the Bitcoin blockchain works is that the network automatically adjusts its difficulty based on the total network hashrate, so that a new block is mined every 10 minutes. Thus, there are 6 blocks mined per hour or 144 blocks mined every 24 hours. With the current block reward at 3.125 BTC, this means 450 Bitcoins are mined globally on a daily basis.
When we know the total blockchain hashrate at the time of compiling this report is 901.26 EH/s (exahashes per second, 1 ЕH/s = 1,000,000 TH/s), we can calculate that at 16.2 J/TH of average efficiency, there are 901,260,643.87 TH/s x 16.2 = 14,600,422,430.6 Joules of electrical energy spent every second. This equals 14.6 million kW of electricity spent every hour. When we multiply this by 24 and convert this massive number into gigawatt-hours, we get 350.41 GWh spent daily on Bitcoin production. If we divide this by the 450 Bitcoins that are mined every day, we get an average of
778,689.20 kWh of electrical power to mine 1 Bitcoin.
Bitcoin Mining by Country March 2026
| Country | Hashrate in PH/s | BTC Mined/Day | Power Consumption per hour [kWh] | Daily Mining Consumption [GWh] | Annual Energy Usage [GWh] | Mining % of Total Energy Usage |
| United States of America | 341,037 | 170.28 | 5,524,800 | 132.60 | 48,397 | 1.10% |
| China | 190,256 | 95.00 | 3,082,149 | 73.97 | 27,000 | 0.27% |
| Kazakhstan | 119,147 | 59.49 | 1,930,176 | 46.32 | 16,908 | 14.09% |
| Canada | 58,402 | 29.16 | 946,107 | 22.71 | 8,288 | 1.33% |
| Russian Federation | 41,999 | 20.97 | 680,380 | 16.33 | 5,960 | 0.51% |
| Germany | 27,579 | 13.77 | 446,773 | 10.72 | 3,914 | 0.75% |
| Malaysia | 22,622 | 11.30 | 366,471 | 8.80 | 3,210 | 1.63% |
| Ireland | 17,755 | 8.87 | 287,628 | 6.90 | 2,520 | 6.69% |
| Singapore | 17,665 | 8.82 | 286,168 | 6.87 | 2,507 | 4.20% |
| Thailand | 8,652 | 4.32 | 140,164 | 3.36 | 1,228 | 0.52% |
| Sweden | 7,571 | 3.78 | 122,644 | 2.94 | 1,074 | 0.78% |
| Norway | 6,669 | 3.33 | 108,043 | 2.59 | 946 | 0.69% |
| Hong Kong | 3,875 | 1.94 | 62,782 | 1.51 | 550 | 1.13% |
| Australia | 3,245 | 1.62 | 52,562 | 1.26 | 460 | 0.16% |
| Indonesia | 3,154 | 1.58 | 51,101 | 1.23 | 448 | 0.12% |
| Brazil | 2,974 | 1.49 | 48,181 | 1.16 | 422 | 0.06% |
| Georgia | 2,073 | 1.04 | 33,581 | 0.81 | 294 | 2.06% |
| United Kingdom | 2,073 | 1.04 | 33,581 | 0.81 | 294 | 0.09% |
| Japan | 2,073 | 1.04 | 33,581 | 0.81 | 294 | 0.03% |
| Netherlands | 1,893 | 0.95 | 30,661 | 0.74 | 269 | 0.22% |
| France | 1,893 | 0.95 | 30,661 | 0.74 | 269 | 0.06% |
| Iceland | 1,442 | 0.72 | 23,361 | 0.56 | 205 | 1.07% |
| Paraguay | 1,352 | 0.68 | 21,901 | 0.53 | 192 | 0.73% |
| Ukraine | 1,352 | 0.68 | 21,901 | 0.53 | 192 | 0.21% |
| Venezuela | 1,262 | 0.63 | 20,441 | 0.49 | 179 | 0.22% |
| Libya | 1,262 | 0.63 | 20,441 | 0.49 | 179 | 0.52% |
| Iran | 1,082 | 0.54 | 17,521 | 0.42 | 153 | 0.04% |
| Italy | 991 | 0.50 | 16,060 | 0.39 | 141 | 0.05% |
| Mexico | 991 | 0.50 | 16,060 | 0.39 | 141 | 0.04% |
| Romania | 811 | 0.41 | 13,140 | 0.32 | 115 | 0.21% |
| South Korea | 673 | 0.34 | 10,895 | 0.26 | 95 | 0.02% |
| Argentina | 523 | 0.26 | 8,466 | 0.20 | 74 | 0.05% |
| Uzbekistan | 462 | 0.23 | 7,478 | 0.18 | 66 | 0.08% |
| Kuwait | 460 | 0.23 | 7,450 | 0.18 | 65 | 0.07% |
| Greece | 415 | 0.21 | 6,720 | 0.16 | 59 | 0.11% |
| Viet Nam | 377 | 0.19 | 6,102 | 0.15 | 53 | 0.02% |
| Mongolia | 368 | 0.18 | 5,954 | 0.14 | 52 | 0.45% |
| Turkey | 363 | 0.18 | 5,875 | 0.14 | 51 | 0.01% |
| Switzerland | 290 | 0.14 | 4,702 | 0.11 | 41 | 0.06% |
| Estonia | 283 | 0.14 | 4,586 | 0.11 | 40 | 0.43% |
| Serbia | 269 | 0.13 | 4,358 | 0.10 | 38 | 0.10% |
| Hungary | 248 | 0.12 | 4,015 | 0.10 | 35 | 0.07% |
| India | 243 | 0.12 | 3,937 | 0.09 | 34 | 0.00% |
| Spain | 211 | 0.11 | 3,418 | 0.08 | 30 | 0.01% |
| Laos | 200 | 0.10 | 3,243 | 0.08 | 28 | 0.18% |
| Poland | 188 | 0.09 | 3,049 | 0.07 | 27 | 0.02% |
| Finland | 186 | 0.09 | 3,017 | 0.07 | 26 | 0.03% |
| Belarus | 180 | 0.09 | 2,914 | 0.07 | 26 | 0.06% |
| Egypt | 157 | 0.08 | 2,547 | 0.06 | 22 | 0.01% |
| Tajikistan | 145 | 0.07 | 2,343 | 0.06 | 21 | 0.10% |
| Belgium | 134 | 0.07 | 2,173 | 0.05 | 19 | 0.02% |
| Oman | 117 | 0.06 | 1,892 | 0.05 | 17 | 0.03% |
| South Africa | 115 | 0.06 | 1,858 | 0.04 | 16 | 0.01% |
| Uruguay | 96 | 0.05 | 1,548 | 0.04 | 14 | 0.09% |
| Portugal | 90 | 0.05 | 1,464 | 0.04 | 13 | 0.02% |
| Colombia | 80 | 0.04 | 1,300 | 0.03 | 11 | 0.01% |
| Colombia | 80 | 0.04 | 1,300 | 0.03 | 11 | 0.01% |
| Azerbaijan | 78 | 0.04 | 1,267 | 0.03 | 11 | 0.04% |
| Austria | 69 | 0.03 | 1,112 | 0.03 | 10 | 0.01% |
| Armenia | 67 | 0.03 | 1,090 | 0.03 | 10 | 0.12% |
| Bulgaria | 64 | 0.03 | 1,036 | 0.02 | 9.1 | 0.02% |
| Dominican Republic | 63 | 0.03 | 1,023 | 0.02 | 9.0 | 0.04% |
| Angola | 60 | 0.03 | 975 | 0.02 | 8.5 | 0.05% |
| Croatia | 52 | 0.03 | 840 | 0.02 | 7.4 | 0.04% |
| UAE | 46 | 0.02 | 740 | 0.02 | 6.5 | 0.00% |
| Saudi Arabia | 45 | 0.02 | 733 | 0.02 | 6.4 | 0.00% |
| Czechia | 39 | 0.02 | 638 | 0.02 | 5.6 | 0.01% |
| Bangladesh | 39 | 0.02 | 629 | 0.02 | 5.5 | 0.00% |
| North Macedonia | 37 | 0.02 | 596 | 0.01 | 5.2 | 0.06% |
| Albania | 35 | 0.02 | 559 | 0.01 | 4.9 | 0.06% |
| Latvia | 27 | 0.01 | 431 | 0.01 | 3.8 | 0.05% |
| New Zealand | 26 | 0.01 | 422 | 0.01 | 3.7 | 0.01% |
| Denmark | 26 | 0.01 | 419 | 0.01 | 3.7 | 0.01% |
| Guatemala | 23 | 0.01 | 371 | 0.01 | 3.3 | 0.02% |
| Luxembourg | 19 | 0.01 | 315 | 0.01 | 2.8 | 0.04% |
| Costa Rica | 19 | 0.01 | 308 | 0.01 | 2.7 | 0.02% |
| Nigeria | 18 | 0.01 | 295 | 0.01 | 2.6 | 0.01% |
| Bosnia and Herzrgovina | 15 | 0.01 | 247 | 0.01 | 2.2 | 0.02% |
| Morocco | 15 | 0.01 | 245 | 0.01 | 2.1 | 0.00% |
| Slovenia | 13 | 0.01 | 209 | 0.01 | 1.8 | 0.01% |
| Lebanon | 12 | 0.01 | 192 | 0.005 | 1.7 | 0.03% |
| Bhutan | 12 | 0.01 | 188 | 0.005 | 1.6 | 0.01% |
| Ecuador | 11 | 0.01 | 174 | 0.004 | 1.5 | 0.00% |
| Turkmenistan | 10 | 0.005 | 154 | 0.004 | 1.4 | 0.01% |
| Cyprus | 9 | 0.005 | 153 | 0.004 | 1.3 | 0.02% |
| Bolivia | 9 | 0.005 | 153 | 0.004 | 1.3 | 0.01% |
| Iraq | 9 | 0.005 | 148 | 0.004 | 1.3 | 0.00% |
| Sudan | 6 | 0.003 | 102 | 0.002 | 0.9 | 0.01% |
| Honduras | 6 | 0.003 | 99.74 | 0.002 | 0.9 | 0.01% |
| Sri Lanka | 6 | 0.003 | 99.31 | 0.002 | 0.9 | 0.01% |
| Israel | 5 | 0.003 | 83.85 | 0.002 | 0.7 | 0.00% |
| Cameroon | 5 | 0.003 | 81.58 | 0.002 | 0.7 | 0.01% |
| Myanmar | 5 | 0.002 | 80.59 | 0.002 | 0.7 | 0.00% |
| Lithuania | 5 | 0.002 | 73.78 | 0.002 | 0.6 | 0.01% |
| El Salvador | 4 | 0.002 | 71.93 | 0.002 | 0.6 | 0.01% |
| panama | 4 | 0.002 | 69.38 | 0.002 | 0.6 | 0.00% |
| Kyrgyzstan | 4 | 0.002 | 68.39 | 0.002 | 0.6 | 0.00% |
| Algeria | 4 | 0.002 | 60.30 | 0.001 | 0.5 | 0.00% |
| Afghanistan | 4 | 0.002 | 58.45 | 0.001 | 0.5 | 0.01% |
| Moldova | 3 | 0.002 | 56.61 | 0.001 | 0.5 | 0.01% |
| Ghana | 3 | 0.002 | 52.92 | 0.001 | 0.5 | 0.00% |
| Qatar | 2 | 0.001 | 33.91 | 0.001 | 0.3 | 0.00% |
| Cambodia | 2 | 0.001 | 27.95 | 0.001 | 0.2 | 0.00% |
| Slovakia | 2 | 0.001 | 27.67 | 0.001 | 0.2 | 0.00% |
| Kenya | 1 | 0.001 | 22.27 | 0.001 | 0.2 | 0.00% |
| Peru | 1 | 0.001 | 20.86 | 0.001 | 0.2 | 0.00% |
| Pakistan | 1 | 0.001 | 20.57 | 0.0005 | 0.2 | 0.00% |
| Zimbabwe | 1 | 0.001 | 18.02 | 0.0004 | 0.2 | 0.00% |
| Montenegro | 1 | 0.00042 | 13.70 | 0.0003 | 0.1 | 0.00% |
| Ethiopia | 0.05 | 0.0000264 | 0.86 | 0.00002 | 0.01 | 0.00% |
| DR Congo | 0.0003 | 0.0000002 | 0.01 | 0.0000001 | 0.00005 | 0.00% |
Source: EIA