
Over the past two decades, the U.S. labor market has weathered financial crises, industrial restructuring, and structural shifts in employment, repeatedly rebalancing after periods of disruption. The pandemic marked the most severe shock to the labor market in modern history, followed by an equally sharp rebound. By April 2022, the United States had 6.3 million more open jobs than unemployed workers, as hiring surged across nearly every sector and the competition for talent intensified.
Five years later, conditions have largely stabilized. But the balance has not returned evenly. Some states continue to run persistent labor shortages, while others maintain large surpluses of unemployed workers relative to job openings. To understand where the labor market stands today, the team at BestBrokers analyzed the latest data from the U.S. Chamber of Commerce Workforce Data Center and the Bureau of Labor Statistics’ Job Openings and Labor Turnover Survey (JOLTS), covering the period from January 2020 through March 2026. We mapped the Available Worker Ratio, the number of unemployed workers per open job, across all 50 states and across major industry sectors, tracking how the balance between labor supply and demand has shifted since before the pandemic.
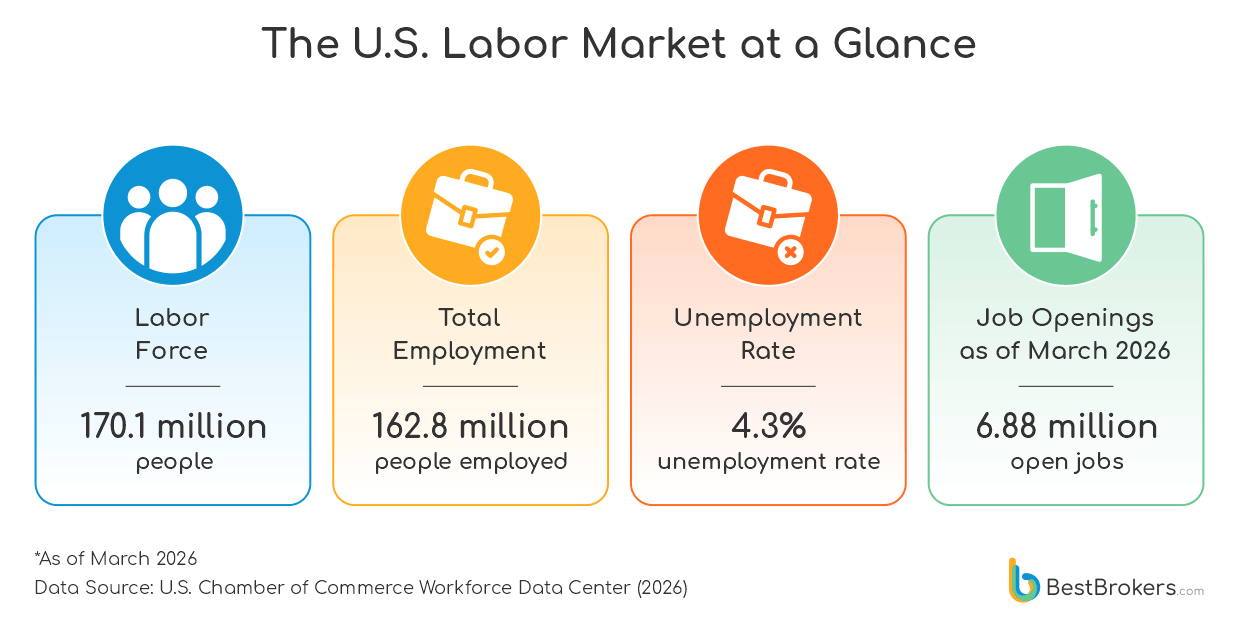
America’s Workforce in March 2026
As of March 2026, the United States labor force stood at 170.1 million people, of which 162.8 million were employed. Unemployment sat at 4.3%, a figure that by historical standards signals a healthy market. There were 6.88 million open jobs nationwide, and after years in which open positions vastly outnumbered available workers, the ratio has returned to near-equilibrium, with 105 workers for every 100 open positions. On paper, that is exactly what a stable labor market looks like.
The reality is more complicated. In 2025, more than a million people lost their jobs across the U.S. In the tech industry alone, American companies have already laid off 74,092 workers in the first months of 2026. Federal workforce reductions, AI-driven restructuring, and two years of tariff-related cost pressures have made job security feel fragile even for people who are not in the most vulnerable industries. The quit rate can be seen as a reflection of this unease, cooled to 1.9% in early 2026, well below both the 3.0% peak of the Great Resignation era and the pre-pandemic baseline of 2.3%. Workers are holding on to the jobs they have. In a market where layoff announcements are a permanent fixture of the morning news, that is a clear sign that nobody wants to be the one who jumped right before the music stopped.
The Changing Balance Between Job Openings and Unemployment Since 2020
It would not be an understatement to claim that the past six years have been the most turbulent period for the American labor market since the Great Depression. In April 2020, unemployment surged to 23 million people almost overnight as pandemic lockdowns shut down large parts of the economy, a collapse without modern precedent in both speed and scale. Job openings fell from 7.1 million in February to 4.6 million by May, as employers froze hiring.
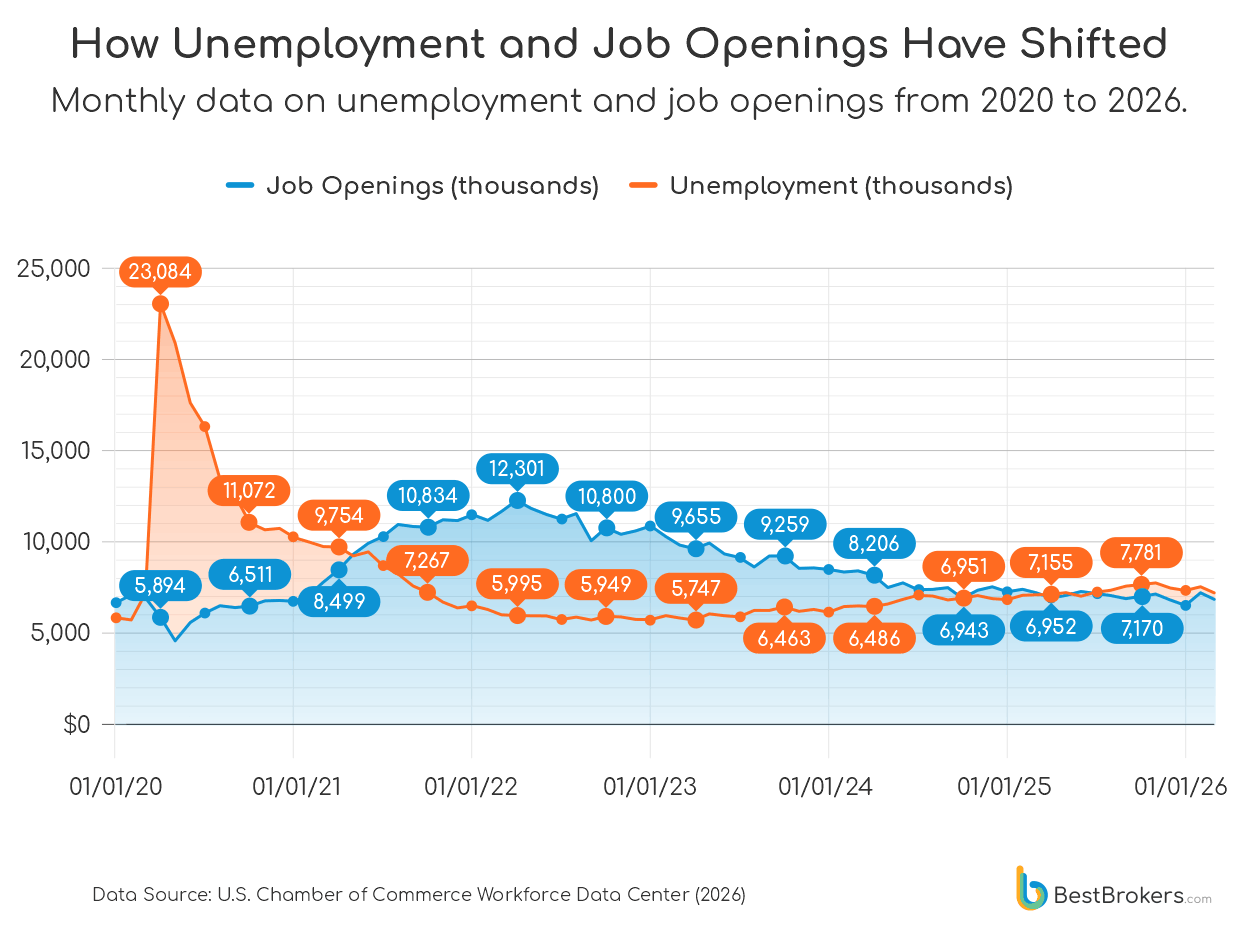
The recovery that followed was uneven. As stimulus flowed through the economy in 2021, demand for workers rebounded faster than supply. Job openings climbed month after month, while unemployment declined more gradually, held back by health concerns, childcare disruptions, and a wave of early retirements. By April 2022, job openings peaked at 12.3 million against just 6 million unemployed workers, a gap of more than 6 million that drove wage growth and intensified competition for labor. Employers competed openly for staff, signing bonuses appeared in sectors that had never offered them, and the quit rate hit 3.0% as workers leveraged their bargaining power to jump to better-paying roles.
The response was swift. To contain inflation, the Federal Reserve launched the most aggressive rate-hiking cycle in four decades, gradually cooling both demand and hiring. Job openings declined steadily from over 11 million in early 2023 to around 8.5 million by early 2024, and continued falling toward 7 million through 2025. Unemployment, meanwhile, edged higher only modestly, rising from 6 million people in 2022 to roughly 7 million through 2025. The imbalance that once defined the labor market slowly disappeared. By March 2026, job openings stood at 6.9 million against 7.2 million unemployed workers, marking a return to stability for the first time since before the pandemic.
But this state of balance does not necessarily equal a healthy labor market. The convergence was a result of both falling unemployment and shrinking demand. Employers didn’t just fill roles; many stopped posting them altogether as borrowing costs rose and growth slowed, with early 2026 job openings falling by more than 5 million from their 2022 peak. At the same time, millions who left the labor force during the pandemic remain absent from headline unemployment figures. The result is a market being pulled from both sides: fewer available workers, and softer demand shaped by costs and automation.
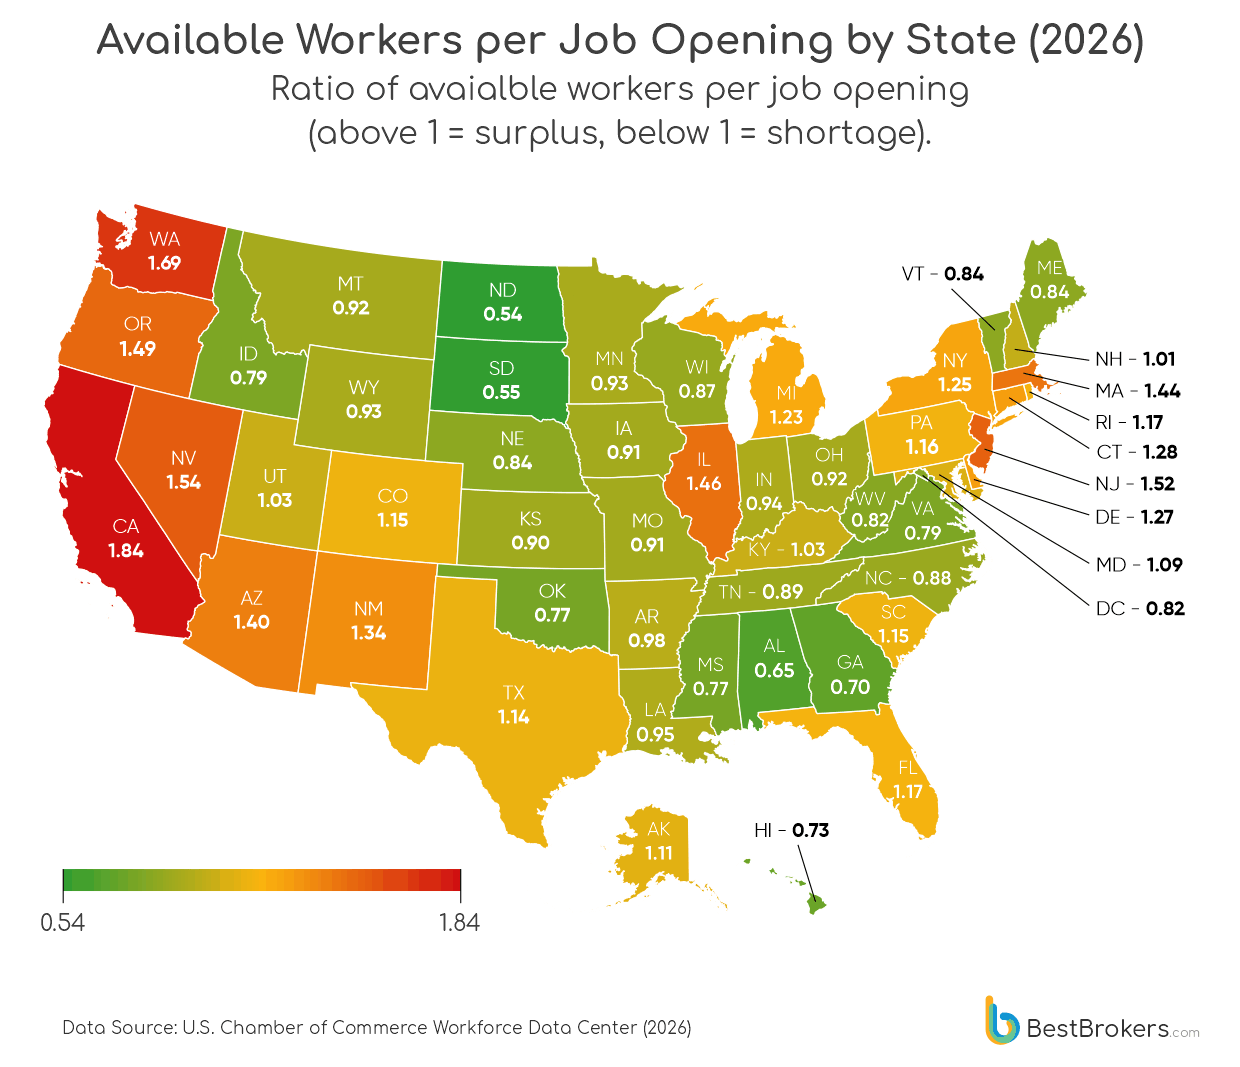
Unemployed Workers Per Job Opening Across All 50 States
The Great Plains, Mountain West, and parts of the South are running the most severe labor shortages in the country, with the most extreme cases, like North Dakota and South Dakota, falling below six unemployed workers for every ten open positions. On the other end of the spectrum, the Pacific Coast and parts of the Northeast tell the opposite story, with California and Washington sitting among the largest labor surpluses in the nation.
According to a study by Atlas Van Lines, states like Iowa, Nebraska, South Dakota, and Wyoming, all running severe worker shortages, are actually among the highest outbound migration states in the country. People are leaving precisely the places that need them most, and they are not heading to California or Washington to compete for scarce jobs; instead, they are moving to more affordable Southern states like South Carolina, North Carolina, and Tennessee, chasing lower living costs rather than better labor market odds.
On the other hand, California’s large labor surplus is a direct result of a labor market that has been unable to absorb everyone competing within it, compounded by tech layoffs that have concentrated heavily on the coasts and flooded the market with highly skilled workers who have not yet found their footing.
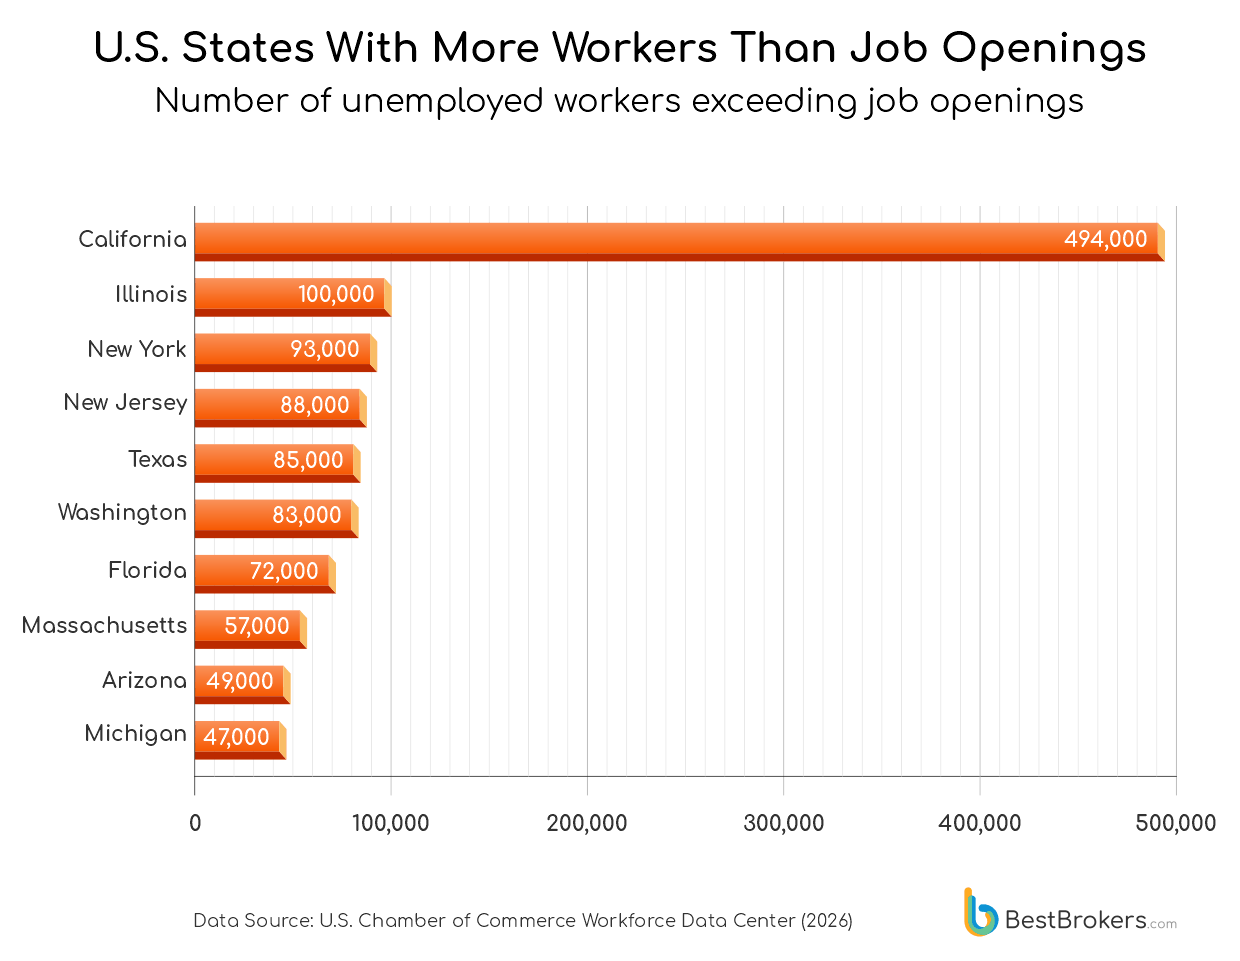
California has the largest gap between unemployed workers and open jobs in the U.S., with a surplus of 494,000 workers, nearly five times higher than Illinois, which ranks second at 100,000. While population size contributes to this gap, it does not fully explain it. California’s tech-heavy economy has undergone significant restructuring between 2022 and 2025, as companies cut roles following pandemic-era hiring booms and shifted toward AI-driven operations. This has increased competition among highly skilled workers, particularly in software engineering, machine learning, and data infrastructure roles. With significant surpluses of 93,000 and 88,000 more unemployed workers than open job postings, New York and New Jersey also reflect the same underlying issue, just at a smaller scale.
Nevada is the state with the fourth-highest workforce surplus, with 83,000 more workers than open jobs, a number that is striking for a state with a relatively small population. Its unemployment rate has consistently run above the national average since 2007, and the heavy dependence on Las Vegas hospitality and tourism makes its labor market unusually sensitive to swings in consumer spending. As tariffs and inflation have weighed on discretionary spending, the leisure and hospitality sector, which accounts for a disproportionate share of Nevada’s jobs, has pulled back on hiring, leaving a larger pool of workers with fewer openings to fill.
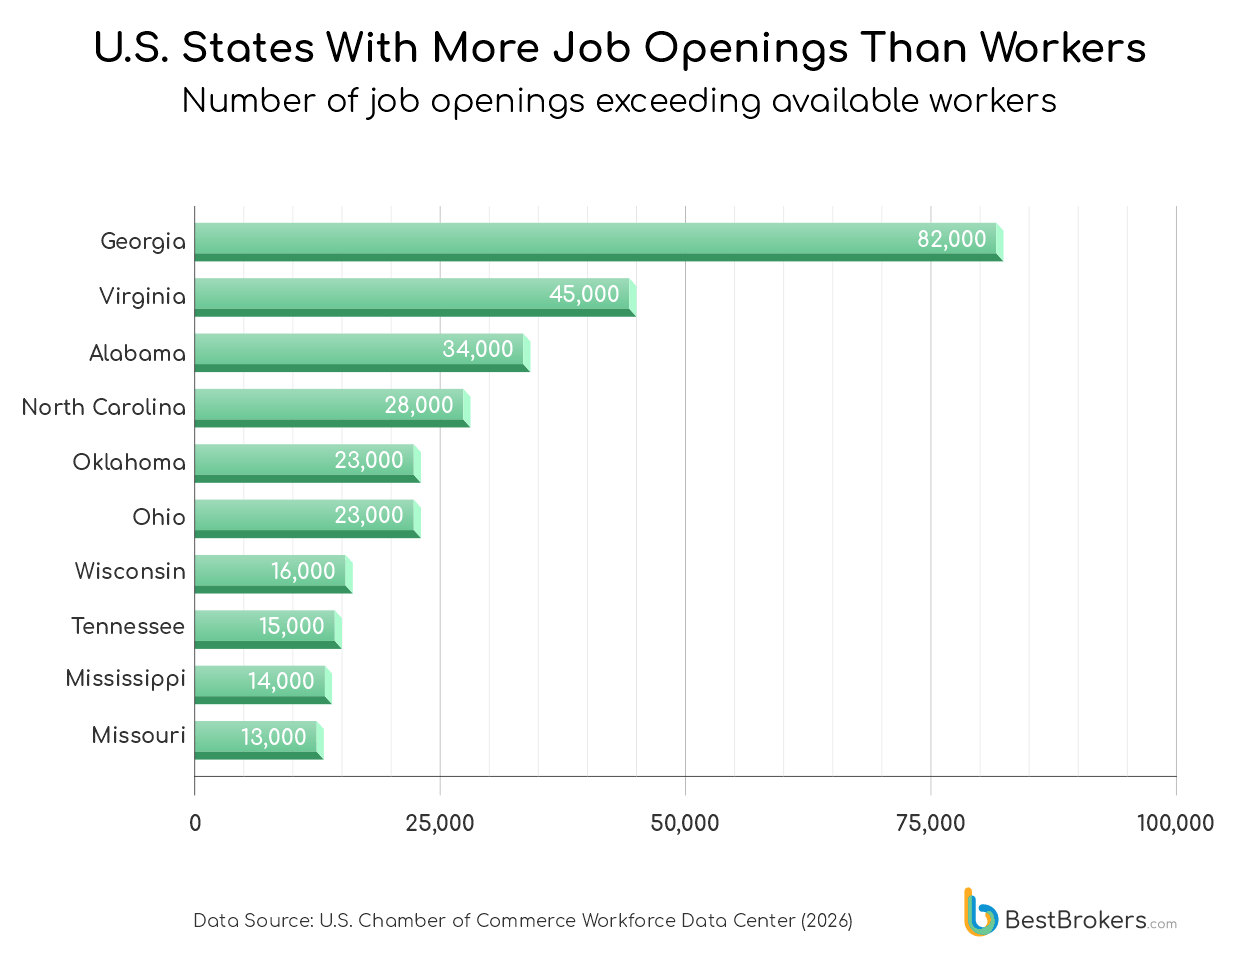
Georgia is the state with the largest worker shortage in the country, with 82,000 more open positions than unemployed workers. The data might suggest that the state is currently experiencing a severe economic decline, but that is simply not true. Georgia has been one of the most actively courted business destinations in the U.S., attracting major investment in logistics, film production, advanced manufacturing, and electric vehicle supply chains. The problem is that job creation has consistently outpaced workforce development. According to Georgia Trend Magazine, significant shortages in advanced manufacturing, logistics, and healthcare were already emerging well before the pandemic; it simply accelerated a structural gap that had been building for years. Georgia’s labor force participation rate has been declining steadily since 2004, and over a million workers are expected to retire from key industries by 2025, with no clear pipeline to replace them.
Oklahoma’s shortfall of 23,000 workers tells a different story. The state’s economy is heavily tied to oil and gas, an industry that has been shedding jobs steadily. Oklahoma’s energy employment fell from nearly 50,000 in early 2025 to under 48,000 by early 2026. The problem is not that Oklahoma has too many oil jobs and not enough workers; it is that the industry requires highly specialized technical skills, production engineers, drilling engineers, operations managers, that take years to develop, and younger workers have increasingly shown little interest in pursuing careers in fossil fuels. Roles in Oklahoma City and Tulsa that would have filled within two months are now taking nearly four.
Wisconsin’s 16,000-worker shortage is a problem that has been building for decades. Manufacturing accounts for over 16% of total state employment, second in the nation only to Indiana, where nearly a quarter of all jobs are in manufacturing. However, the sector has been shedding jobs since 2000, even as output has grown, driven by automation and process efficiency. The workers who remain in Wisconsin’s manufacturing sector are aging, and the pipeline of younger replacements is thin. Young people in the state are increasingly pursuing careers in industries that feel more future-proof than factory floors, where people have been replaced by machines for a generation.
Virginia (45,000), Alabama (34,000), North Carolina (28,000), Ohio (23,000), Tennessee (15,000), Mississippi (14,000), and Missouri (13,000) round out the list of states facing labor shortages, largely concentrated in the South and Midwest, where demographic pressures, skills mismatches, and structural shifts in industry have left job openings consistently outpacing unemployed workers.
Which Sectors Are Still Waiting for the Labor Market to Catch Up
In early 2026, Construction showed the highest level of unemployed workers relative to open job listings, at 3.46. On paper, that suggests a surplus of labor. In reality, the picture is much more nuanced. Workers in the construction industry are spread across roles that don’t directly match what contractors need most right now, especially skilled trades like electricians, plumbers, and pipefitters. At the same time, the industry is heading toward a major demographic shift, with roughly 41% of the workforce expected to retire by 2031 and not enough new workers entering the pipeline to replace them. So while the numbers suggest excess labor and people unable to find jobs, the reality is a tightening workforce that is already under strain.
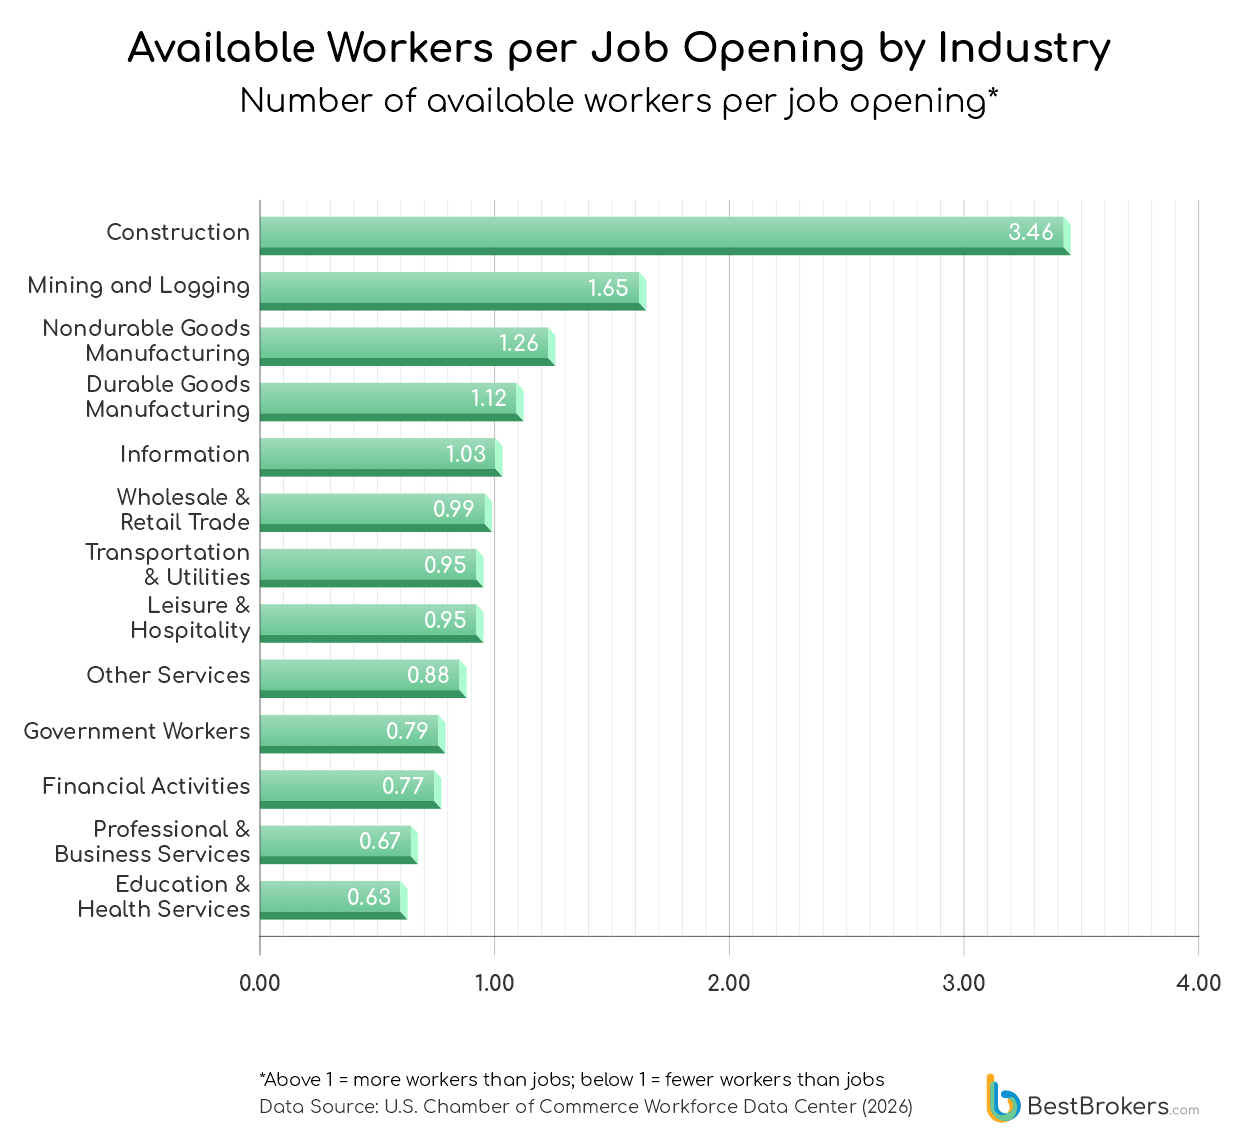
At the other end, Education and Health Services together have an available worker ratio of 0.63, meaning there are roughly 63 unemployed workers for every 100 job openings. This gap has been persistent for years rather than a short-term fluctuation. In healthcare, the pressure shows up most clearly in nursing. Schools are turning away large numbers of qualified applicants. Hospitals and care facilities operate with insufficient staff, workloads rise for those on the job, and burnout accelerates turnover. That turnover then widens the gap further, making it harder to stabilize staffing even as demand remains constant. In 2024, approximately 80,162 qualified applications were denied admission to nursing schools in the United States, according to the American Association of Colleges of Nursing. This was not due to a lack of interest in the profession, but to limits within the training system itself. Nursing programs are constrained by a shortage of faculty, limited classroom capacity, and, most critically, a lack of clinical placement opportunities, which are required for hands-on training. As a result, schools are unable to expand enrollment even as demand for healthcare workers continues to grow.
The most counterintuitive entries sit in the middle of the chart. Professional and Business Services (0.67) and Financial Activities (0.77) are both running meaningful worker shortages despite years of high-profile layoffs across finance, consulting, and tech. The roles being posted now increasingly require specialized skills in AI, data infrastructure, and advanced financial modeling that most displaced workers, including many laid off from the same sectors, do not yet have.
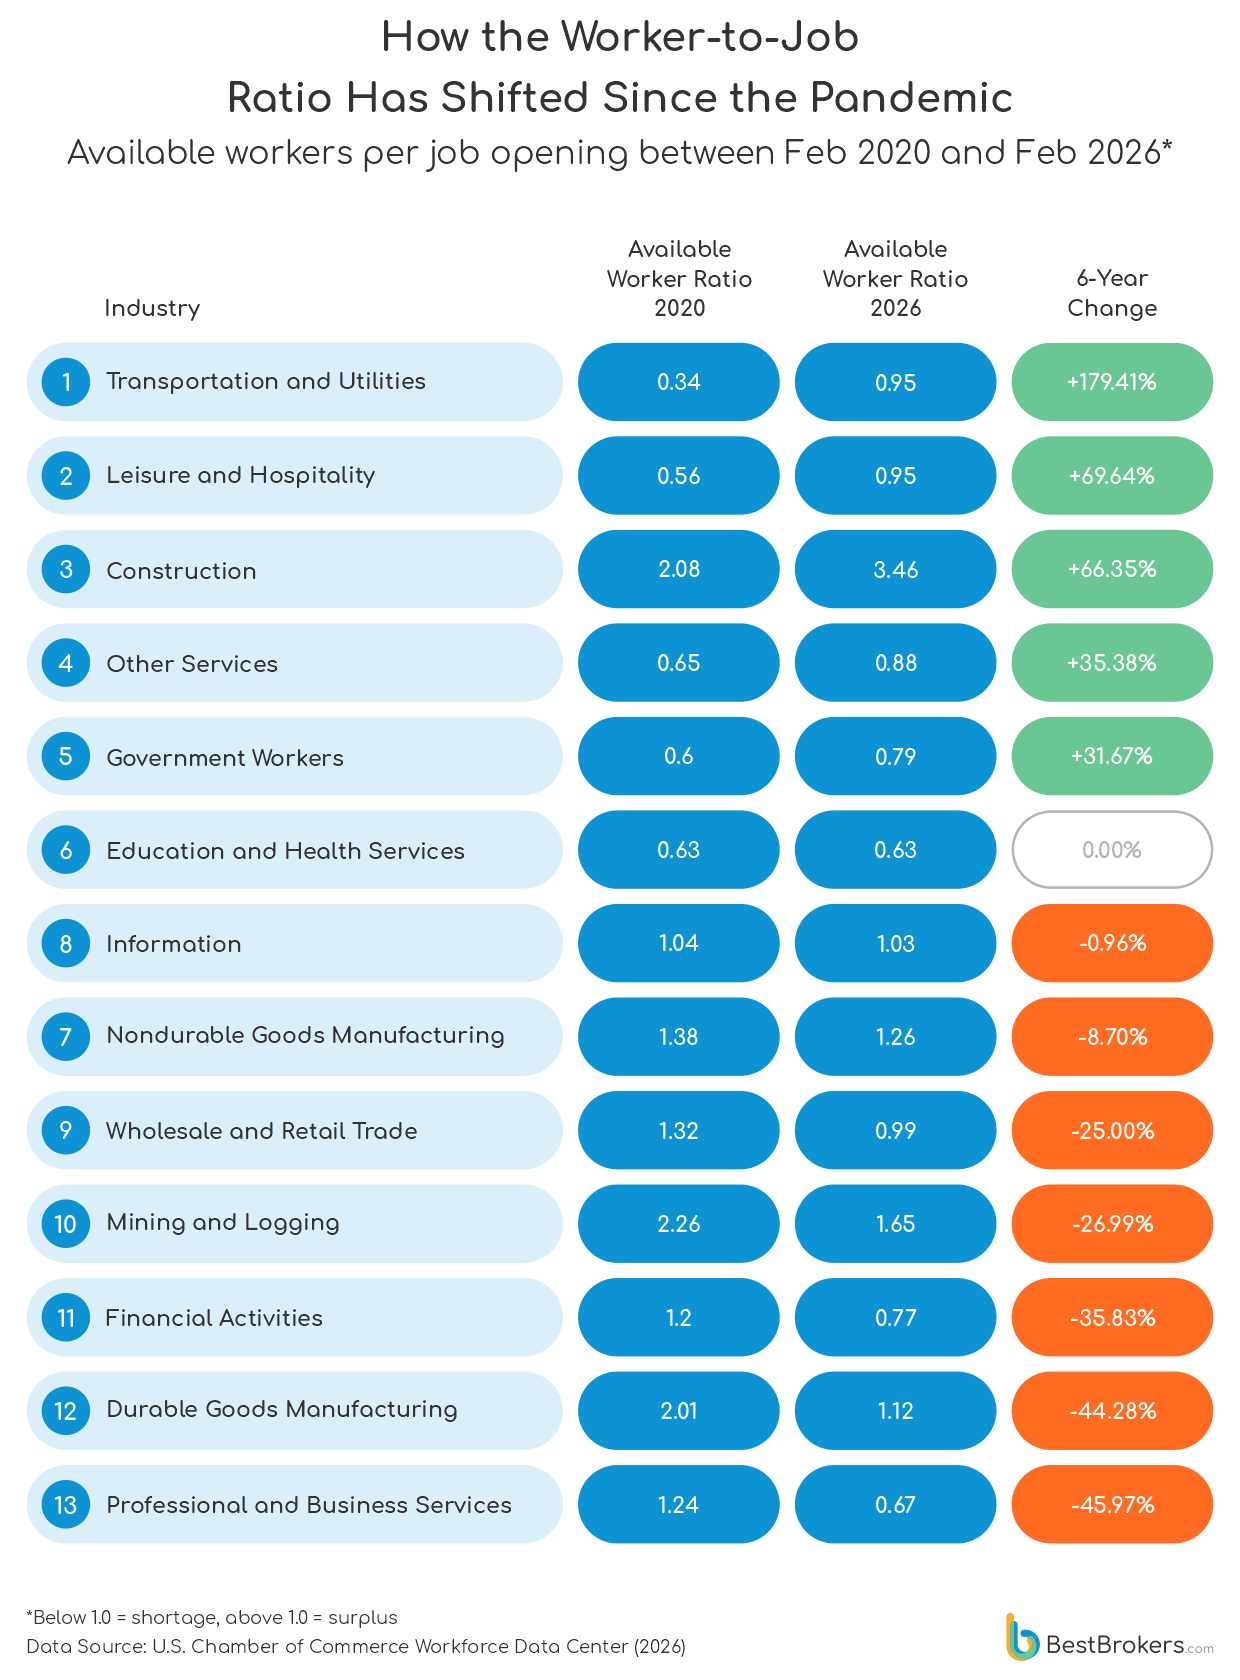
In 2020, the pandemic-driven surge in e-commerce hit the logistics sector like a freight train. Overnight, every household in America needed things delivered, and the trucking industry simply did not have the people to move it all. Transportation and Utilities posted a ratio of just 0.34 that year, roughly 30 workers for every 100 open positions, making it one of the most acutely short-staffed sectors in the entire economy. Six years later, the ratio has climbed to 0.95, the largest positive shift in the table at +179%, and the gap has all but closed. Despite this, the American Trucking Associations puts the current driver shortage at roughly 60,000 positions, with projections pointing to 160,000 by 2028. The average truck driver is now 46 years old, and younger workers are not entering the profession fast enough to replace retirees.
The steepest deteriorations in the table belong to Professional and Business Services, down 46% from 1.24 to 0.67, and Financial Activities, down 36% from 1.20 to 0.77. Both sectors are now running significant worker shortages, following years of high-profile layoffs across finance, consulting, and tech-adjacent industries. Finance, insurance, and professional services cut jobs on net over the past three years, even as GDP grew, as companies discovered they could generate the same or greater output from a smaller headcount by automating routine cognitive work. Goldman Sachs and Morgan Stanley have pulled back on junior analyst hiring. Law firms have trimmed entry-level positions as AI tools handle the research that associates used to bill hundreds of hours for. This shift has significantly raised the bar for both new entrants and experienced professionals, with AI expertise rapidly becoming a core requirement.
Education and Health Services together posted a worker-to-job ratio of 0.63 in 2020 and 0.63 in 2026, making them the only two sectors to record zero movement across six years that included a global pandemic, the tightest labor market in modern history, and the most aggressive Federal Reserve tightening cycle in four decades. The healthcare worker shortage is so structurally embedded that none of it made any difference. Nursing schools turned away over 91,000 qualified applicants in a single academic year, not for lack of interest, but for lack of faculty and clinical placements to train them. The sector is not moving toward resolution. It has been stuck at the same floor for six years, and there is nothing in the current data to suggest that it is about to change.
What the Numbers Imply for the U.S. Labor Market
The U.S. labor market of 2026 is neither in crisis nor in full health. The dramatic imbalances of 2021 and 2022 have faded, but what has replaced them is a more complex and in some ways more stubborn set of problems, structural shortages in healthcare and skilled trades that no amount of wage growth seems to resolve, white-collar sectors hollowed out faster by AI than displaced workers can retrain for, and a geographic mismatch between where workers are and where jobs exist that migration patterns are making worse rather than better. The national numbers show a relatively stable and healthy labor market, yet state and industry data say something more complicated. Whether the next six years bring genuine resolution or simply a new configuration of the same underlying pressures will depend on decisions around immigration, workforce training, automation policy, and housing affordability, which are currently moving in contradictory directions.
Methodology
To prepare this report, the team at BestBrokers analyzed workforce data from two primary sources: the U.S. Chamber of Commerce Workforce Data Center and the Bureau of Labor Statistics’ Job Openings and Labor Turnover Survey (JOLTS), covering the period from January 2020 through March 2026.
The central metric used throughout the report is the Available Worker Ratio, defined as the number of unemployed workers per open job position. A ratio above 1.0 indicates a labor surplus (more workers than available jobs), while a ratio below 1.0 indicates a labor shortage.
State-level surplus and shortage figures, expressed in thousands of workers, were calculated as the difference between the number of unemployed workers and the number of job openings in each state. Industry-level ratios and six-year percentage changes were derived from the same JOLTS dataset, using January 2020 as the baseline period for pre-pandemic comparison. All national figures, including total labor force size, employment levels, unemployment rate, quit rate, and hire rate, reflect the most recently available March 2026 data at the time of publication. Migration data referenced in the state analysis section is sourced from the Atlas Van Lines Migration Patterns Study, covering relocations from November 2024 through October 2025.