
As 2025 unfolded and carried its momentum into 2026, traditional measures of corporate performance came under quiet revision. Record-breaking valuations crowned a select group of companies, with NVIDIA briefly surpassing the $5 trillion mark and others firmly established in multi-trillion territory, even as more than 245,000 jobs were cut across the global tech sector alone. Growth and contraction progressed side by side, reshaping how strength is measured in practice. In this environment, scale alone is no longer a reliable indicator of performance – increasingly, it is what each employee produces that defines corporate efficiency.
While market capitalisation remains a useful indicator of a company’s magnitude and influence, it offers only a partial view of underlying performance. In this analysis, the team at BestBrokers turned instead to two more revealing measures of operational strength: revenue and net income per employee. We compiled financial data on the 200 largest publicly traded companies by market capitalisation as of April 1, 2026, using Companies Market Cap as a reference point. To calculate revenue and profit per employee, we analysed official annual reports, extracting both earnings and headcount figures. Each company’s annual revenue and net income were then divided by total workforce, before firms were ranked by these efficiency metrics. We also highlighted companies that reach $1 million in net profit in the shortest time, adding a further dimension to profitability efficiency.
Key Takeaways:
- Mobile ad-tech platform AppLovin and AI semiconductor giant NVIDIA lead the ranking with net profit per employee of $3.71 million and $2.86 million, respectively. With a workforce nearly 50 times larger, NVIDIA has continued to expand its headcount, while AppLovin has undergone sustained restructuring and reductions since 2022.
- Energy and technology emerge as the highest-earning sectors on a per-employee basis across their largest companies, averaging $387,473 and $374,755, respectively. Energy leads overall, driven by higher profitability concentrated across a smaller number of firms.
- Google (Alphabet) ranks as the most profitable company overall and the fastest to generate $1 million in net profit, achieving this threshold roughly every 3 minutes and 59 seconds. It is followed by NVIDIA, Microsoft, Apple, and Saudi Aramco, all of which cross the same benchmark in under six minutes.
Profit Per Employee: The New Measure of Corporate Power
Net income per employee (NIPE) is a key measure of efficiency, capturing how effectively a company converts the productivity of its workforce into profit. Unlike revenue per employee, which is more suited to comparisons within the same industry, NIPE accounts for expenses, salaries, and operating costs, making it a more reliable metric for cross-sector analysis where business models differ but profitability remains the common denominator. By relying on annual net income, the measure reflects performance across a full economic cycle, smoothing out distortions caused by seasonality, one-off events, or short-term swings in demand such as product launches or holiday-driven spikes.
Collectively, the 20 global companies with the highest profit per employee in our analysis generated approximately $628.07 billion in net income. With a combined workforce exceeding 663,000, this equates to an average of $658,753 per employee. The ranking is heavily weighted towards U.S.-based businesses, which account for 70% of the top 20 firms, while the remaining companies are spread across Saudi Arabia, Norway, Sweden, South Korea, China, and Taiwan.
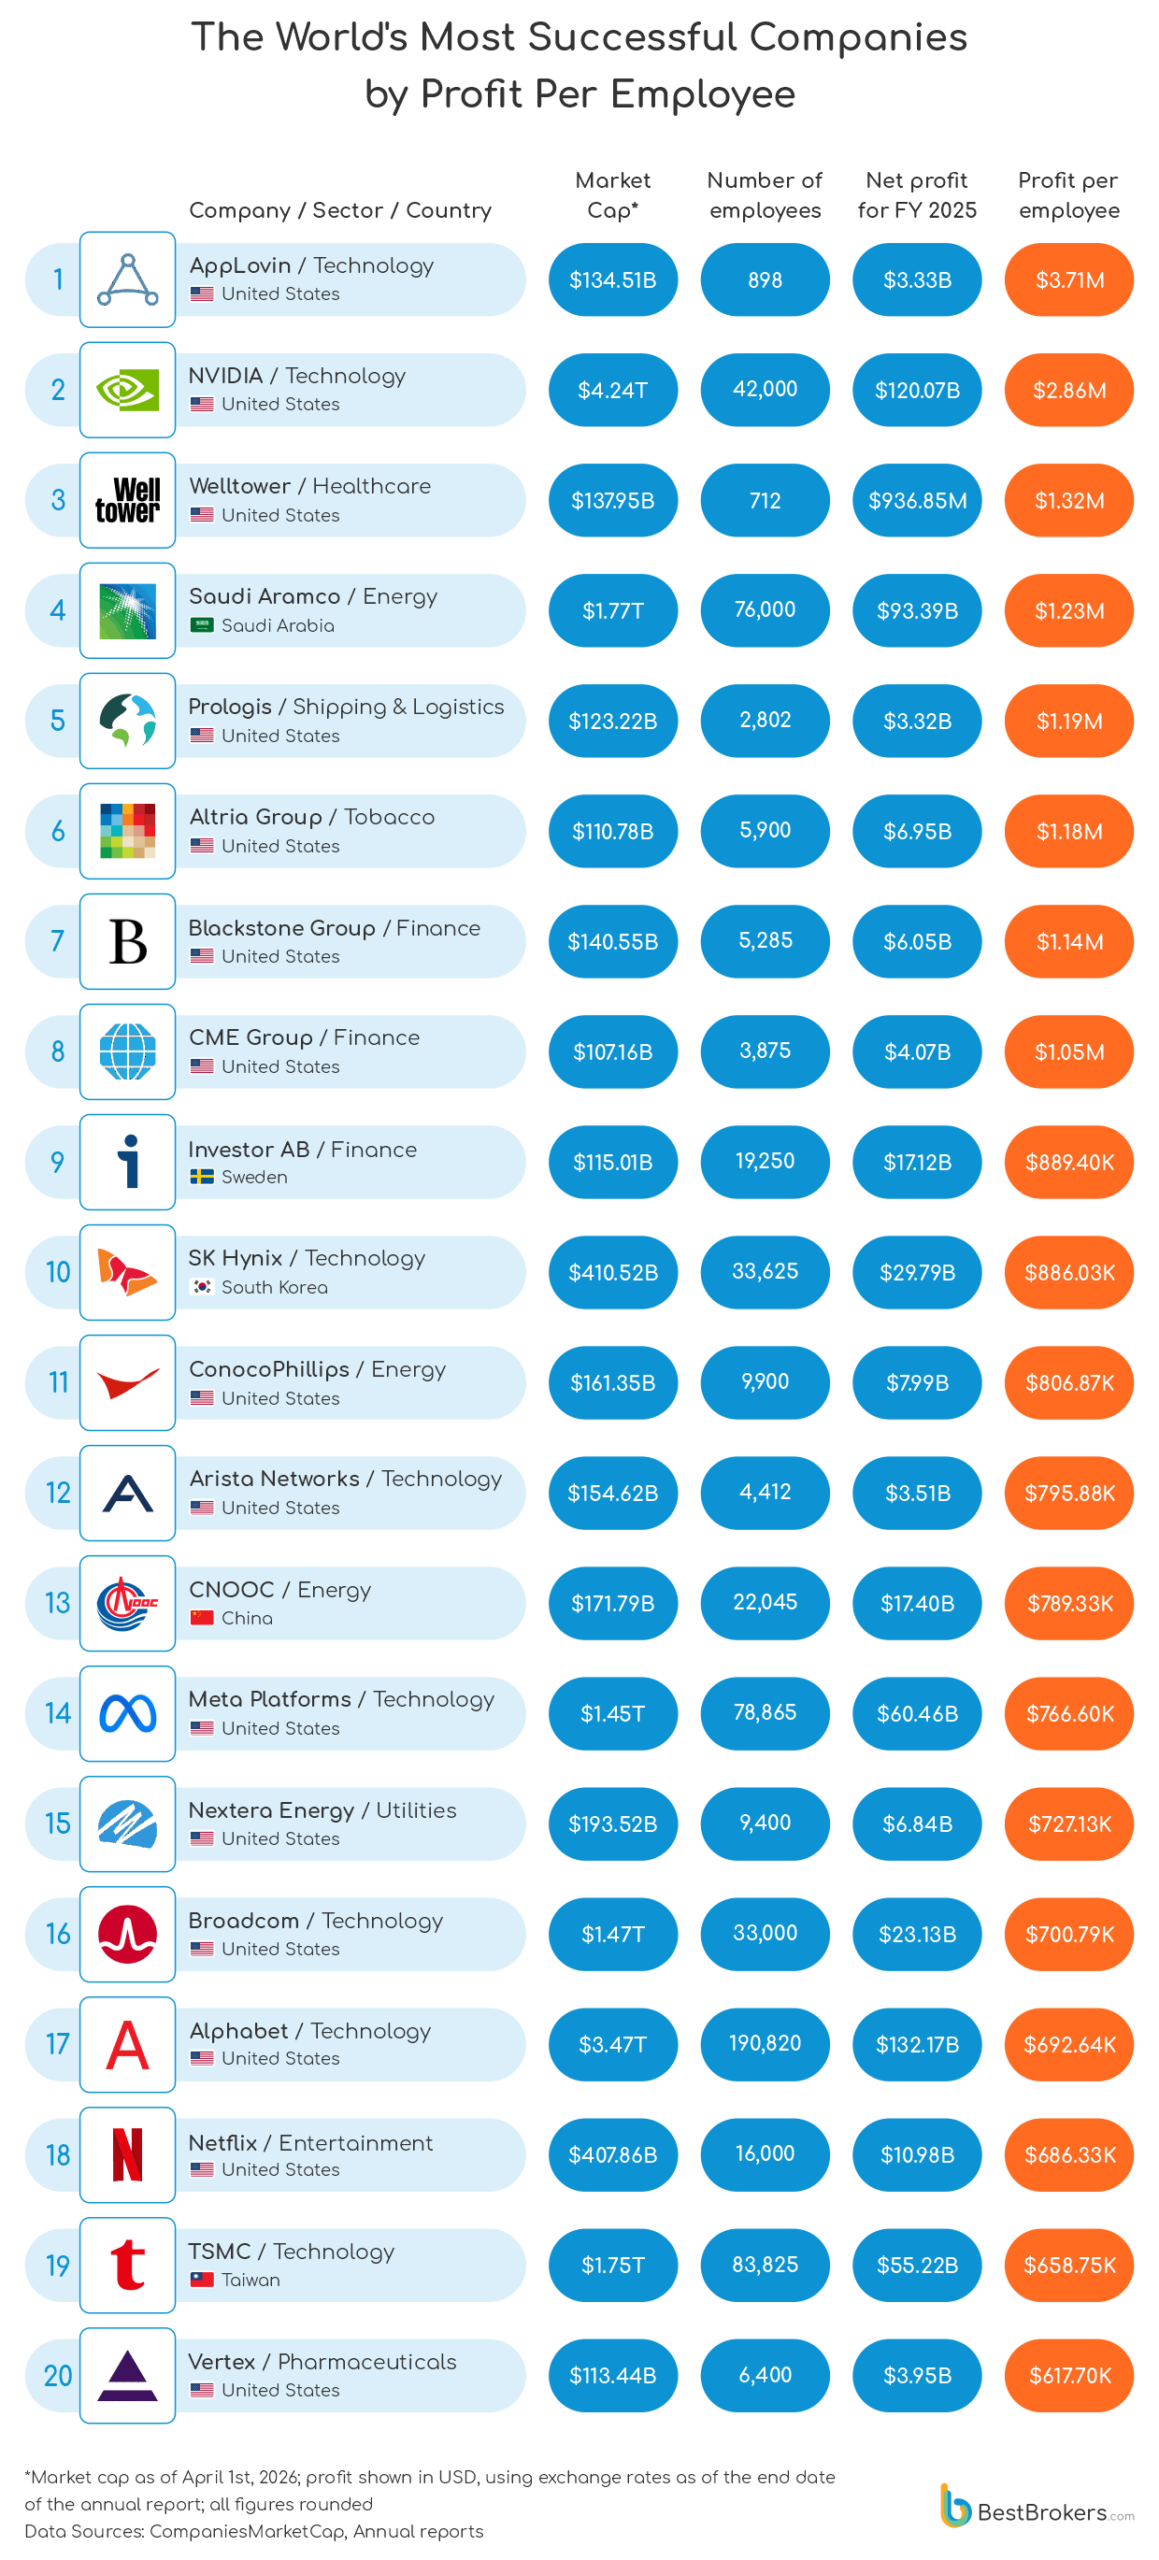
What stands out in the ranking is not just the scale of profits, but how unevenly that profit is distributed across workforce structures. At one end are hyper-lean companies such as AppLovin Corporation and Welltower, where fewer than a thousand employees generate some of the highest per-capita returns in the entire dataset – at $3.71 million and $1.32 million per employee, respectively. At the other end are global giants like NVIDIA ($2.86 million per employee), Alphabet ($692,640), and TSMC ($658,750), where tens or even hundreds of thousands of employees support lower, but still highly efficient, profit-per-head figures. The contrast highlights two very different models of success: extreme concentration of value in comparatively small teams versus scale-driven efficiency at the global infrastructure level.
Across sectors, capital-intensive industries remain strongly represented at the top. Energy giants such as Saudi Aramco ($1.23M), Equinor ($1.03M), ConocoPhillips ($806.9K), and CNOOC ($789.3K) maintain exceptionally high profitability per employee, reflecting asset-heavy operations where large revenues are supported by relatively contained workforces. In parallel, financial firms like Blackstone Group ($1.14M), CME Group ($1.05M), and Investor AB ($889.4K) continue to convert capital markets activity into outsized returns per employee.
Technology, however, remains the defining force at both extremes of the ranking. Semiconductor leaders such as NVIDIA, Broadcom, and SK Hynix demonstrate how AI-driven demand and high-margin hardware can compress enormous revenue streams into highly efficient workforces. At the same time, large-scale platforms like Alphabet’s Google and Meta continue to operate at workforce sizes that have fluctuated in recent years amid broader industry restructuring. In 2025 alone, Google reduced approximately 635 roles while Meta cut around 4,320 positions, highlighting how even the most profitable digital platforms have not been insulated from workforce adjustments.
Unfortunately, not all companies in our analysis have experienced the same level of success. Despite generating $52.85 billion in revenue in 2025, U.S. chip maker Intel recorded a net loss of $267 million, translating into a loss of approximately $3,137 per employee. It is the only company in the dataset to report a negative profit per employee, standing in sharp contrast to the broader universe, where even lower-ranked firms remained firmly in positive territory. This follows a difficult prior year, with the company posting significant losses in 2024 which presumably led to conducting the largest workforce reductions in 2025 across the tech sector, cutting an estimated 33,900 jobs as part of an ongoing restructuring cycle.
Which Industries Convert Labour into Profit Most Efficiently
Globally, energy and technology firms lead the rankings for profit per employee, reflecting their ability to generate big returns without proportionate increases in headcount. The 16 energy companies in our dataset record a combined $6.20 million in profit per employee, averaging $387,473 per company, making the sector the most efficient on a per-capita basis. Closely behind, the 44 technology firms generate a total of $16.49 million in profit per employee, with an average of $374,755, placing emphasis on the scale advantages of software, AI, and semiconductor-driven business models.
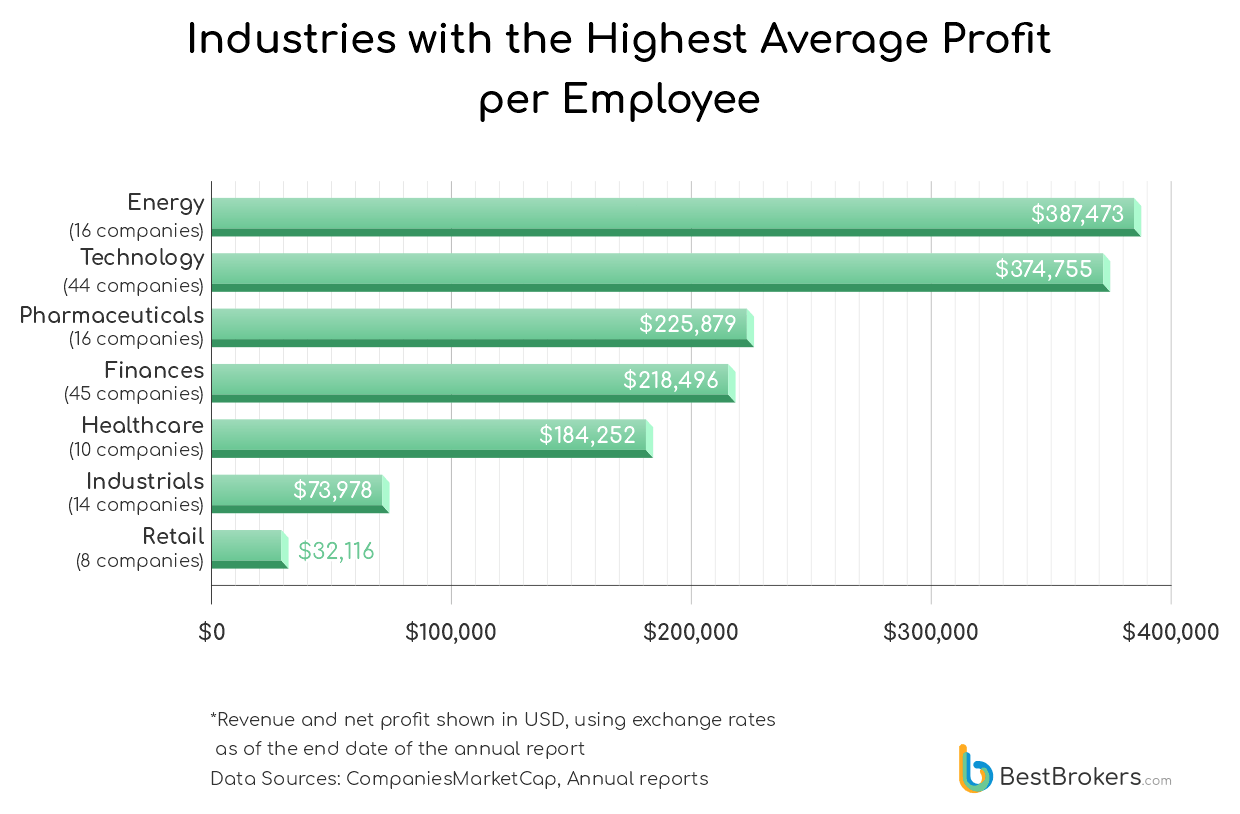
An interesting pattern emerges in the Tobacco and Entertainment sectors, both of which achieve relatively high average profits per employee despite limited representation in the dataset. The Tobacco sector includes just three firms – Altria Group, British American Tobacco, and Philip Morris International – among the 200 companies analysed, yet it records a combined net profit per employee of $1.54 million and an average of $513,165. Similarly, the Entertainment sector, represented by Netflix and The Walt Disney Company, generates an average of $370,011 in net profit per employee, pointing to the strength of subscription-based and intellectual property-driven business models even at smaller sample sizes.
U.S. Leaders in Profit per Employee
The most profitable U.S. companies per employee are unsurprisingly dominated by Technology and Finance, with several firms also appearing among the global leaders. At the very top, California-based mobile tech company AppLovin Corporation ($3.71M per employee) and NVIDIA ($2.86M) set the benchmark for efficiency, followed by REIT company and S&P500 constituent Welltower ($1.32M), reinforcing the role of highly concentrated workforces as one of the key drivers of outsized returns. A notable development this year is the ascent of AppLovin Corporation from fourth place in the 2024 ranking to the top position, supported by a sharp increase in profitability in 2025 alongside a significantly leaner headcount compared with the previous year.
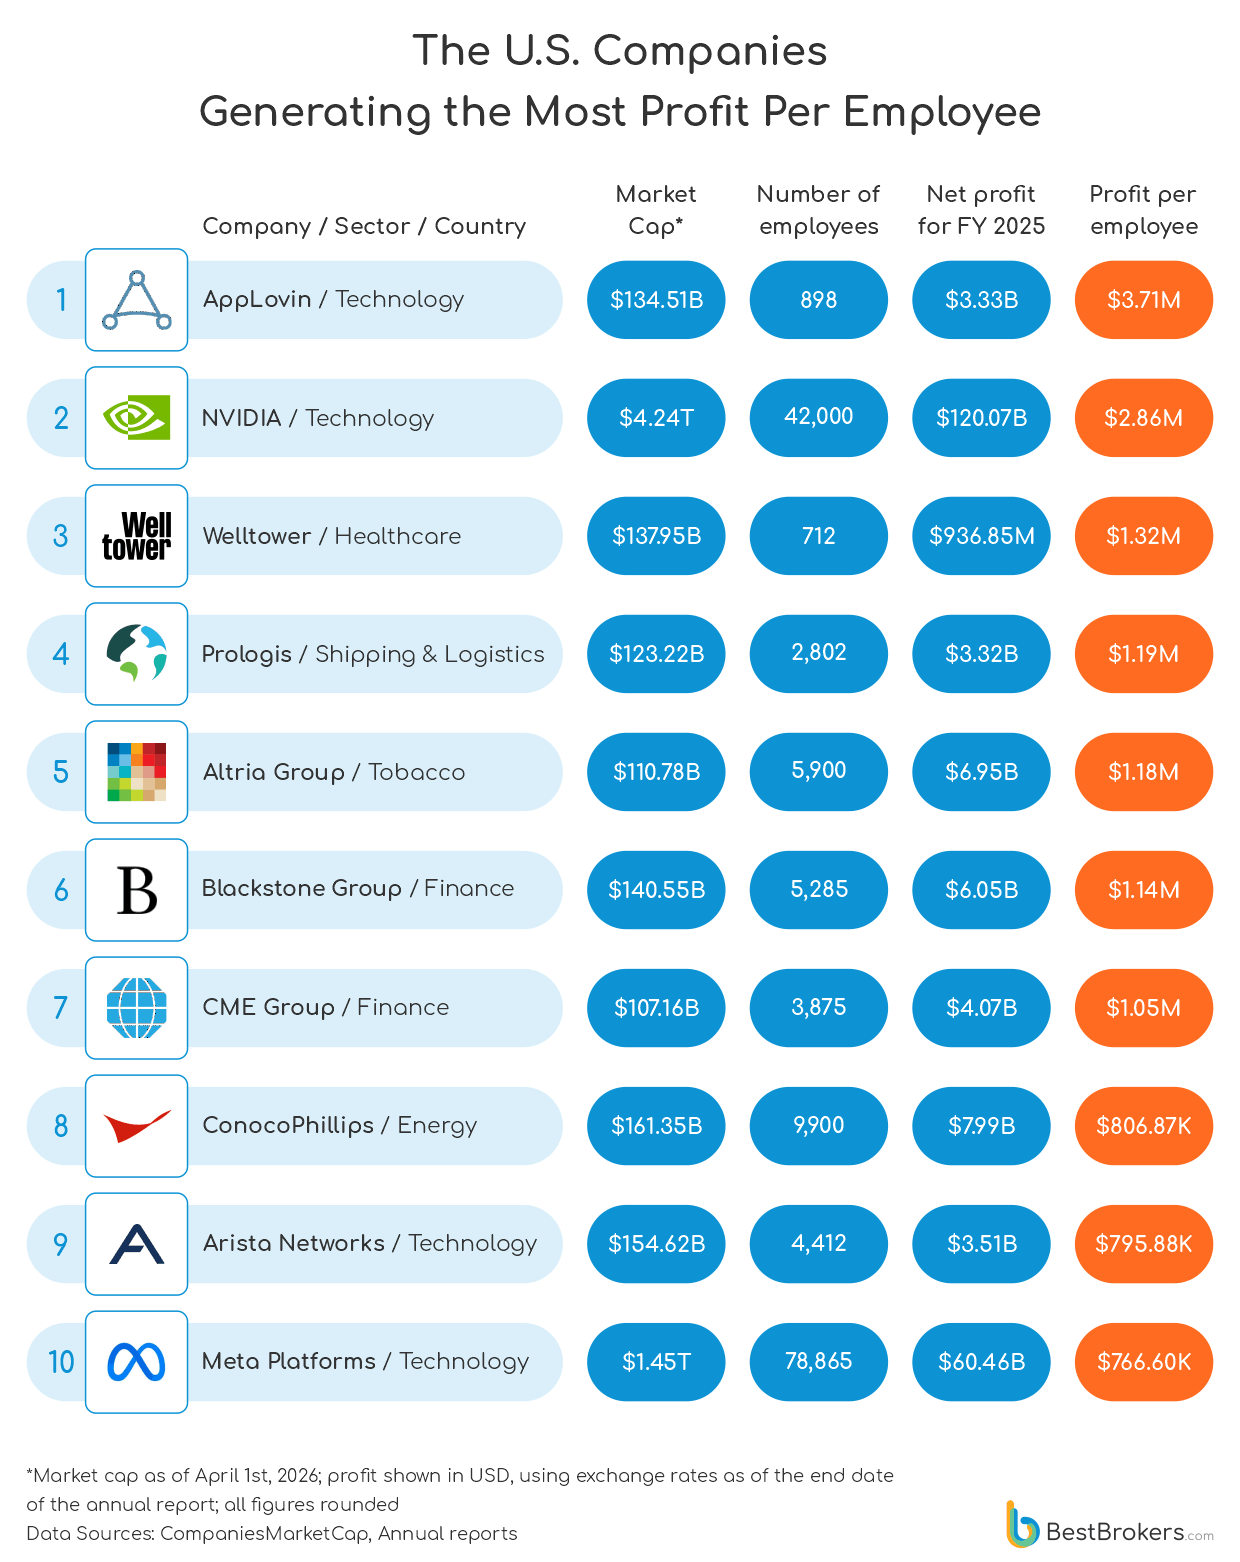
The broader composition of the list remains split between highly compact firms and global-scale platforms such as Meta Platforms, highlighting a structural divide in how U.S. companies generate efficiency – either through extreme workforce concentration or through large-scale digital systems capable of sustaining strong output per employee.
Traditional Sectors Lead U.K. Corporate Efficiency
The U.K. segment of the ranking is led by a mix of energy, tobacco, and industrial conglomerates, with a noticeably more traditional industrial footprint compared with the U.S. At the top, British American Tobacco ($222.48K) and Shell ($209.85K) generate the highest profit per employee, reflecting the enduring strength of mature, cash-generating sectors with large-scale global operations. They are followed by Rolls-Royce Holdings ($184.49K) and Rio Tinto ($168.02K), where capital intensity and long-term contracts underpin relatively high per-capita returns despite more modest workforces.
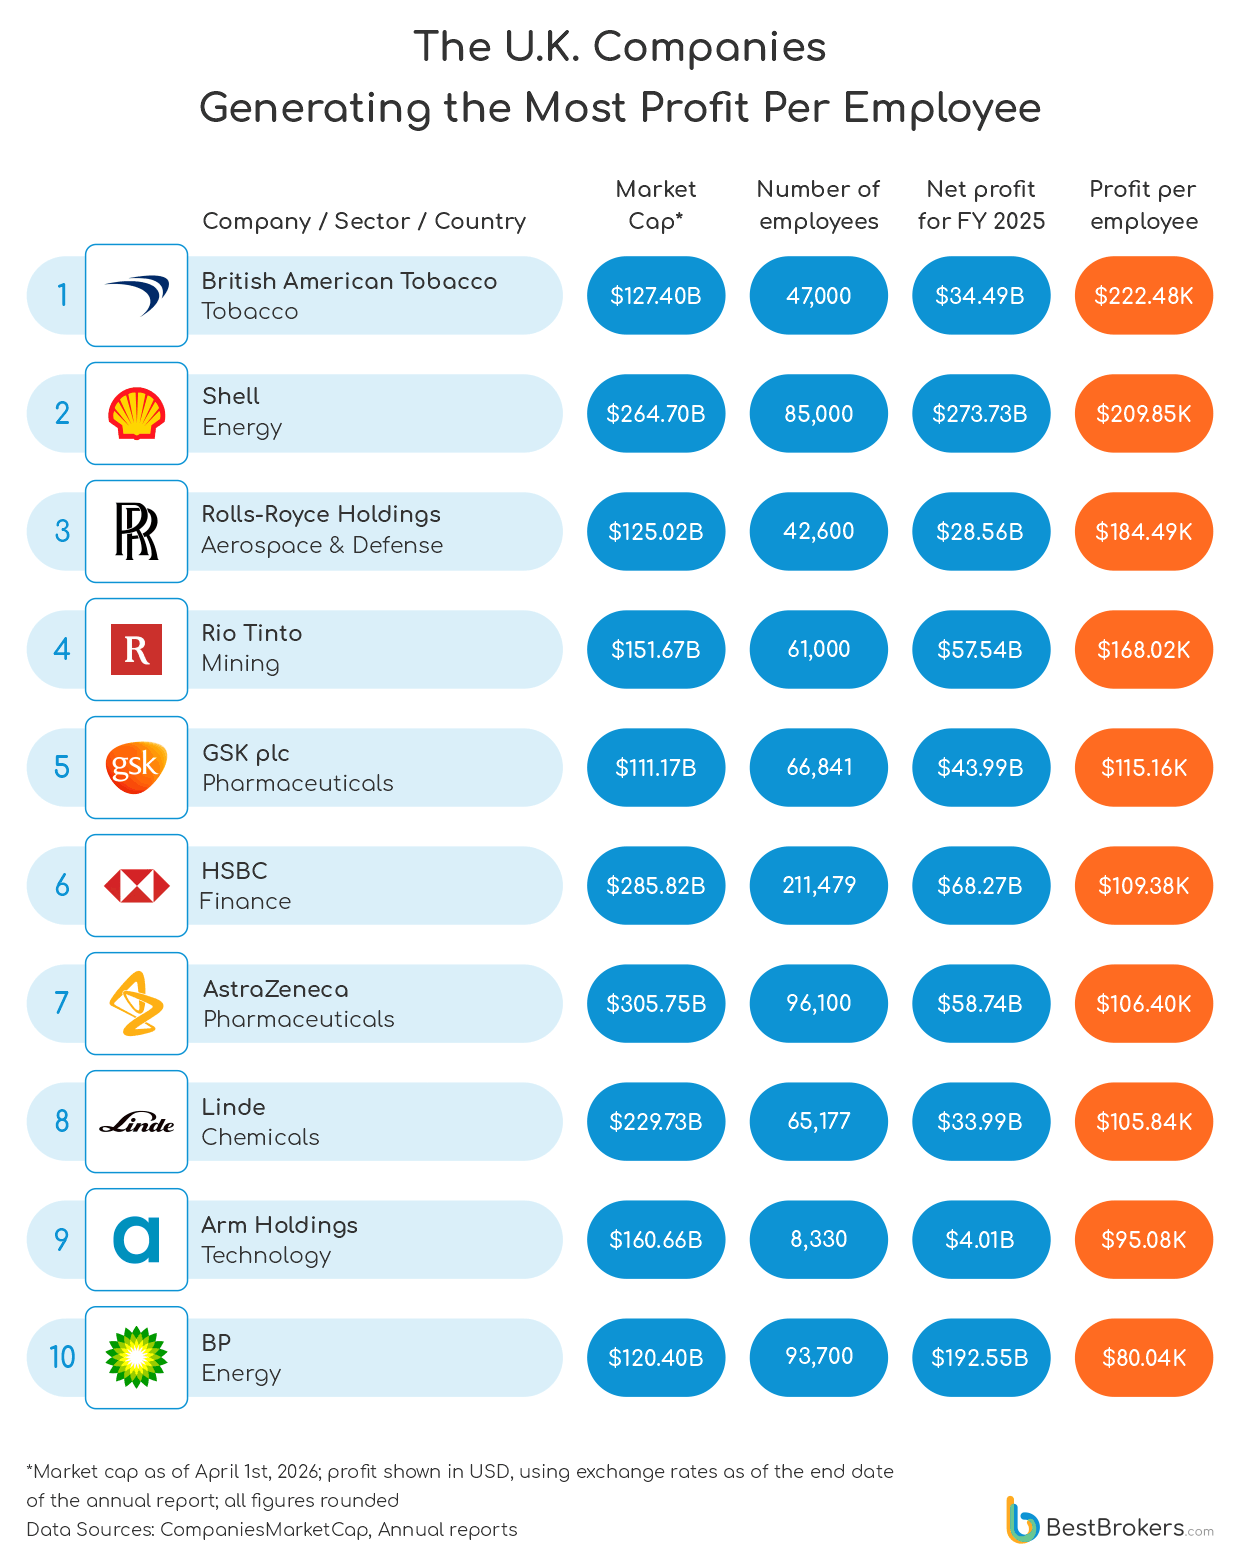
Further down the list, pharmaceutical and financial institutions such as GSK plc ($115.16K), HSBC ($109.38K), and AstraZeneca ($106.40K) contribute steady but more moderate levels of efficiency, while technology exposure remains limited but visible through Cambridge-based semiconductor and software design company Arm Holdings ($95.08K). Overall, the U.K. profile is characterised by conventional sectors and resource-driven firms, where profitability per employee is shaped more by asset bases and global commodity exposure than by the scalable digital models seen in the U.S. and parts of Asia.
The Geography of Europe’s Most Profitable Companies per Employee
The European ranking is clustered around a handful of highly developed economies, with clear weight toward Northern and Western Europe. At the top sits Sweden’s Investor AB ($889.40K), reflecting the continued dominance of long-established Nordic investment structures and concentrated industrial holdings.
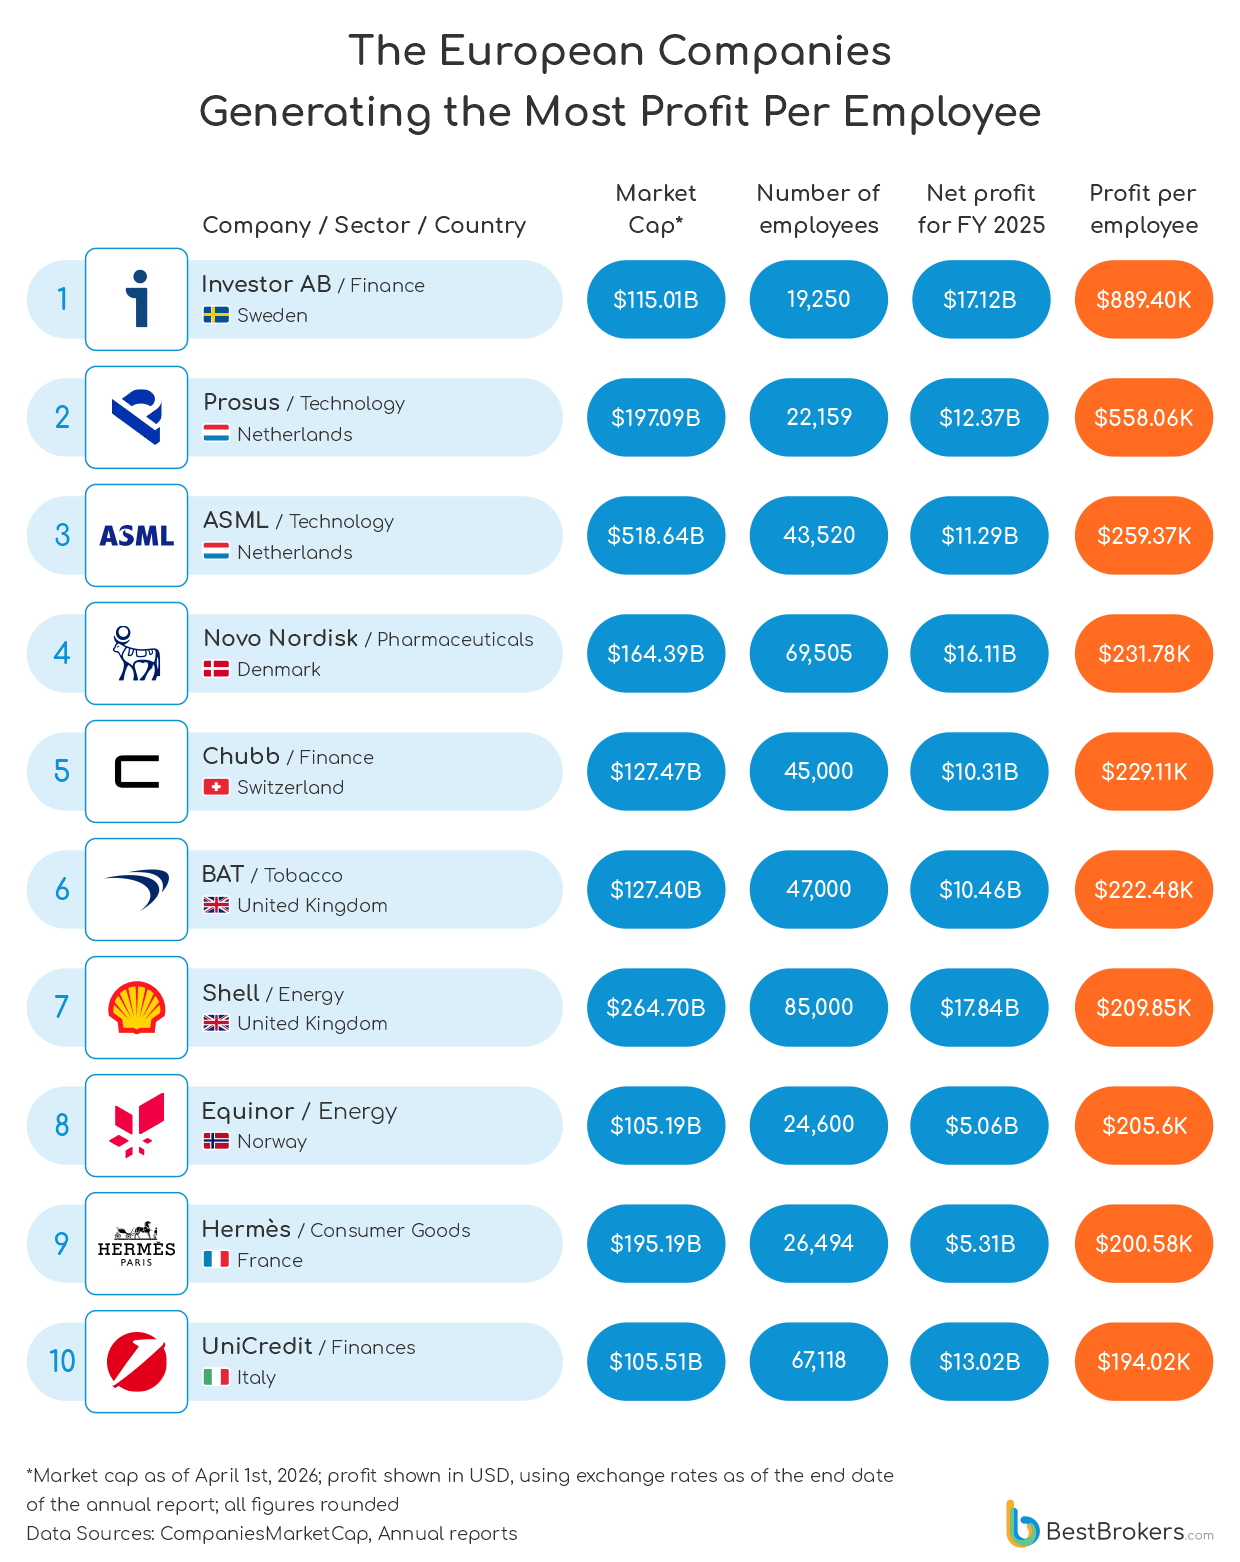
The Netherlands plays a particularly prominent role, with both Prosus ($558.06K) and ASML ($259.37K) featuring among the leaders, highlighting its position as a European centre for technology platforms and advanced industrial manufacturing. Denmark and Switzerland also contribute strongly through Novo Nordisk ($231.78K) and Chubb ($229.11K), where specialised expertise in healthcare and financial protection models supports consistently high efficiency.
Larger Western European economies add further depth to the ranking, with the United Kingdom, France, and Italy represented by names such as British American Tobacco, Shell, Hermès, and UniCredit. Taken together, the European picture is shaped not that much by broad-based dominance but rather by pockets of high specialisation, where a limited number of globally competitive firms drive disproportionate levels of profit per employee.
Scale vs Efficiency: The Revenue per Employee Ranking
While net profit per employee captures what firms ultimately retain after costs, revenue per employee (RPE) measures total revenue generated per worker, reflecting scale and output rather than profitability. As a result, it is particularly useful for identifying industries that operate with massive turnover but structurally thinner margins.
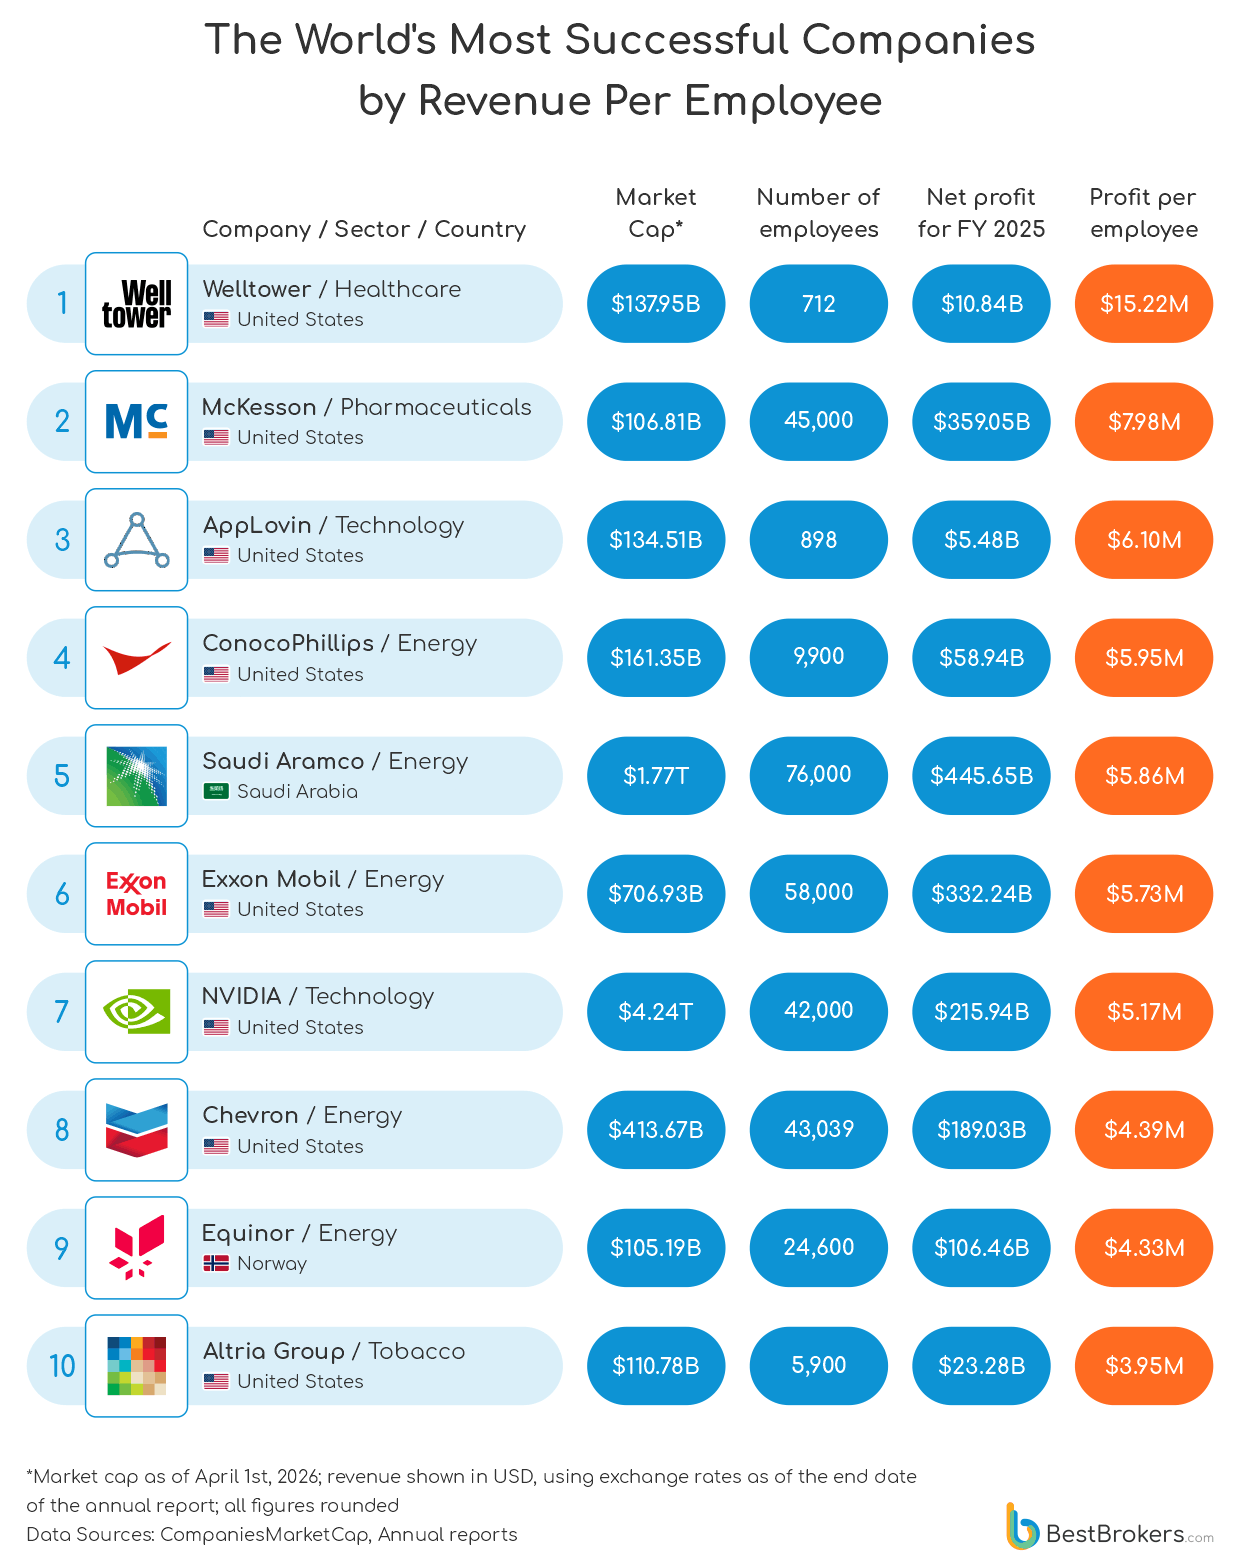
Compared with the profit-based ranking, the RPE list is more heavily dominated by revenue-intensive sectors such as energy and healthcare distribution. Firms like Welltower and McKesson Corporation lead the table in revenue per employee, alongside oil majors including Saudi Aramco, Exxon Mobil, and Chevron, all of which generate enormous revenues but convert a smaller share into net profit per employee due to cost-heavy operations.
Only a handful of companies, such as AppLovin Corporation and NVIDIA, appear prominently in both rankings, highlighting business models that combine strong revenue generation with high margins.
The Speed of Profit: Which Companies Earn $1 Million the Fastest
This final ranking distils corporate performance into a time-based measure that has gained relevance amid the 2025-2026 focus on AI-driven productivity, capital efficiency, and rapid value creation. It shows how quickly companies convert operations into $1 million of profit, offering a more immediate view of economic power than traditional annual figures.
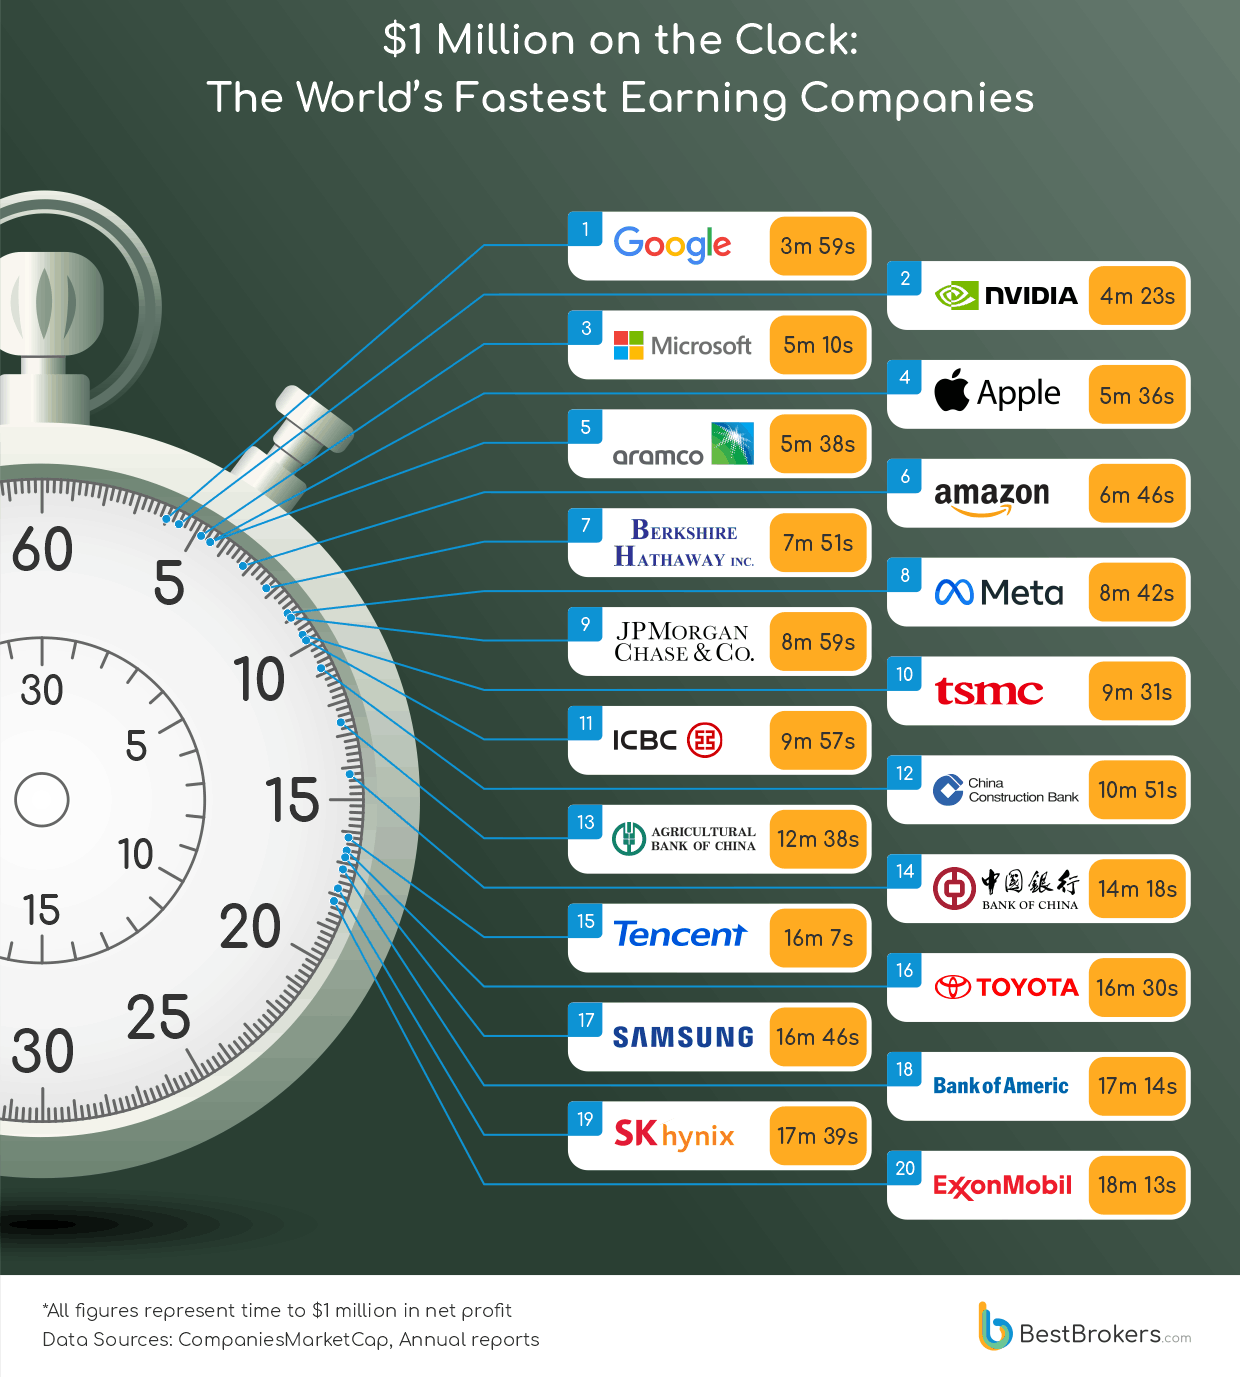
At the top, Google (Alphabet) reaches the threshold in just 3 minutes and 59 seconds, followed closely by NVIDIA and Microsoft, a cluster that mirrors the current concentration of AI-driven market strength at the top end of global valuations and investor attention.
Beyond this ultra-fast tier, energy and platform giants such as Saudi Aramco, Apple, and Amazon still generate equivalent profits within a 5-7 minute window, while financial and industrial groups extend into longer intervals due to heavier asset structures and cyclical earnings.
At the slower end, firms like Toyota, Samsung, and Exxon Mobil require significantly more time to reach the same milestone, showing how capital intensity and operational complexity shape the tempo of value generation in today’s corporate landscape.
Methodology
To compile the ranking of companies with the highest profit per employee, the team at BestBrokers analysed the 200 largest firms globally by market capitalisation as of April 1, 2025, sourced from Companies Market Cap. Financial data was collected from the most recent 2025 annual reports or equivalent fiscal filings, with a focus on total revenue and net income. Revenue represents total sales of goods and services before expenses, while net income reflects earnings after operating costs, taxes, and other deductions.
To ensure comparability across jurisdictions, all figures were converted into U.S. dollars using exchange rates from Xe Currency Converter aligned with the reporting dates. Employee numbers were sourced from official company disclosures and cross-checked with platforms such as Macrotrends. Profit and revenue per employee were then calculated by dividing annual figures by total headcount, allowing companies to be ranked by workforce efficiency.
In addition, we estimated the time required for each company to generate $1 million in net profit, offering a real-time perspective on profitability velocity.
| Rank by Market Cap | Company | Market Cap as of April 1st 2026 | Country | Sector | Number of Employees 2025 | Revenue in USD | Net Income in USD | Fiscal Year Ended | Revenue per Employee | Profit per Employee |
|---|---|---|---|---|---|---|---|---|---|---|
| 142 | AppLovin | $134,506,094,592 | United States | Technology | 898 | $5,480,717,000 | $3,333,751,000 | December 31, 2025 | $6,103,248 | $3,712,418 |
| 1 | NVIDIA | $4,238,791,933,952 | United States | Technology | 42,000 | $216,938,000,000 | $120,067,000,000 | January 25, 2026 | $5,165,190 | $2,858,738 |
| 135 | Welltower | $137,952,657,408 | United States | Healthcare | 712 | $10,838,034,000 | $936,845,000 | December 31, 2025 | $15,221,958 | $1,315,794 |
| 6 | Saudi Aramco | $1,766,123,839,182 | Saudi Arabia | Energy | 76,000 | $445,654,000,000 | $93,389,000,000 | December 31, 2025 | $5,863,868 | $1,228,803 |
| 162 | Prologis | $123,222,245,376 | United States | Shipping & Logistics | 2,802 | $8,790,127,000 | $3,322,349,000 | December 31, 2025 | $3,137,090 | $1,185,706 |
| 187 | Altria Group | $110,775,533,568 | United States | Tobacco | 5,900 | $23,279,000,000 | $6,947,000,000 | December 31, 2025 | $3,945,593 | $1,177,458 |
| 132 | Blackstone Group | $140,547,899,392 | United States | Finances | 5,285 | $14,450,265,000 | $6,046,623,000 | December 31, 2025 | $2,734,203 | $1,144,110 |
| 193 | CME Group | $107,155,374,080 | United States | Finances | 3,875 | $6,520,600,000 | $4,072,200,000 | December 31, 2025 | $1,682,735 | $1,050,890 |
| 200 | Equinor | $105,187,401,728 | Norway | Energy | 24,600 | $106,462,000,000 | $25,352,000,000 | December 31, 2025 | $4,327,724 | $1,030,569 |
| 177 | Investor AB | $115,006,835,500 | Sweden | Finances | 19,250 | $7,047,169,634 | $17,121,015,246 | December 31, 2025 | $366,087 | $889,403 |
| 26 | SK Hynix | $410,521,685,589 | South Korea | Technology | 33,625 | $67,390,374,350 | $29,792,829,386 | December 31, 2025 | $2,004,175 | $886,032 |
| 104 | ConocoPhillips | $161,348,780,032 | United States | Energy | 9,900 | $58,944,000,000 | $7,988,000,000 | December 31, 2025 | $5,953,939 | $806,869 |
| 114 | Arista Networks | $154,615,021,568 | United States | Technology | 4,412 | $9,005,700,000 | $3,511,400,000 | December 31, 2025 | $2,041,183 | $795,875 |
| 98 | CNOOC | $171,790,379,640 | China | Energy | 22,045 | $47,841,278,400 | $17,400,715,200 | December 31, 2025 | $2,170,165 | $789,327 |
| 9 | Meta Platforms (Facebook) | $1,447,234,633,728 | United States | Technology | 78,865 | $200,966,000,000 | $60,458,000,000 | December 31, 2025 | $2,548,228 | $766,601 |
| 84 | Nextera Energy | $193,517,502,464 | United States | Utilities | 9,400 | $27,412,000,000 | $6,835,000,000 | December 31, 2025 | $2,916,170 | $727,128 |
| 8 | Broadcom | $1,467,471,626,240 | United States | Technology | 33,000 | $63,887,000,000 | $23,126,000,000 | November 3, 2025 | $1,935,970 | $700,788 |
| 3 | Alphabet (Google) | $3,470,145,355,776 | United States | Technology | 190,820 | $402,836,000,000 | $132,170,000,000 | December 31, 2025 | $2,111,079 | $692,642 |
| 27 | Netflix | $407,857,692,672 | United States | Entertainment | 16,000 | $45,183,036,000 | $10,981,201,000 | December 31, 2025 | $2,823,940 | $686,325 |
| 7 | TSMC | $1,752,779,325,440 | Taiwan | Technology | 83,825 | $122,420,000,000 | $55,220,000,000 | December 31, 2025 | $1,460,424 | $658,753 |
| 181 | Vertex Pharmaceuticals | $113,436,426,240 | United States | Pharmaceuticals | 6,400 | $12,001,300,000 | $3,953,200,000 | December 31, 2025 | $1,875,203 | $617,688 |
| 18 | Visa | $582,730,645,504 | United States | Finances | 34,100 | $40,000,000,000 | $20,058,000,000 | September 30, 2025 | $1,173,021 | $588,211 |
| 2 | Apple | $3,730,186,436,608 | United States | Technology | 166,000 | $416,161,000,000 | $93,736,000,000 | September 27, 2025 | $2,506,994 | $564,675 |
| 81 | Prosus | $197,086,122,496 | Netherlands | Technology | 22,159 | $6,170,000,000 | $12,366,000,000 | March 31, 2025 | $278,442 | $558,058 |
| 97 | Gilead Sciences | $172,986,548,224 | United States | Pharmaceuticals | 17,000 | $29,443,000,000 | $8,510,000,000 | December 31, 2025 | $1,731,941 | $500,588 |
| 16 | Exxon Mobil | $706,933,096,448 | United States | Energy | 58,000 | $332,238,000,000 | $28,844,000,000 | December 31, 2025 | $5,728,241 | $497,310 |
| 4 | Microsoft | $2,751,243,485,184 | United States | Technology | 228,000 | $281,724,000,000 | $101,832,000,000 | June 30, 2025 | $1,235,632 | $446,632 |
| 14 | Eli Lilly | $823,211,393,024 | United States | Pharmaceuticals | 50,065 | $65,179,000,000 | $20,640,000,000 | December 31, 2025 | $1,301,888 | $412,264 |
| 171 | Newmont | $117,762,375,680 | United States | Mining | 17,500 | $22,669,000,000 | $7,085,000,000 | December 31, 2025 | $1,295,371 | $404,857 |
| 145 | Petrobras | $133,720,604,672 | Brazil | Energy | 50,687 | $89,195,000,000 | $19,634,000,000 | December 31, 2025 | $1,759,721 | $387,358 |
| 21 | Mastercard | $445,915,430,912 | United States | Finances | 39,800 | $32,800,000,000 | $15,000,000,000 | December 31, 2025 | $824,121 | $376,884 |
| 32 | Palantir | $349,854,302,208 | United States | Technology | 4,429 | $4,475,446 | $1,634,644,000 | December 31, 2025 | $1,010 | $369,077 |
| 60 | Goldman Sachs | $251,050,000,384 | United States | Finances | 47,400 | $58,283,000,000 | $17,176,000,000 | December 31,2025 | $1,229,599 | $362,363 |
| 170 | Enbridge | $118,163,587,072 | Canada | Energy | 14,800 | $33,548,170,968 | $5,163,953,184 | December 31, 2025 | $2,266,768 | $348,916 |
| 54 | Kweichow Moutai | $265,615,702,484 | China | Food & Beverage | 34,992 | $24,061,455,665 | $11,731,597,403 | December 31,2025 | $687,627 | $335,265 |
| 178 | Interactive Brokers | $114,031,763,456 | United States | Finances | 3,182 | $6,205,000,000 | $984,000,000 | December 31, 2025 | $1,950,031 | $309,239 |
| 24 | Chevron | $413,666,246,656 | United States | Energy | 43,039 | $189,031,000,000 | $12,485,000,000 | December 31, 2025 | $4,392,086 | $290,086 |
| 123 | Uber | $148,040,286,208 | United States | Transportation | 34,000 | $52,017,000,000 | $9,856,000,000 | December 31, 2025 | $1,529,912 | $289,882 |
| 52 | Lam Research | $268,363,366,400 | United States | Technology | 19,000 | $18,435,591,000 | $5,358,217,000 | September 24,2025 | $970,294 | $282,011 |
| 19 | Tencent | $575,543,771,136 | China | Technology | 115,849 | $107,135,676,192 | $32,606,888,112 | December 31, 2025 | $924,787 | $281,460 |
| 87 | Amgen | $189,670,948,864 | United States | Pharmaceuticals | 28,000 | $36,751,000,000 | $7,711,000,000 | December 31,2025 | $1,312,536 | $275,393 |
| 85 | KLA | $193,463,386,112 | United States | Technology | 15,000 | $12,156,162,000 | $4,061,643,000 | June 30, 2025 | $810,411 | $270,776 |
| 179 | Al Rajhi Bank | $113,615,770,684 | Saudi Arabia | Finances | 25,083 | $10,425,058,636 | $6,611,135,226 | December 31, 2025 | $415,622 | $263,570 |
| 131 | Southern Copper | $142,132,822,016 | United States | Mining | 16,617 | $13,420,000,000 | $4,334,900,000 | December 31, 2025 | $807,607 | $260,871 |
| 20 | ASML | $518,635,356,160 | Netherlands | Technology | 43,520 | $38,372,970,618 | $11,287,777,804 | December 31, 2025 | $881,732 | $259,370 |
| 100 | Charles Schwab | $166,996,525,056 | United States | Finances | 33,000 | $23,921,000,000 | $8,417,000,000 | December 31, 2025 | $724,879 | $255,061 |
| 129 | Union Pacific Corporation | $144,038,215,680 | United States | Industrials | 29,287 | $24,510,000,000 | $7,138,000,000 | December 31, 2025 | $836,890 | $243,726 |
| 45 | Merck | $297,404,039,168 | United States | Pharmaceuticals | 75,000 | $65,011,000,000 | $18,254,000,000 | December 31, 2025 | $866,813 | $243,387 |
| 173 | AIA | $116,884,641,629 | Hong Kong | Finances | 25,981 | $21,618,000,000.00 | $6,234,000,000.00 | December 31, 2025 | $832,070 | $239,945 |
| 102 | Novo Nordisk | $164,388,896,768 | Denmark | Pharmaceuticals | 69,505 | $48,606,495,280 | $16,109,795,180 | December 31, 2025 | $699,324 | $231,779 |
| 151 | Chubb | $127,471,616,000 | Switzerland | Finances | 45,000 | $59,402,000,000 | $10,310,000,000 | December 31, 2025 | $1,320,044 | $229,111 |
| 119 | China Life Insurance | $152,029,669,256 | China | Finances | 97,505 | $87,796,655,280 | $21,957,963,936 | December 31, 2025 | $900,432 | $225,198 |
| 121 | BlackRock | $149,585,854,464 | United States | Finances | 24,900 | $24,216,000,000 | $5,553,000,000 | December 31, 2025 | $972,530 | $223,012 |
| 152 | British American Tobacco | $127,401,484,288 | United Kingdom | Tobacco | 47,000 | $34,487,706,500 | $10,456,737,250 | December 31, 2025 | $733,781 | $222,484 |
| 138 | Booking Holdings (Booking.com) | $135,714,676,736 | United States | Travel Services | 24,300 | $26,917,000,000 | $5,404,000,000 | December 31, 2025 | $1,107,695 | $222,387 |
| 159 | Bristol-Myers Squibb | $123,831,255,040 | United States | Pharmaceuticals | 32,500 | $48,194,000,000 | $7,055,000,000 | December 31, 2025 | $1,482,892 | $217,077 |
| 153 | DBS Group | $127,241,250,312 | Singapore | Finances | 40,187 | $17,830,191,900 | $8,590,415,163 | December 31, 2025 | $443,681 | $213,761 |
| 167 | Intuit | $120,320,147,456 | United States | Technology | 18,200 | $18,831,000,000 | $3,869,000,000 | July 31, 2025 | $1,034,670 | $212,582 |
| 55 | Shell | $264,698,003,456 | United Kingdom | Energy | 85,000 | $273,731,000,000 | $17,837,000,000 | December 31,2025 | $3,220,365 | $209,847 |
| 56 | Morgan Stanley | $261,314,166,784 | United States | Finances | 83,000 | $70,645,000,000 | $16,861,000,000 | December 31,2025 | $851,145 | $203,145 |
| 82 | Hermès | $195,186,790,333 | France | Consumer Goods | 26,494 | $18,796,909,320 | $5,314,161,840 | December 31, 2025 | $709,478 | $200,580 |
| 39 | Coca-Cola | $327,330,856,960 | United States | Food & Beverage | 65,900 | $47,941,000,000 | $13,137,000,000 | December 31, 2025 | $727,481 | $199,347 |
| 74 | Verizon | $211,727,745,024 | United States | Telecommunications | 89,000 | $138,191,000,000 | $17,608,000,000 | December 31, 2025 | $1,552,708 | $197,843 |
| 17 | Johnson & Johnson | $589,075,709,952 | United States | Pharmaceuticals | 138,100 | $94,193,000,000 | $26,804,000,000 | December 28, 2025 | $682,064 | $194,091 |
| 197 | UniCredit | $105,513,955,814 | Italy | Finances | 67,118 | $28,821,457,760 | $13,022,280,760 | December 31, 2025 | $429,415 | $194,021 |
| 49 | Applied Materials | $271,247,917,056 | United States | Technology | 36,500 | $28,368,000,000 | $6,998,000,000 | December 31,2025 | $777,205 | $191,726 |
| 184 | Tokyo Electron | $112,836,661,985 | Japan | Technology | 19,573 | $16,256,563,968 | $3,637,871,909 | March 31, 2025 | $830,561 | $185,862 |
| 46 | Novartis | $295,276,478,464 | Switzerland | Pharmaceuticals | 75,267 | $54,532,000,000 | $13,967,000,000 | December 31,2025 | $724,514 | $185,566 |
| 157 | Rolls-Royce Holdings | $125,016,048,988 | United Kingdom | Aerospace & Defense | 42,600 | $28,558,406,550 | $7,859,049,400 | December 31, 2025 | $670,385 | $184,485 |
| 15 | JPMorgan Chase | $793,359,089,664 | United States | Finances | 318,512 | $182,447,000,000 | $58,471,000,000 | December 31, 2025 | $572,810 | $183,576 |
| 103 | Intuitive Surgical | $163,729,670,144 | United States | Healthcare | 15,638 | $10,060,000,000 | $2,860,000,000 | December 31, 2025 | $643,305 | $182,888 |
| 107 | CM Bank | $159,253,166,538 | China | Finances | 121,585 | $48,065,449,776 | $21,402,594,672 | December 31, 2025 | $395,324 | $176,030 |
| 11 | Berkshire Hathaway | $1,033,572,581,376 | United States | Finances | 387,800 | $371,444,000,000 | $66,968,000,000 | December 31, 2025 | $957,824 | $172,687 |
| 120 | Rio Tinto | $151,665,426,432 | United Kingdom | Mining | 61,000 | $57,538,000,000 | $10,249,000,000 | December 31, 2025 | $943,246 | $168,016 |
| 76 | AT&T | $202,946,723,840 | United States | Telecommunications | 133,000 | $125,648,000,000 | $21,953,000,000 | December 31, 2025 | $944,722 | $165,060 |
| 115 | Iberdrola | $154,401,370,176 | Spain | Energy | 45,400 | $53,502,004,088 | $7,382,738,100 | December 31, 2025 | $1,178,458 | $162,615 |
| 113 | Shopify | $154,809,024,512 | Canada | E-commerce | 7,600 | $11,566,000,000 | $1,231,000,000 | December 31, 2025 | $1,521,842 | $161,974 |
| 176 | Progressive | $116,150,083,584 | United States | Finances | 70,000 | $87,671,000,000 | $11,308,000,000 | December 31, 2025 | $1,252,443 | $161,543 |
| 29 | Micron Technology | $380,993,667,072 | United States | Technology | 53,000 | $37,380,000,000 | $8,290,000,000 | May 29,2025 | $705,283 | $156,415 |
| 40 | Roche | $326,698,094,141 | Switzerland | Pharmaceuticals | 112,774 | $77,681,142,000 | $17,485,991,600 | December 31, 2025 | $688,821 | $155,053 |
| 44 | General Electric | $299,324,538,880 | United States | Industrials | 57,000 | $45,855,000,000 | $8,698,000,000 | December 31, 2025 | $804,474 | $152,596 |
| 95 | Texas Instruments | $176,757,358,592 | United States | Technology | 33,000 | $17,682,000,000 | $5,001,000,000 | December 31, 2025 | $535,818 | $151,545 |
| 68 | Royal Bank Of Canada | $225,868,054,528 | Canada | Finances | 96,628 | $43,346,392,940 | $14,568,479,132 | October 31,2025 | $448,590 | $150,769 |
| 34 | Procter & Gamble | $337,517,772,800 | United States | Consumer Goods | 109,000 | $84,300,000,000 | $16,000,000,000 | December 31, 2025 | $773,394 | $146,789 |
| 64 | T-Mobile US | $234,919,952,384 | United States | Telecommunications | 75,000 | $71,300,000,000 | $11,000,000,000 | December 31,2025 | $950,667 | $146,667 |
| 191 | Southern Company | $108,043,640,832 | United States | Utilities | 29,800 | $29,553,000,000 | $4,341,000,000 | December 31, 2025 | $991,711 | $145,671 |
| 31 | Bank of America | $349,863,247,872 | United States | Finances | 213,200 | $113,100,000,000 | $30,500,000,000 | December 31, 2025 | $530,488 | $143,058 |
| 109 | Toronto Dominion Bank | $156,453,879,808 | Canada | Finances | 100,424 | $48,476,008,156 | $14,285,248,844 | October 31, 2025 | $482,713 | $142,249 |
| 75 | American Express | $207,687,008,256 | United States | Finances | 76,800 | $72,229,000,000 | $10,883,000,000 | December 31, 2025 | $940,482 | $141,706 |
| 36 | AMD | $331,674,484,736 | United States | Technology | 31,000 | $34,639,000,000 | $4,335,000,000 | December 27,2025 | $1,117,387 | $139,839 |
| 58 | Philip Morris International | $257,687,388,160 | United States | Tobacco | 84,900 | $40,648,000,000 | $11,848,000,000 | December 31,2025 | $478,775 | $139,552 |
| 43 | Alibaba | $299,524,784,128 | China | E-commerce | 124,320 | $137,186,022,083 | $17,345,509,464 | March 31, 2025 | $1,103,491 | $139,523 |
| 190 | Enel | $108,246,587,866 | Italy | Energy | 61,634 | $94,379,232,360 | $8,241,414,560 | December 31, 2025 | $1,531,285 | $133,715 |
| 83 | TotalEnergies | $195,132,030,976 | France | Energy | 101,513 | $182,344,000,000 | $13,127,000,000 | December 31, 2025 | $1,796,263 | $129,313 |
| 25 | ICBC | $411,217,626,884 | China | Finances | 409,758 | $114,208,404,240 | $52,838,604,192 | December 31, 2025 | $278,722 | $128,951 |
| 30 | China Construction Bank | $359,944,753,014 | China | Finances | 378,344 | $105,583,007,952 | $48,424,152,480 | December 31, 2025 | $279,066 | $127,990 |
| 13 | Samsung | $841,206,490,541 | South Korea | Technology | 262,647 | $231,417,319,200 | $31,362,041,370 | December 31, 2025 | $881,096 | $119,408 |
| 79 | Commonwealth Bank | $198,553,585,816 | Australia | Finances | 55,850 | $18,593,138,745 | $6,618,804,669 | June 30, 2025 | $332,912 | $118,510 |
| 41 | Cisco | $306,565,414,912 | United States | Technology | 86,200 | $56,654,000,000 | $10,180,000,000 | July 26,2025 | $657,239 | $118,097 |
| 48 | Bank of China | $275,275,183,127 | China | Finances | 313,746 | $94,038,823,392 | $36,758,975,232 | December 31,2025 | $299,729 | $117,162 |
| 186 | GSK plc | $111,166,013,440 | United Kingdom | Pharmaceuticals | 66,841 | $43,991,015,550 | $7,697,451,400 | December 31, 2025 | $658,144 | $115,161 |
| 198 | Zurich Insurance Group | $105,235,564,973 | Switzerland | Finances | 60,903 | $8,856,000,000 | $6,798,000,000 | December 31, 2025 | $145,412 | $111,620 |
| 147 | Zijin Mining | $131,512,109,289 | China | Mining | 66,708 | $49,700,000,000.00 | $7,400,000,000.00 | December 31, 2025 | $745,038 | $110,931 |
| 47 | HSBC | $285,816,061,952 | United Kingdom | Finances | 211,479 | $68,274,000,000 | $23,131,000,000 | December 31,2025 | $322,841 | $109,377 |
| 183 | Mitsui Bussan | $112,975,595,327 | Japan | Industrials | 56,400 | $98,028,852,151 | $6,019,353,485 | March 31, 2025 | $1,738,100 | $106,726 |
| 136 | QUALCOMM | $137,542,844,416 | United States | Technology | 52,000 | $44,284,000,000 | $5,541,000,000 | September 28, 2025 | $851,615 | $106,558 |
| 42 | AstraZeneca | $305,746,903,040 | United Kingdom | Pharmaceuticals | 96,100 | $58,739,000,000 | $10,225,000,000 | December 31, 2025 | $611,228 | $106,400 |
| 66 | Linde | $229,732,286,464 | United Kingdom | Chemicals | 65,177 | $33,986,000,000 | $6,898,000,000 | December 31,2025 | $521,442 | $105,835 |
| 172 | Sanofi | $117,338,038,272 | France | Pharmaceuticals | 74,846 | $43,626,000,000 | $7,813,000,000 | December 31, 2025 | $582,877 | $104,388 |
| 61 | Wells Fargo | $245,647,458,304 | United States | Finances | 205,198 | $83,699,000,000 | $21,338,000,000 | December 31,2025 | $407,894 | $103,987 |
| 106 | Pfizer | $159,729,041,408 | United States | Pharmaceuticals | 75,000 | $62,579,000,000 | $7,771,000,000 | December 31, 2025 | $834,387 | $103,613 |
| 149 | S&P Global | $128,792,952,832 | United States | Finances | 44,500 | $15,336,000,000 | $4,471,000,000 | December 31, 2025 | $344,629 | $100,472 |
| 88 | BHP Group | $185,453,576,192 | Australia | Mining | 90,000 | $51,262,000,000 | $9,019,000,000 | June 30, 2025 | $569,578 | $100,211 |
| 192 | Xiaomi | $107,463,016,448 | China | Technology | 56,531 | $65,168,842,190 | $5,581,667,746 | December 31, 2025 | $1,152,798 | $98,736 |
| 163 | Banco Bilbao Vizcaya Argentaria | $123,000,307,712 | Spain | Finances | 127,174 | $43,381,368,460 | $12,393,837,660 | December 31, 2025 | $341,118 | $97,456 |
| 105 | Arm Holdings | $160,659,144,704 | United Kingdom | Technology | 8,330 | $4,007,000,000 | $792,000,000 | March 31, 2025 | $481,032 | $95,078 |
| 111 | Analog Devices | $155,317,272,576 | United States | Technology | 24,500 | $11,019,707,000 | $2,267,342,000 | November 1, 2025 | $449,784 | $92,545 |
| 65 | International Holding Company | $232,986,703,764 | United Arab Emirates | Finances | 102,391 | $30,333,716,882 | $9,452,743,936 | December 31,2025 | $296,254 | $92,320 |
| 33 | Agricultural Bank of China | $341,206,289,911 | China | Finances | 457,835 | $103,339,869,072 | $41,613,931,536 | December 31, 2025 | $225,714 | $90,893 |
| 127 | PDD Holdings (Pinduoduo) | $145,059,479,552 | China | Retail | 23,465 | $61,543,194,398 | $2,024,938,757 | December 31, 2025 | $2,622,766 | $86,296 |
| 108 | Allianz SE | $158,089,590,217 | Germany | Finances | 156,000 | $20,408,542,840 | $13,426,363,800 | December 31, 2025 | $130,824 | $86,066 |
| 126 | China Shenhua Energy | $145,327,145,277 | China | Mining | 91,392 | $42,029,068,992 | $7,726,715,616 | December 31, 2025 | $459,877 | $84,545 |
| 51 | Toyota | $268,605,030,400 | Japan | Automotive | 380,000 | $321,155,602,621 | $31,857,026,950 | March 31,2025 | $845,146 | $83,834 |
| 101 | Santander | $164,421,844,992 | Spain | Finances | 198,403 | $73,287,037,400 | $16,563,880,660 | December 31, 2025 | $369,385 | $83,486 |
| 96 | Salesforce | $174,909,784,064 | United States | Technology | 74,453 | $37,895,000,000 | $6,197,000,000 | January 31, 2025 | $508,979 | $83,234 |
| 166 | BP | $120,398,012,416 | United Kingdom | Energy | 93,700 | $192,549,000,000 | $7,500,000,000 | December 31, 2025 | $2,054,952 | $80,043 |
| 194 | McKesson | $106,808,483,840 | United States | Pharmaceuticals | 45,000 | $359,051,000,000 | $3,481,000,000 | March 31, 2025 | $7,978,911 | $77,356 |
| 77 | SAP | $201,327,214,592 | Germany | Technology | 111,397 | $43,227,488,000 | $8,605,559,160 | December 31, 2025 | $388,049 | $77,251 |
| 23 | Oracle | $423,095,140,352 | United States | Technology | 162,000 | $57,399,000,000 | $12,433,000,000 | May 31, 2025 | $354,315 | $76,747 |
| 158 | Unilever | $124,482,961,408 | United Kingdom | Consumer Goods | 96,000 | $59,323,853,980 | $7,298,162,580 | December 31, 2025 | $617,957 | $76,023 |
| 72 | L’Oréal | $215,780,029,993 | France | Consumer Goods | 95,000 | $51,746,122,320 | $7,197,376,752 | December 31,2025 | $544,696 | $75,762 |
| 154 | Mitsubishi Corporation | $126,877,164,355 | Japan | Industrials | 62,062 | $124,470,391,774 | $4,679,941,000 | March 31, 2025 | $2,005,581 | $75,408 |
| 37 | Caterpillar | $331,544,821,760 | United States | Industrials | 118,000 | $67,600,000,000 | $8,884,000,000 | December 31, 2025 | $572,881 | $75,288 |
| 28 | AbbVie | $384,688,128,000 | United States | Pharmaceuticals | 57,000 | $61,160,000,000 | $4,233,000,000 | December 31, 2025 | $1,072,982 | $74,263 |
| 116 | Ping An Insurance | $152,883,372,182 | China | Finances | 258,806 | $162,509,853,888 | $19,207,482,336 | December 31, 2025 | $627,922 | $74,216 |
| 161 | UBS | $123,448,459,264 | Switzerland | Finances | 105,236 | $49,573,000,000 | $7,797,000,000 | December 31, 2025 | $471,065 | $74,091 |
| 148 | Palo Alto Networks | $130,821,128,192 | United States | Technology | 16,068 | $9,221,500,000 | $1,133,900,000 | July 31, 2025 | $573,905 | $70,569 |
| 118 | Deere & Company (John Deere) | $152,151,441,408 | United States | Industrials | 73,100 | $45,684,000,000 | $5,027,000,000 | November 2, 2025 | $624,952 | $68,769 |
| 164 | Sony | $122,274,070,528 | Japan | Technology | 112,300 | $86,626,135,790 | $7,632,315,208 | March 31, 2025 | $771,381 | $67,964 |
| 63 | GE Vernova | $236,835,618,816 | United States | Utilities | 75,000 | $38,068,000,000 | $4,884,000,000 | December 31,2025 | $507,573 | $65,120 |
| 156 | Sumitomo Mitsui Financial Group | $125,675,937,792 | Japan | Finances | 122,978 | $68,025,576,573 | $7,875,645,397 | March 31, 2025 | $553,152 | $64,041 |
| 169 | Air Liquide | $118,791,271,164 | France | Chemicals | 65,168 | $31,645,575,332 | $4,132,336,414 | December 31, 2025 | $485,600 | $63,411 |
| 80 | Citigroup | $198,390,284,288 | United States | Finances | 226,000 | $85,225,000,000 | $14,306,000,000 | December 31, 2025 | $377,102 | $63,301 |
| 35 | PetroChina | $335,403,076,452 | China | Energy | 363,224 | $408,221,348,640 | $22,419,987,840 | December 31, 2025 | $1,123,883 | $61,725 |
| 182 | Parker-Hannifin | $112,994,082,816 | United States | Industrials | 57,950 | $19,850,000,000 | $3,531,000,000 | June 30, 2025 | $342,537 | $60,932 |
| 53 | LVMH | $265,721,086,092 | France | Consumer Goods | 211,000 | $94,920,750,620 | $12,777,951,480 | December 31,2025 | $449,861 | $60,559 |
| 144 | Danaher | $134,179,807,232 | United States | Healthcare | 60,000 | $24,568,000,000 | $3,614,000,000 | December 31, 2025 | $409,467 | $60,233 |
| 188 | ServiceNow | $110,315,200,512 | United States | Finances | 29,187 | $13,278,000,000 | $1,748,000,000 | December 31, 2025 | $454,929 | $59,890 |
| 155 | Stryker Corporation | $125,844,791,296 | United States | Healthcare | 56,000 | $25,116,000,000 | $3,246,000,000 | December 31, 2025 | $448,500 | $57,964 |
| 91 | Deutsche Telekom | $178,864,652,086 | Germany | Telecommunications | 198,079 | $139,879,687,460 | $11,449,411,020 | December 31, 2025 | $706,181 | $57,802 |
| 92 | Abbott Laboratories | $178,407,899,136 | United States | Healthcare | 114,000 | $44,328,000,000 | $6,524,000,000 | December 31, 2025 | $388,842 | $57,228 |
| 70 | McDonald’s | $221,781,114,880 | United States | Restaurants | 150,000 | $26,885,000,000 | $8,563,000,000 | December 31,2025 | $179,233 | $57,087 |
| 86 | Mitsubishi UFJ Financial | $191,550,521,344 | Japan | Finances | 150,800 | $72,446,155,243 | $8,470,245,273 | March 31,2025 | $480,412 | $56,169 |
| 50 | CATL | $269,040,588,447 | China | Technology | 185,839 | $60,382,334,400 | $10,289,366,400 | December 31,2025 | $324,917 | $55,367 |
| 99 | Walt Disney | $170,919,034,880 | United States | Entertainment | 231,000 | $94,425,000,000 | $12,404,000,000 | September 27,2025 | $408,766 | $53,697 |
| 89 | Thermo Fisher Scientific | $182,595,649,536 | United States | Healthcare | 125,000 | $44,556,000,000 | $6,704,000,000 | December 31, 2025 | $356,448 | $53,632 |
| 141 | SoftBank | $134,800,581,403 | Japan | Technology | 67,229 | $43,753,096,005 | $3,517,530,569 | March 31, 2025 | $650,807 | $52,322 |
| 139 | Anheuser-Busch Inbev | $134,846,808,064 | Belgium | Food & Beverage | 137,000 | $59,320,000,000 | $6,837,000,000 | December 31, 2025 | $432,993 | $49,905 |
| 5 | Amazon | $2,235,761,950,720 | United States | E-commerce | 1,576,000 | $716,924,000,000 | $77,670,000,000 | December 31, 2025 | $454,901 | $49,283 |
| 185 | Medtronic | $111,248,629,760 | Ireland | Healthcare | 95,000 | $33,537,000,000 | $4,662,000,000 | April 25,2025 | $353,021 | $49,074 |
| 130 | Honeywell | $143,681,781,760 | United States | Industrials | 101,000 | $17,510,000,000 | $4,729,000,000 | December 31, 2025 | $173,366 | $46,822 |
| 189 | Dell | $108,767,248,384 | United States | Technology | 108,000 | $95,567,000,000 | $4,576,000,000 | January 31,2025 | $884,880 | $42,370 |
| 69 | China Mobile | $223,966,698,128 | China | Telecommunications | 461,345 | $149,664,249,744 | $19,537,682,640 | December 31,2025 | $324,409 | $42,349 |
| 128 | ABB | $144,110,307,460 | Switzerland | Industrials | 111,900 | $33,220,000,000 | $4,734,000,000 | December 31, 2025 | $296,872 | $42,306 |
| 134 | Eaton | $138,919,034,880 | Ireland | Industrials | 97,000 | $27,448,000,000 | $4,087,000,000 | December 31, 2025 | $282,969 | $42,134 |
| 59 | Nestlé | $253,141,760,855 | Switzerland | Food & Beverage | 271,000 | $113,007,972,000 | $11,406,872,400 | December 31,2025 | $417,004 | $42,092 |
| 133 | Lockheed Martin | $139,289,001,984 | United States | Aerospace & Defense | 123,000 | $75,048,000,000 | $5,017,000,000 | December 31, 2025 | $610,146 | $40,789 |
| 67 | IBM | $227,460,972,544 | United States | Technology | 264,300 | $67,535,000,000 | $10,593,000,000 | December 31,2025 | $255,524 | $40,079 |
| 146 | Lowe’s Companies | $132,541,620,224 | United States | Retail | 167,000 | $86,286,000,000 | $6,654,000,000 | January 30, 2026 | $516,683 | $39,844 |
| 90 | Siemens | $181,550,930,423 | Germany | Industrials | 318,000 | $92,575,591,680 | $12,185,197,440 | September 30, 2025 | $291,118 | $38,318 |
| 57 | RTX | $259,638,427,648 | United States | Industrials | 180,000 | $88,603,000,000 | $6,732,000,000 | December 31,2025 | $492,239 | $37,400 |
| 125 | Airbus | $146,878,977,510 | Netherlands | Aerospace & Defense | 165,294 | $86,243,537,200 | $6,132,899,860 | December 31, 2025 | $521,758 | $37,103 |
| 175 | Bharti Airtel | $116,789,964,437 | India | Telecommunications | 85,814 | $21,221,721,587 | $3,093,308,144 | March 31,2025 | $247,299 | $36,047 |
| 199 | Delta Electronics (Thailand) | $105,223,914,980 | Thailand | Technology | 21,891 | $6,298,663,022 | $788,767,941 | December 31, 2025 | $287,728 | $36,032 |
| 168 | Delta Electronics | $120,109,615,408 | Taiwan | Technology | 21,891 | $6,298,681,567 | $788,757,655 | December 31, 2025 | $287,729 | $36,031 |
| 143 | Safran | $134,318,713,365 | France | Aerospace & Defense | 110,000 | $36,800,923,140 | $3,728,370,840 | December 31, 2025 | $334,554 | $33,894 |
| 180 | Capital One | $113,458,970,624 | United States | Finances | 76,300 | $53,434,000,000 | $2,453,000,000 | December 31, 2025 | $700,315 | $32,149 |
| 62 | UnitedHealth | $245,608,005,632 | United States | Healthcare | 390,000 | $447,567,000,000 | $12,056,000,000 | December 31,2025 | $1,147,608 | $30,913 |
| 122 | Schneider Electric | $149,028,045,680 | France | Industrials | 160,000 | $47,164,948,320 | $4,890,109,580 | December 31, 2025 | $294,781 | $30,563 |
| 38 | Home Depot | $327,578,222,592 | United States | Retail | 470,000 | $164,683,000,000 | $14,156,000,000 | February 1, 2026 | $350,389 | $30,119 |
| 10 | Tesla | $1,394,966,528,000 | United States | Automotive | 134,785 | $94,827,000,000 | $3,794,000,000 | December 31, 2025 | $703,543 | $28,149 |
| 73 | Pepsico | $212,272,250,880 | United States | Food & Beverage | 306,000 | $93,925,000,000 | $8,240,000,000 | December 27,2025 | $306,944 | $26,928 |
| 160 | Fast Retailing | $123,517,055,314 | Japan | Retail | 109,990 | $23,123,400,000 | $2,945,014,860 | August 31, 2025 | $210,232 | $26,775 |
| 94 | Inditex | $177,471,803,535 | Spain | Retail | 279,859 | $47,265,150,240 | $7,374,805,200 | January 31, 2026 | $168,889 | $26,352 |
| 112 | Amphenol | $155,311,308,800 | United States | Technology | 170,000 | $23,094,700,000 | $4,270,300,000 | December 31, 2025 | $135,851 | $25,119 |
| 22 | Costco | $442,284,802,048 | United States | Retail | 341,000 | $275,235,000,000 | $8,099,000,000 | August 31, 2025 | $807,141 | $23,751 |
| 174 | Corning | $116,800,249,856 | United States | Technology | 67,200 | $15,629,000,000 | $1,596,000,000 | December 31, 2025 | $232,574 | $23,750 |
| 78 | Reliance Industries | $198,679,704,290 | India | Energy | 403,303 | $125,320,000,000 | $9,513,000,000 | March 31, 2025 | $310,734 | $23,588 |
| 117 | Foxconn Industrial Internet | $152,176,669,633 | China | Technology | 217,084 | $128,672,232,144 | $5,028,678,432 | December 31, 2025 | $592,730 | $23,165 |
| 195 | HCA Healthcare | $105,826,967,552 | United States | Healthcare | 320,000 | $75,600,000,000 | $6,784,000,000 | December 31, 2025 | $236,250 | $21,200 |
| 124 | Siemens Energy | $146,978,263,565 | Germany | Energy | 101,414 | $45,842,010,240 | $1,976,707,200 | September 30, 2025 | $452,028 | $19,491 |
| 140 | Hitachi | $134,839,468,464 | Japan | Industrials | 280,000 | $65,407,523,979 | $4,116,342,391 | March 31, 2025 | $233,598 | $14,701 |
| 196 | EssilorLuxottica | $105,780,134,200 | France | Healthcare | 200,000 | $33,467,238,060 | $2,719,337,900 | December 31, 2025 | $167,336 | $13,597 |
| 93 | TJX Companies | $177,736,318,976 | United States | Retail | 364,000 | $56,360,000,000 | $4,864,000,000 | February 1, 2025 | $154,835 | $13,363 |
| 110 | Boeing | $156,406,562,816 | United States | Aerospace & Defense | 182,000 | $89,463,000,000 | $2,238,000,000.00 | December 31, 2025 | $491,555 | $12,297 |
| 12 | Walmart | $990,810,210,304 | United States | Retail | 2,100,000 | $713,200,000,000 | $21,893,000,000 | January 31, 2026 | $339,619 | $10,425 |
| 165 | Accenture | $122,034,626,560 | Ireland | Technology | 779,000 | $69,673,000,000 | $7,832,400,000 | August 31, 2025 | $89,439 | $10,054 |
| 137 | BYD | $136,388,374,021 | China | Automotive | 869,600 | $114,574,654,094 | $4,648,602,063 | December 31, 2025 | $131,756 | $5,346 |
| 150 | HDFC Bank | $127,661,752,320 | India | Finances | 214,521 | $382,027,790 | $131,684,762 | March 31,2025 | $1,781 | $614 |
| 71 | Intel | $221,577,199,616 | United States | Technology | 85,100 | $52,853,000,000 | -$267,000,000 | December 27,2025 | $621,069 | -$3,137 |