
Buying a home is as much a question of timing and place as it is of money. In some parts of America, homes sell quickly and buyers compete to offer more; in others, properties linger on the market as prices soften and choices expand. A growing supply of homes can give buyers more room to negotiate, but it does not necessarily make ownership affordable, particularly when borrowing costs remain high. And while national trends offer a glimpse of the market as a whole, the experience of buying or selling a home can look very different from one state to the next.
To see how these differences play out across the country, the team at BestBrokers analyzed Redfin data to compare housing market conditions across all 50 states and the District of Columbia, from the number of homes available for sale and how quickly properties sell to median sale prices and the likelihood of buyers paying above asking. We also examined how inventory and months of supply have changed since 2025, traced the year-on-year movement in home prices, and identified the metro areas where buyer activity has fallen most sharply. Together, these comparisons offer a closer look at where housing markets are gaining momentum, where demand is cooling, and how conditions vary across the country.
The Northeast remains a hotspot for housing competition, with several states recording the highest shares of homes selling above asking price and some of the country’s fastest sales. In the South, conditions are more mixed: Florida and Texas are seeing sharp declines in buyer activity, while Georgia and North Carolina are experiencing some of the largest increases in homes available for sale. Meanwhile, some of the strongest year-on-year home price gains are led by Wyoming and Illinois, showing that price growth is not confined to the country’s traditionally expensive coastal markets.
Key Takeaways:
- The number of homes available for sale rose the most in Washington at +19.30%, while Florida saw the sharpest drop, at -11.53%.
- Hawaii has the slowest-moving housing market, with homes taking 93 days to sell on average, compared with just 27 days in Kansas.
- Connecticut has the strongest bidding pressure, with 51.95% of homes selling above asking price.
- Buyer activity fell most sharply in the Miami metro area, down 25.02% year-on-year, followed by Fort Worth (-24.35%) and Houston (-23.33%).
The Many Realities of America’s Housing Market
Homebuyers face very different odds across the U.S., and housing prices alone do little to explain why. Florida and Texas have the largest inventories, averaging 165,437 and 145,290 homes available for sale every month. In addition, only 7.91% of homes in Florida and 9.01% in Texas sell above asking price. At that pace of sales and considering the large inventory of available real estate, in both states it would take over five months for all homes to be sold. Moreover, separate properties take an average of 74 days to sell in Florida and 71 in Texas, much longer than in smaller states where homes are scarce and take just two to three weeks to sell. Together, these indicators point to less intense bidding competition than in markets where homes sell faster and above-asking sales are more common.
The relationship between prices and buyer competition becomes more evident when you compare relatively affordable states like Texas with the country’s most expensive housing markets. Hawaii has the second-highest median sale price at $743,924, but homes take an average of 93 days to sell, the longest of any state, and just 15.69% sell above asking. California, with a similar median sale price of $751,871, sees homes sell in 41 days on average, with 32.59% fetching more than their original asking price, pointing to much higher demand. Montana basically presents the worst-case scenario for sellers, combining relatively high prices, at $512,746, with an average of 85 days on the market and a very low share of above-asking sales, just 0.01%. These comparisons show why prices need to be considered alongside selling times, inventories, and overall demand when assessing buyer competition.
The U.S. Housing Market by State: 2026 Snapshot
State-by-state comparison of housing supply, sales activity, home prices and market conditions, January-September 2026
*Total number of new homes listed for sale and homes under contract across January-September 2026.
Sources: Redfin
Tighter inventory coincides with stronger bidding competition in some states, although the intensity varies. All listed properties could be sold in a little over two months in Connecticut, Rhode Island, Kansas and Nebraska, if no new properties enter the market during this time. Homes sell in an average of 40 days in Connecticut, 31 in Rhode Island, 27 in Kansas and 31 in Nebraska. Above-asking sales account for 51.95% of transactions in Connecticut and 42.08% in Rhode Island, versus 22.68% in Kansas and 22.73% in Nebraska. Over the nine months to October, Connecticut has recorded 31,339 new listings in total, while in Rhode Island, 10,087 homes have entered the market, giving buyers in both states a steady stream of new properties to consider despite the limited time homes typically spend on the market.
Strong buyer competition is also evident in relatively affordable markets. From January through September on average, Illinois has a median sale price of $320,933, with 35.35% of homes selling above asking price and just 2.93 months of supply. Wisconsin shows a similar pattern: its median sale price is $340,869, 34.16% of homes sell above what is asked, and supply also averages 2.93 months. These figures show that competitive bidding is not limited to expensive housing markets, with multiple factors playing a role in whether a market is hot or not. Just several states show a healthy, balanced housing market where supply is 5 to 6 months – Texas, Georgia, Florida, and Montana.
How Long Properties Remain Listed for Sale in Each State
Homes sell more than three times faster in Kansas than in Hawaii, where properties spend an average of 27 and 93 days on the market, respectively. Massachusetts also ranks among the fastest-moving markets, at just 28 days, while Montana averages 85 days, South Carolina 76, Florida 74, and Texas 71. These differences highlight how much time buyers and sellers can expect to spend navigating the market, with shorter selling periods generally indicating a faster pace of transactions.
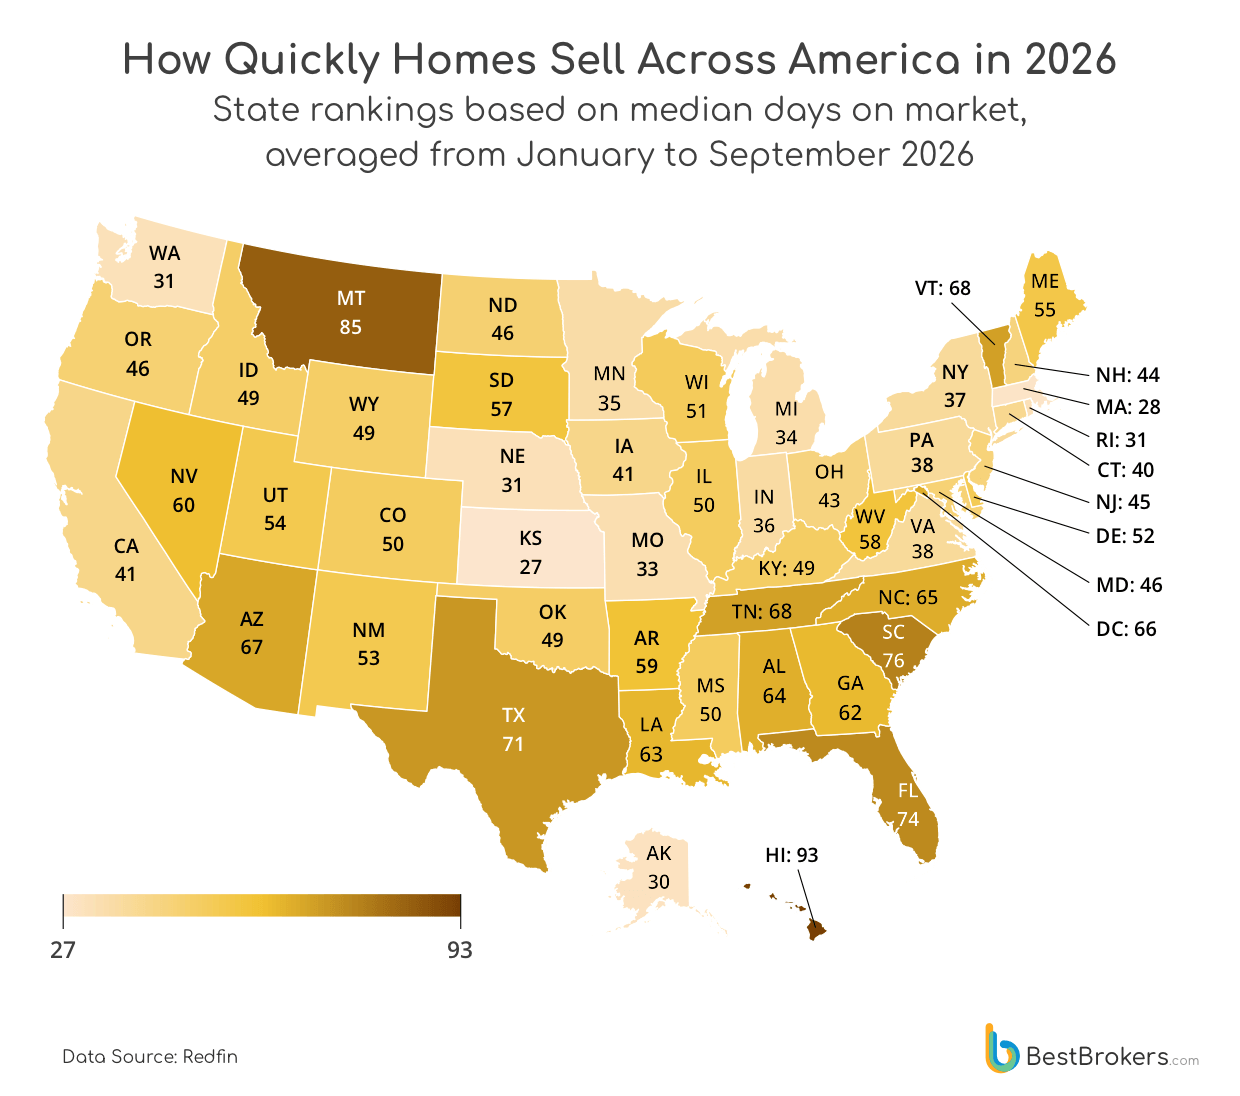
The pace of the market can also vary sharply between neighboring states. Homes spend an average of 31 days on the market in Washington, compared with 49 in Idaho and 60 in Nevada, which is also in close proximity, while Massachusetts averages 28 days against 68 in Vermont. Such contrasts show why national and regional averages can obscure substantial differences between individual states, where properties may sell in around a month or remain on the market for two to three months.
The High Stakes of Finding a Home
Buyers are paying above asking price most often in the Northeast, even as home prices vary considerably across the region. Connecticut leads the ranking, with 51.95% of homes selling above asking price, followed by New Jersey at 43.27% and Rhode Island at 42.08%. One possible explanation is a mismatch between the number of homes available and the number of people looking to buy them. In established Northeast markets, limited housing supply, high land and construction costs, and competition for homes in desirable communities can push buyers to bid against one another.
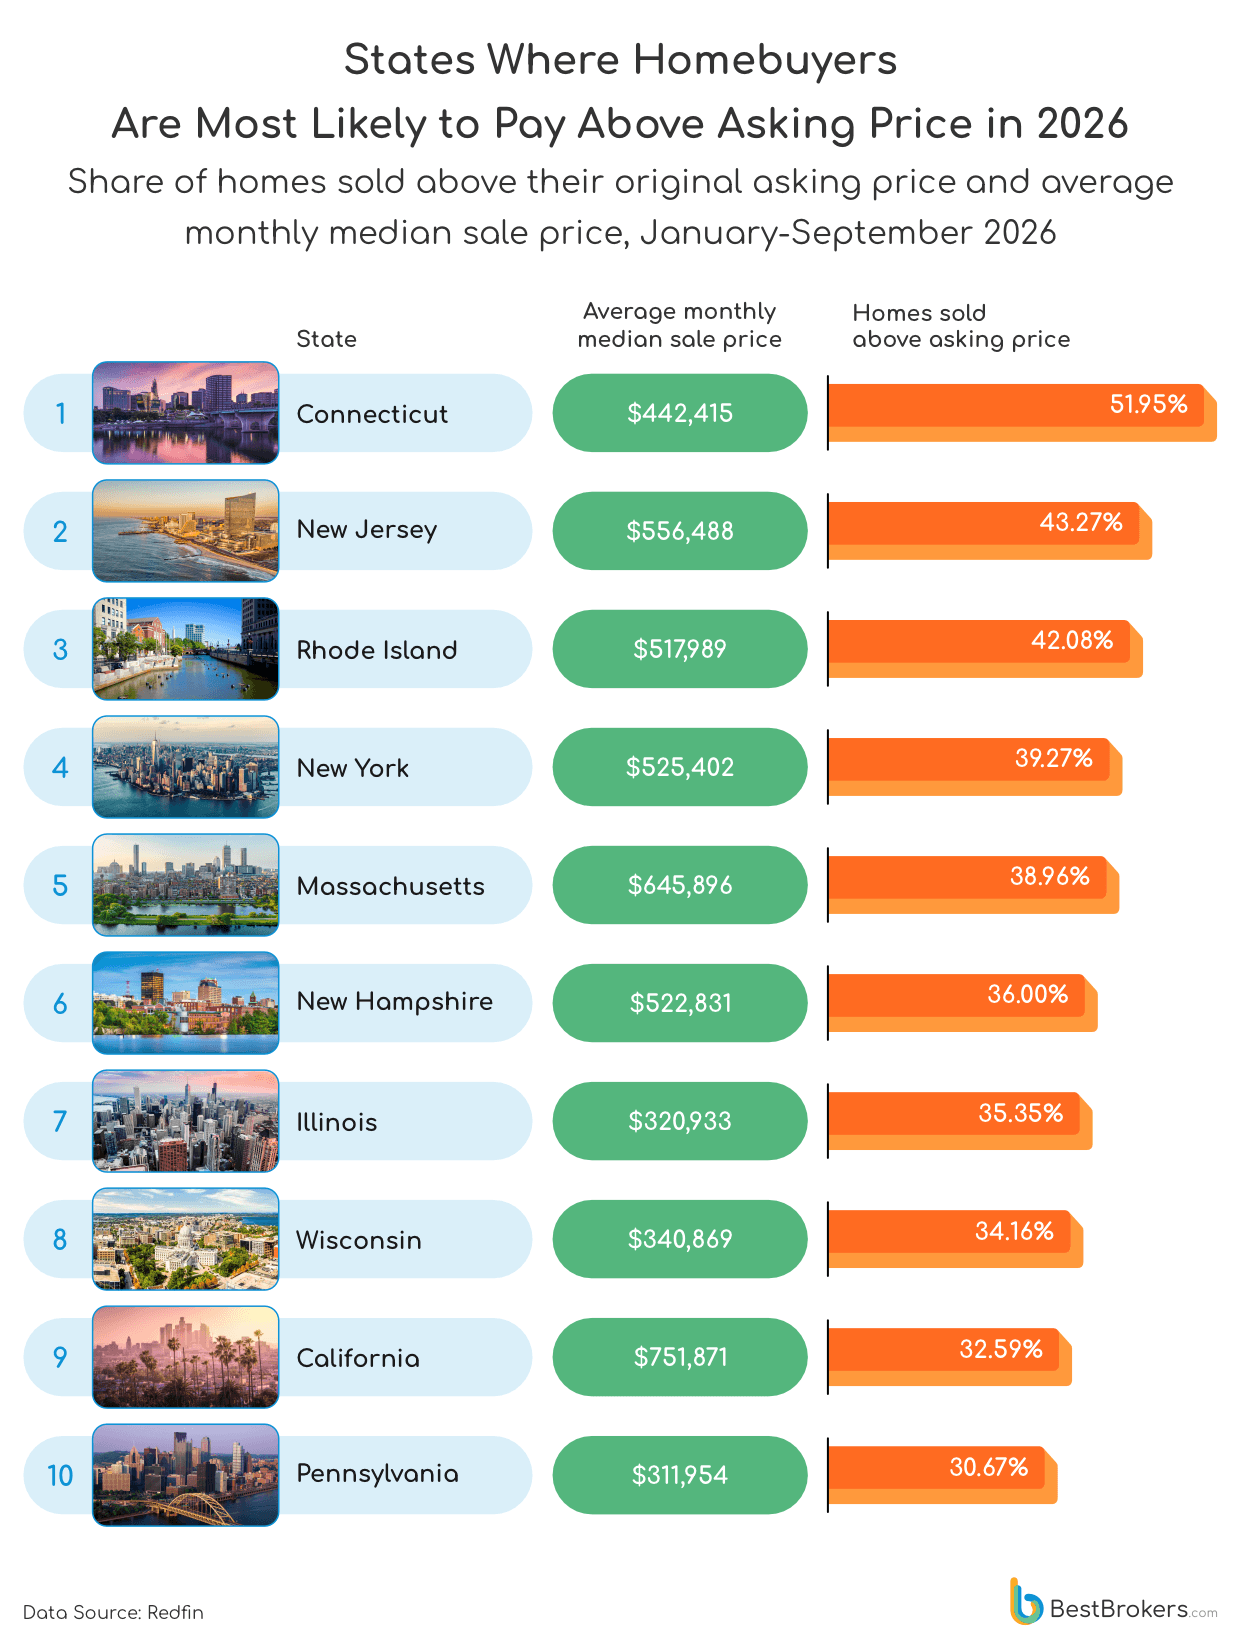
Connecticut’s lead is particularly striking given that its median sale price of $442,415 is considerably lower than those of neighboring New Jersey, New York, and Massachusetts. Buyers there might be drawn by the relatively more attainable prices, while still seeking homes within reach of major employment hubs and desirable communities. If demand in these areas outstrips the number of homes available, those looking to buy residential property may be willing to offer more than the asking price to secure a property.
California stands out for having the highest median sale price in the group and in the country overall, at $751,871, yet 32.59% of homes are still sold above asking price. This suggests that competition can persist even in high-cost markets, where desirable properties may attract multiple offers, despite already elevated prices. However, the relatively lower share compared with Connecticut indicates that expensive housing does not support more frequent bidding wars.
The States Seeing the Biggest Changes in Available Homes
The number of homes available to buy is growing across several states, giving buyers more properties to choose from. Washington recorded the largest increase nationwide, at 19.30%, followed by Vermont at 18.01%, Massachusetts at 16.17%, and Maryland at 15.99%. North Carolina and Georgia also saw increases of more than 14%. If more homes are available while the number of buyers remains steady, people looking to purchase may have more room to compare properties and negotiate prices. However, it should be noted that a larger selection does not mean homes are becoming cheaper. Of all the states mentioned above, prices dropped year-on-year only in Washington, down 1.51%.
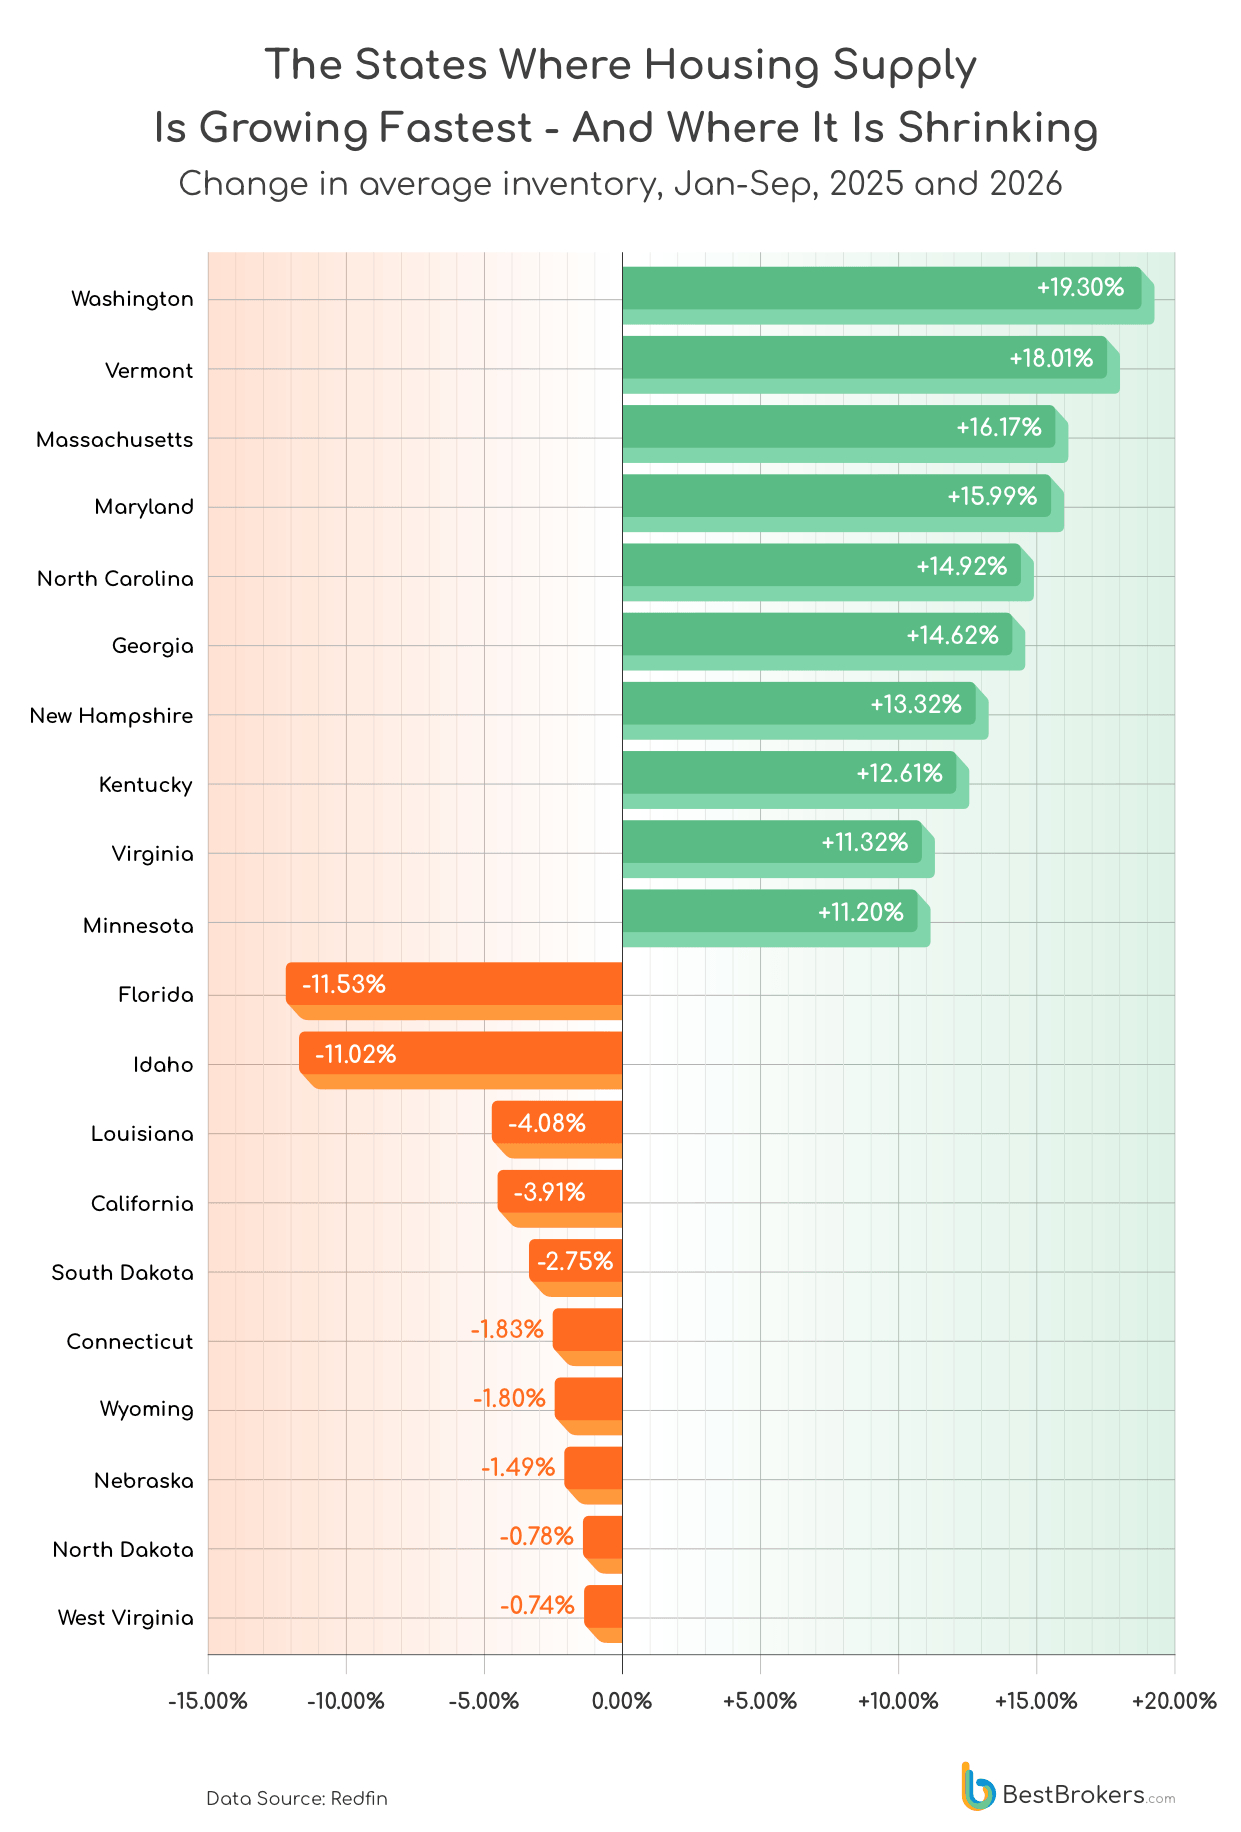
Florida and Idaho are moving in the opposite direction. The average number of homes for sale fell by -11.53% in Florida and -11.02% in Idaho, the two largest declines among all states. California also saw a smaller drop of -3.91%. With fewer properties on the market, buyers in these states may have less choice, particularly if many people are still looking to purchase. The figures do not reveal whether homes are selling faster or fewer owners are putting their properties up for sale, but they do show that buyers’ options are shrinking, which might lead to upward pressure on price.
Where Homebuyers Have More (or Less) Breathing Room in 2026
Florida has seen the biggest shift toward a tighter housing market, with the time needed to sell all homes currently listed, at the existing sales pace, falling from 6.56 months in 2025 to 5.64 months in 2026. Idaho follows, with the same measure dropping from 4.01 to 3.32 months. In practical terms, buyers in these states have a smaller pool of homes to choose from relative to the number being sold. Florida’s change is especially notable because, despite the decline, it still has a larger supply of homes than many other states.
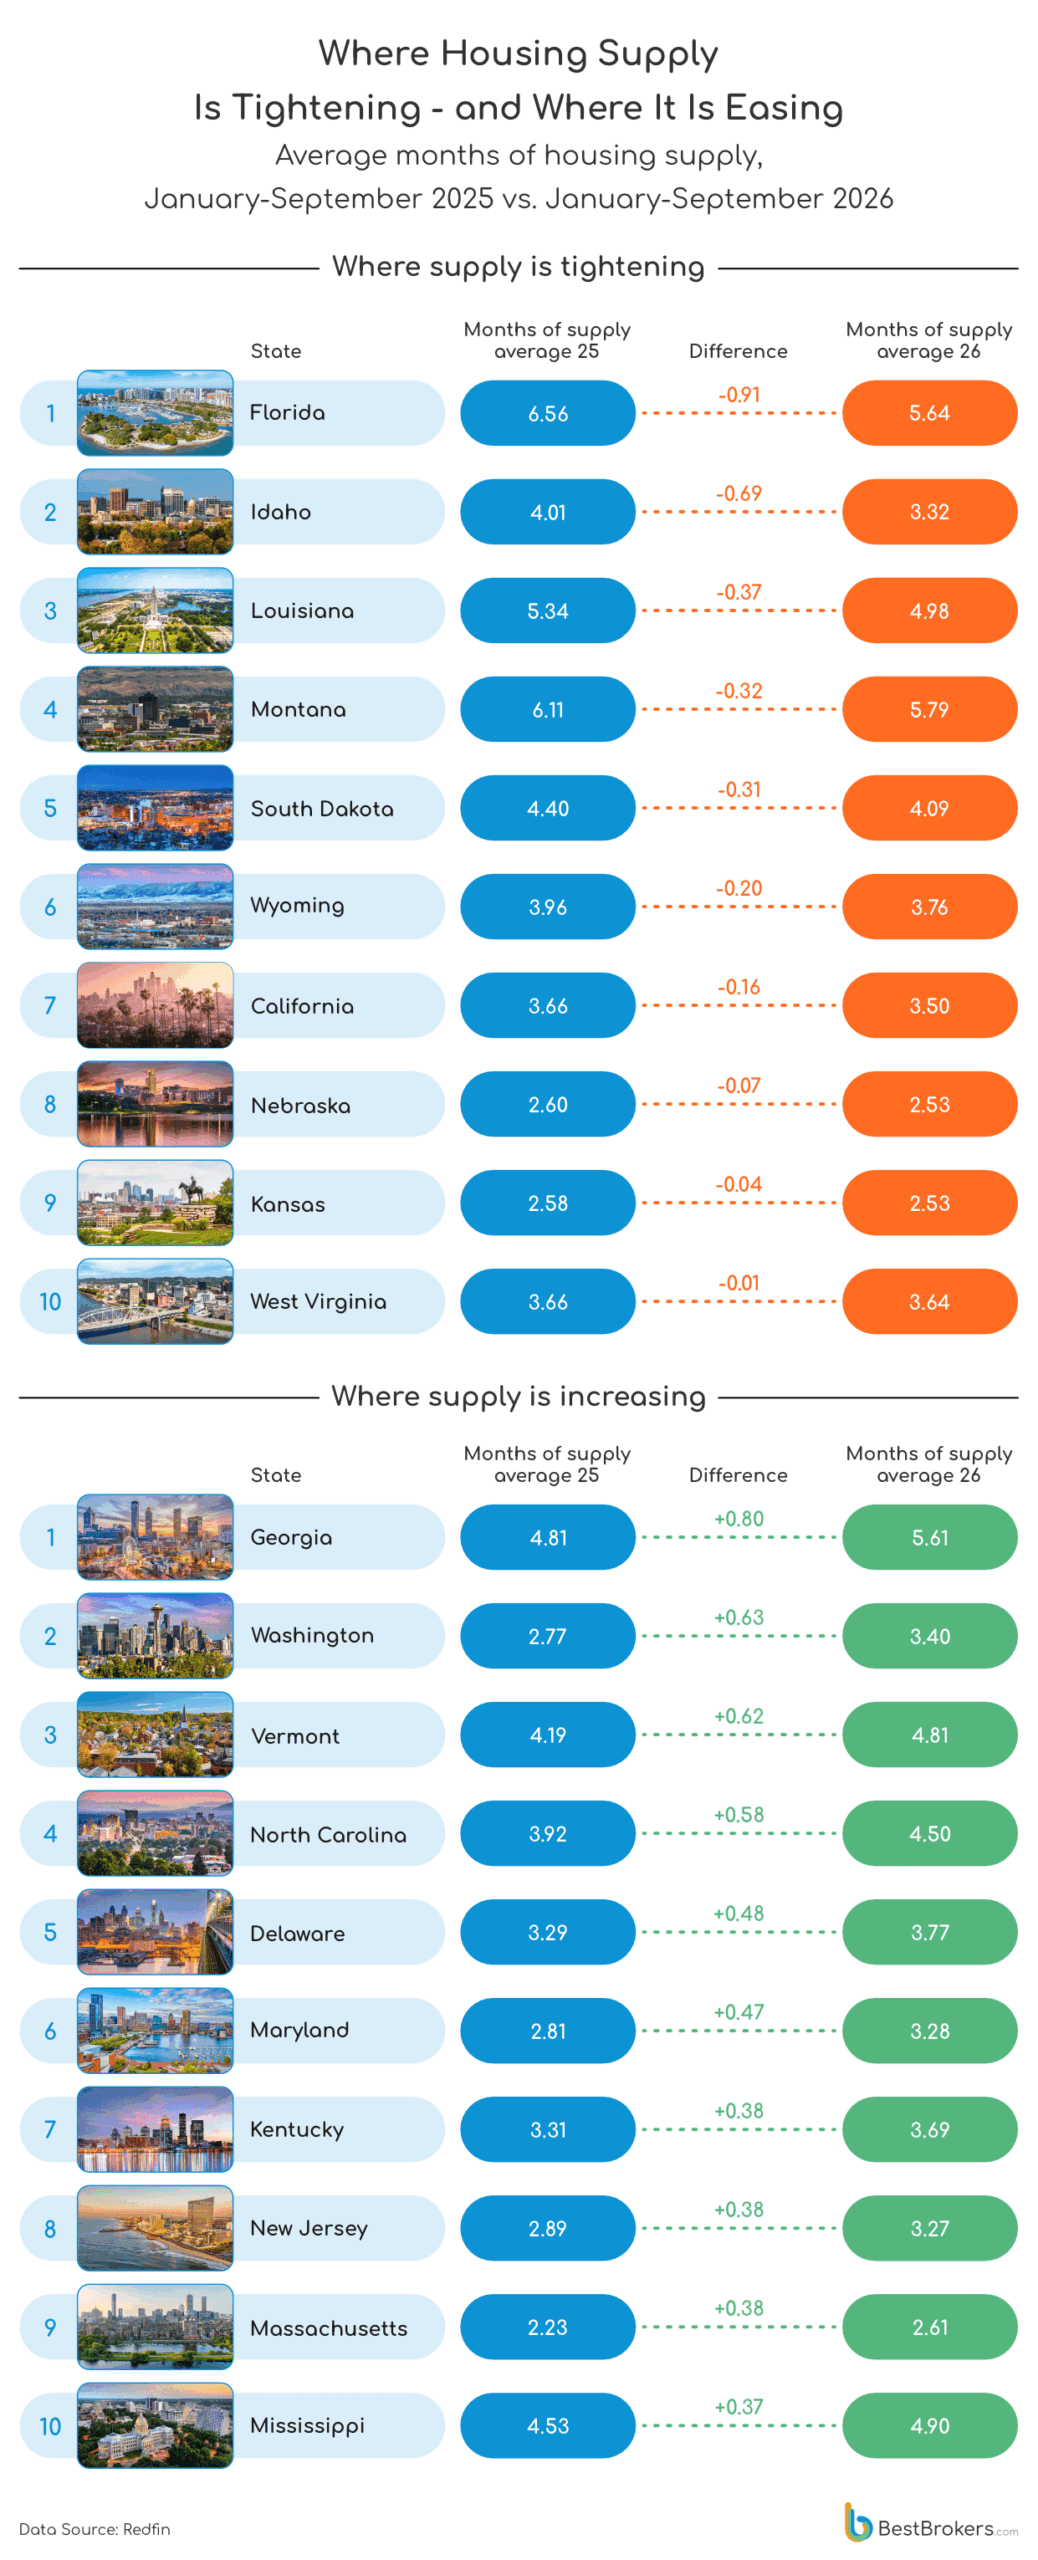
In Georgia, the time it would take to sell the homes currently listed increased from 4.81 months to 5.61 months, the largest rise among the states examined. Washington, Vermont, and North Carolina also saw substantial increases, giving buyers in these markets more choice relative to the pace of sales than they had a year earlier.
Change in Residential Property Prices and Buyer Activity
Wyoming led the country in home-price growth, with the median sale price rising 8.93% in a year, from $362,500 to $394,865. Illinois followed at 7.06%, reaching $323,321 in September, while New York prices climbed 6.84% to $523,496. The strongest gains were spread across several parts of the country, with South Dakota and Kansas up more than 5% alongside Pennsylvania, Ohio, and Kentucky. This puts the spotlight on markets beyond the expensive coastal hubs, where even more modest starting prices can make homeownership a significant financial commitment. Wyoming’s case is quite flabbergasting: buyers now pay nearly $32,400 more for a median-priced home than they did a year earlier
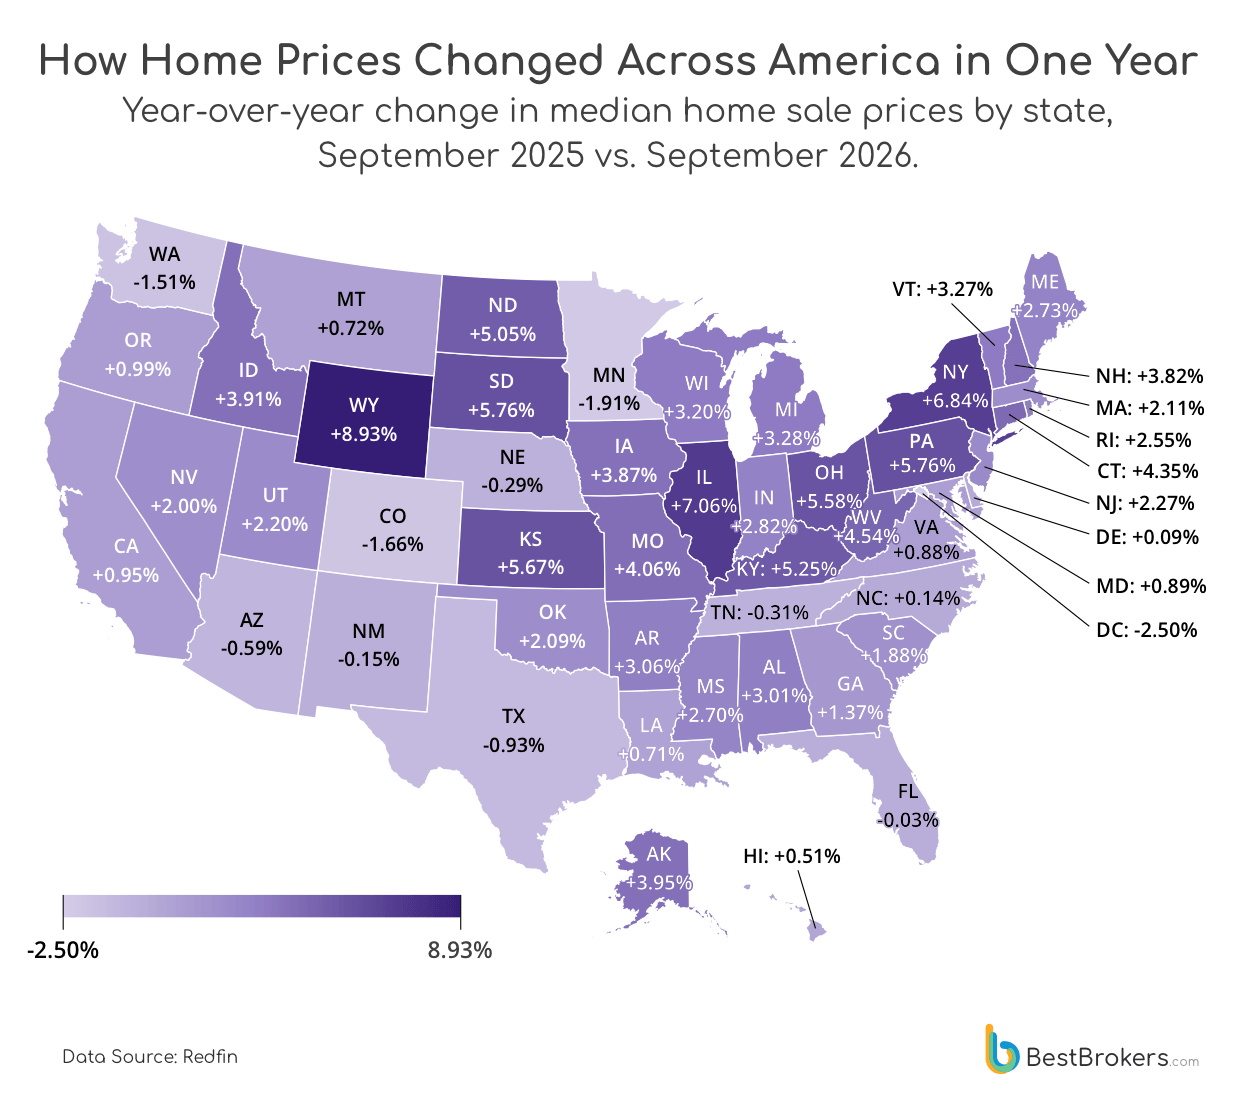
Price growth was much weaker in several high-cost markets, and some saw prices fall. The District of Columbia recorded the steepest decline, down 2.50% from $675,000 to $658,109, followed by Minnesota, where the median fell 1.91% to $353,036. Colorado prices dropped -1.66% to $540,846, while Washington saw a 1.51% decrease to $590,204. Florida was essentially flat at $383,897, down just 0.03%. Meanwhile, California and Hawaii remained among the most expensive places to buy, at around $753,000, but prices rose by less than 1% in both.
The U.S. Housing Markets Losing the Most Buyers
Florida and Texas account for four of the 10 U.S. metro areas where the number of buyers has fallen fastest, with Miami leading the ranking at -25.02%, followed by Fort Worth (-24.35%) and Houston (-23.33%). Orlando also recorded a decline of -20.71%. The pullback is notable in Sun Belt markets that have attracted substantial population growth in recent years, as strong demand can become harder to sustain when homeownership costs rise. Mortgage rates, insurance premiums, and other ownership expenses can push prospective buyers to delay purchases, even in places where housing options have expanded. The figures alone do not establish which factors are driving the declines in each metro, but they point to a substantial retreat in the number of people actively buying homes.
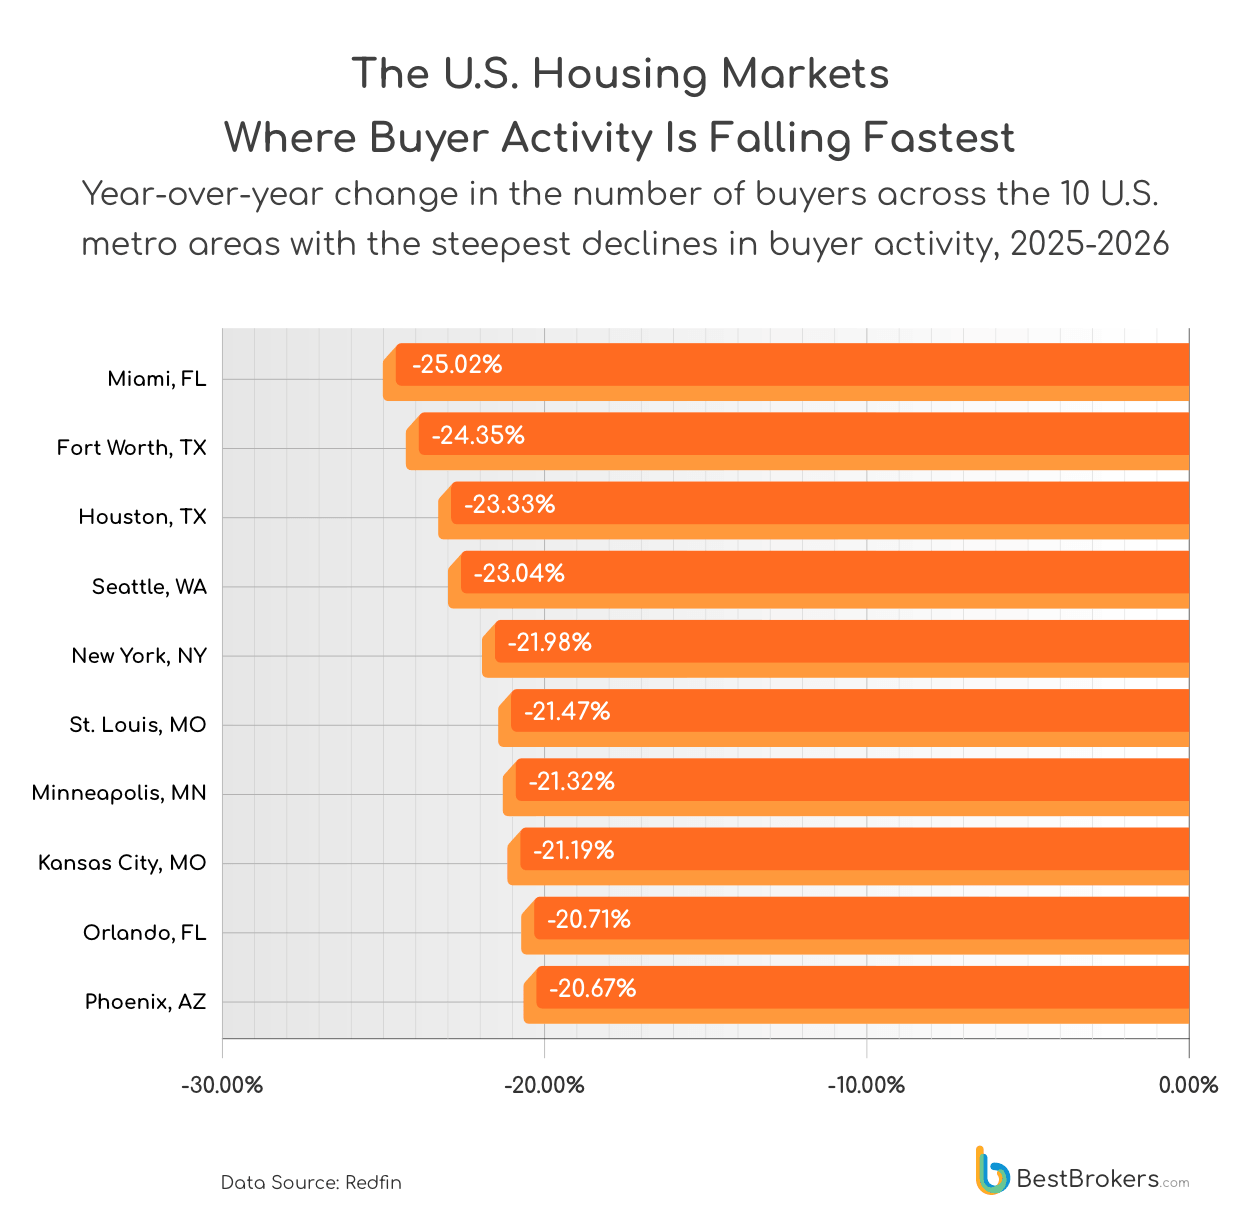
The slowdown also reaches major markets elsewhere, from Seattle (-23.04%) and New York (-21.98%) to Minneapolis, St. Louis and Kansas City, where buyer activity fell by around 21%. This breadth matters: the decline is not confined to one region or one type of housing market. When fewer buyers are active, sellers may have to wait longer for offers or adjust their asking prices to attract interest, while buyers who remain in the market may have more scope to negotiate. However, falling buyer activity does not indicate home prices will drop at the same pace, since prices also depend on how many homes are available and how willing sellers are to accept lower offers.
Methodology
The team at BestBrokers analyzed Redfin data to compare housing market conditions across all 50 U.S. states and the District of Columbia. The study examined homes for sale, new listings, homes under contract, months of housing supply, days on market, median sale prices, and the share of homes sold above asking price. It also tracked changes in housing supply and prices between 2025 and 2026 and identified the 10 metro areas with the steepest annual declines in buyer activity.
Home availability and days on market were measured using averages, while new listings and homes under contract were summed across January-September. Homes under contract, also known as pending sales, are properties where the seller has accepted an offer but the sale has not yet closed. Months of supply estimates how long it would take to sell the homes currently listed at the prevailing sales pace, assuming no new properties enter the market. Price changes compare September 2025 with September 2026. The findings reflect listed properties and market activity, not the total housing stock or the causes of changing demand.