Owning a home is part of the American dream. But home prices in the U.S. have considerably outpaced both inflation and income growth over the past couple of decades.
If you are hoping to finally buy a house this year, you might find yourself out of luck. Factors such as still-high mortgage rates, rising construction costs, a limited housing stock amidst surging demand, and lingering post-COVID implications are most likely to make the 2024 housing market a tough one, especially for young Americans. And yet, despite the overall expensive real estate landscape, some states offer relatively affordable housing options when we take the ratio between home price and income into account.
Eager to find how prices vary by state and where people can score a home without breaking the bank, the team at BestBrokers conducted a thorough analysis of median home sale prices for all residential properties across the U.S. in 2023, drawing data from Redfin. To get a sense of how many years of savings it would take the average American to buy a home in every state around the country, we correlated these prices with per capita personal income figures for the third quarter of the same year, sourced by the U.S. Bureau of Economic Analysis. Then, we ranked the states based on home affordability and meticulously curated the top 10 most affordable states for prospective homebuyers, as well as the top 10 least affordable states in the country.
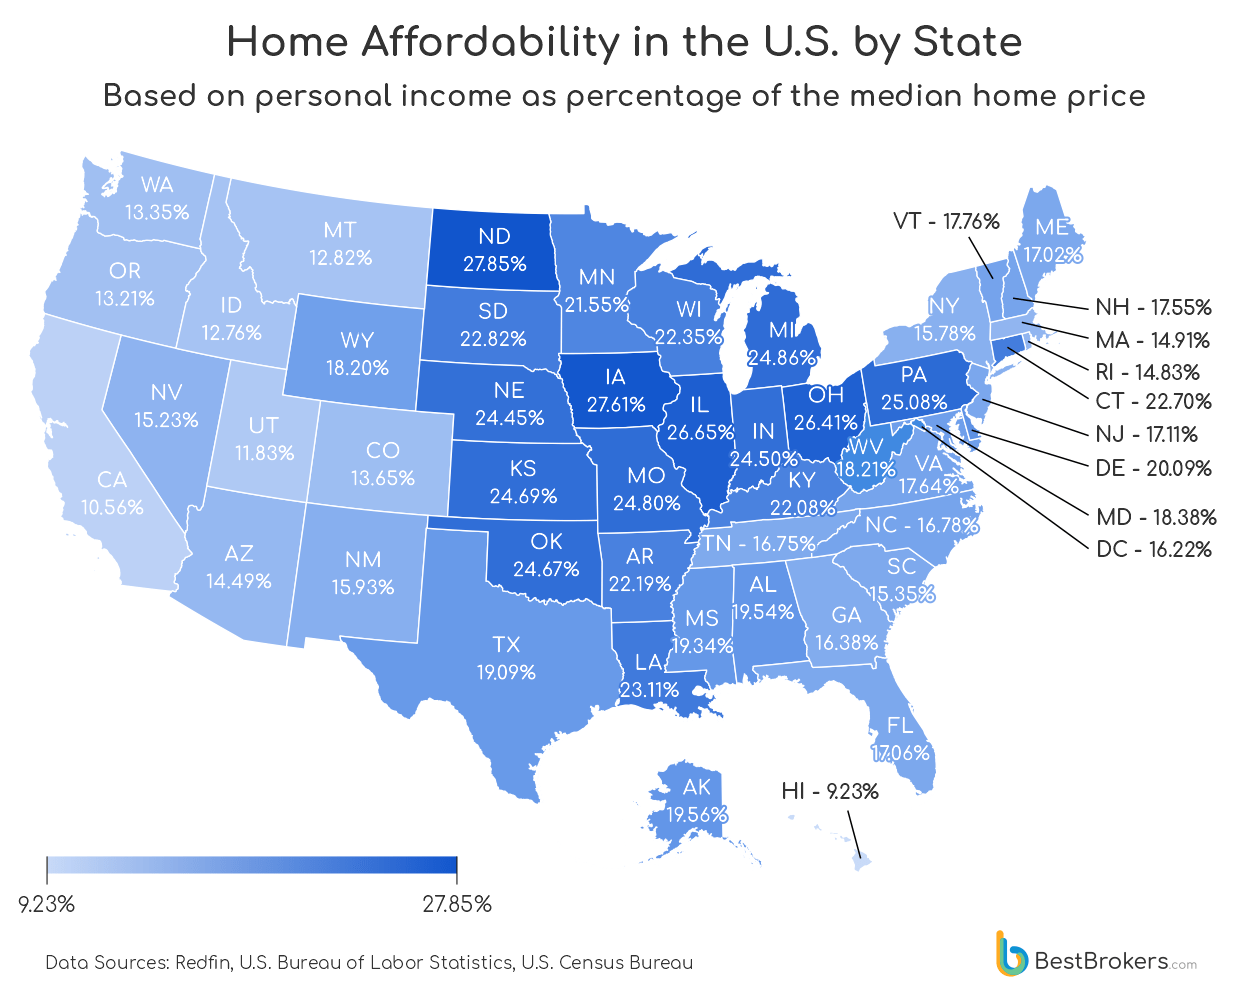
To get a more visual representation of the pricing, we created a map illustrating the income per capita as a percentage of the median home price in every state. A higher percentage indicates a more balanced correlation between price and income and vice versa.
Affordability Crisis Deepens: Prices Surge, Incomes Lag
Home values remained elevated throughout much of 2023, experiencing a noticeable decline towards the end of the year, reported Redfin. However, this drop doesn’t necessarily equate to increased affordability as housing prices remain at near record highs, with no market crash in sight, as some experts had previously predicted.
Last year, existing property sales fell to their lowest level in nearly 30 years, while the median price surged to historic highs, according to a recent report by the National Association of Realtors. Although personal income has also risen since the 2000s, it has failed to keep pace with the soaring housing rates, resulting in a widening gap between income growth and home prices. From 2000 to 2023, median income in the U.S. increased by 63.82%, from $41,990 to $68,786 per year, while the median home price surged by 241.49%, from $119,600 to $408,428, as per the latest data from the U.S. Census Bureau.
The average age of homebuyers has also risen, with the typical buyer now being 44 years old, compared to 25-34 in 1981. In the past, people were more able to afford mortgages as borrowing money was cheap but this is no longer the case. The dollar had an average inflation rate of 2.46% per year between 2000 and today, producing a cumulative price surge of 79.10%. Consequently, today’s prices are 1.79 times higher than the average prices since 2000, as per the Bureau of Labour Statistics consumer price index. Essentially, a dollar today can only buy 55.866% of what it could buy back then.
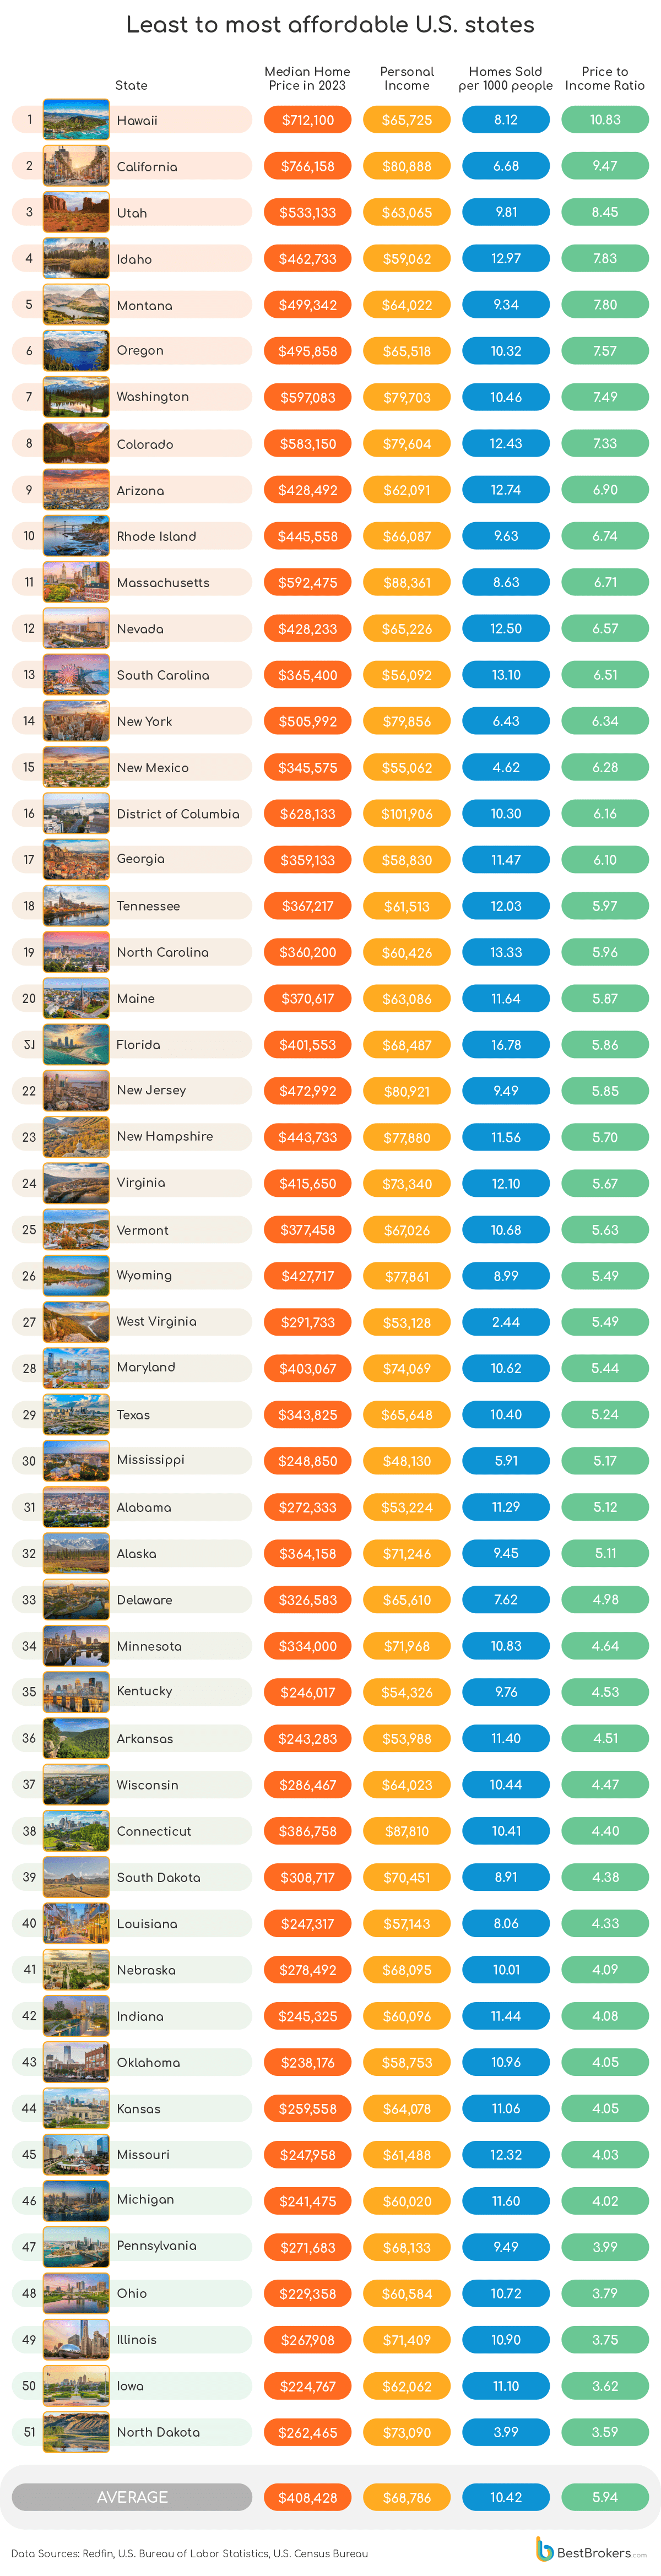
As per our findings, In New York State the median home value stood at $505,992 as of 2023, while the income per capita added up to $79,856, resulting in a home price-to-income ratio of 6.34. In other words, those living in the state would have to save their salaries for approximately 6 years and 4 months to buy a home with cash. This isn’t, however, the worst home price-to-income ratio at all. Even though the cost of living in the State of New York is notoriously high, perhaps largely influenced by New York City, those living in Hawaii, California and Utah face even worse levels of home affordability, according to our research.
Most Affordable to Least Affordable States for Homebuyers: Home Value vs. Personal Income
The U.S. median home sale price reached $408,428 in 2023, while the per capita income totaled $68,786 as of the third quarter. This equates to the median house price being almost six times a person’s annual salary.
Among all states, the District of Columbia had the highest median home value from 1940 to 1950, according to the U.S. Census Bureau. In 1960, however, Hawaii became the leader and has remained there up to this day. The Aloha State features a staggering median home value of $712,100, compared to a per capita income of $65,725. This translates to individuals’ annual income accounting for only 9.23% of the amount required to purchase a home, and they would need to save nearly 11 years’ worth of their salaries to afford one. At the other end of the spectrum, North Dakota emerges as the most affordable state for homebuyers, although it will still take a person on average salary ($73,090/year) about 3 years and 7 months to cover the median price of a home ($262,465).
All of our top 10 most affordable states (8 of which are in the Midwest) command median home prices under $300k, which indeed makes them relatively accessible when we take income per capita into account. Notably, only one state, Oklahoma, features an income under $60k. Conversely, the states with the highest price-to-income ratio (mostly Western) are well beyond the budget of most Americans, including the ones residing within them.
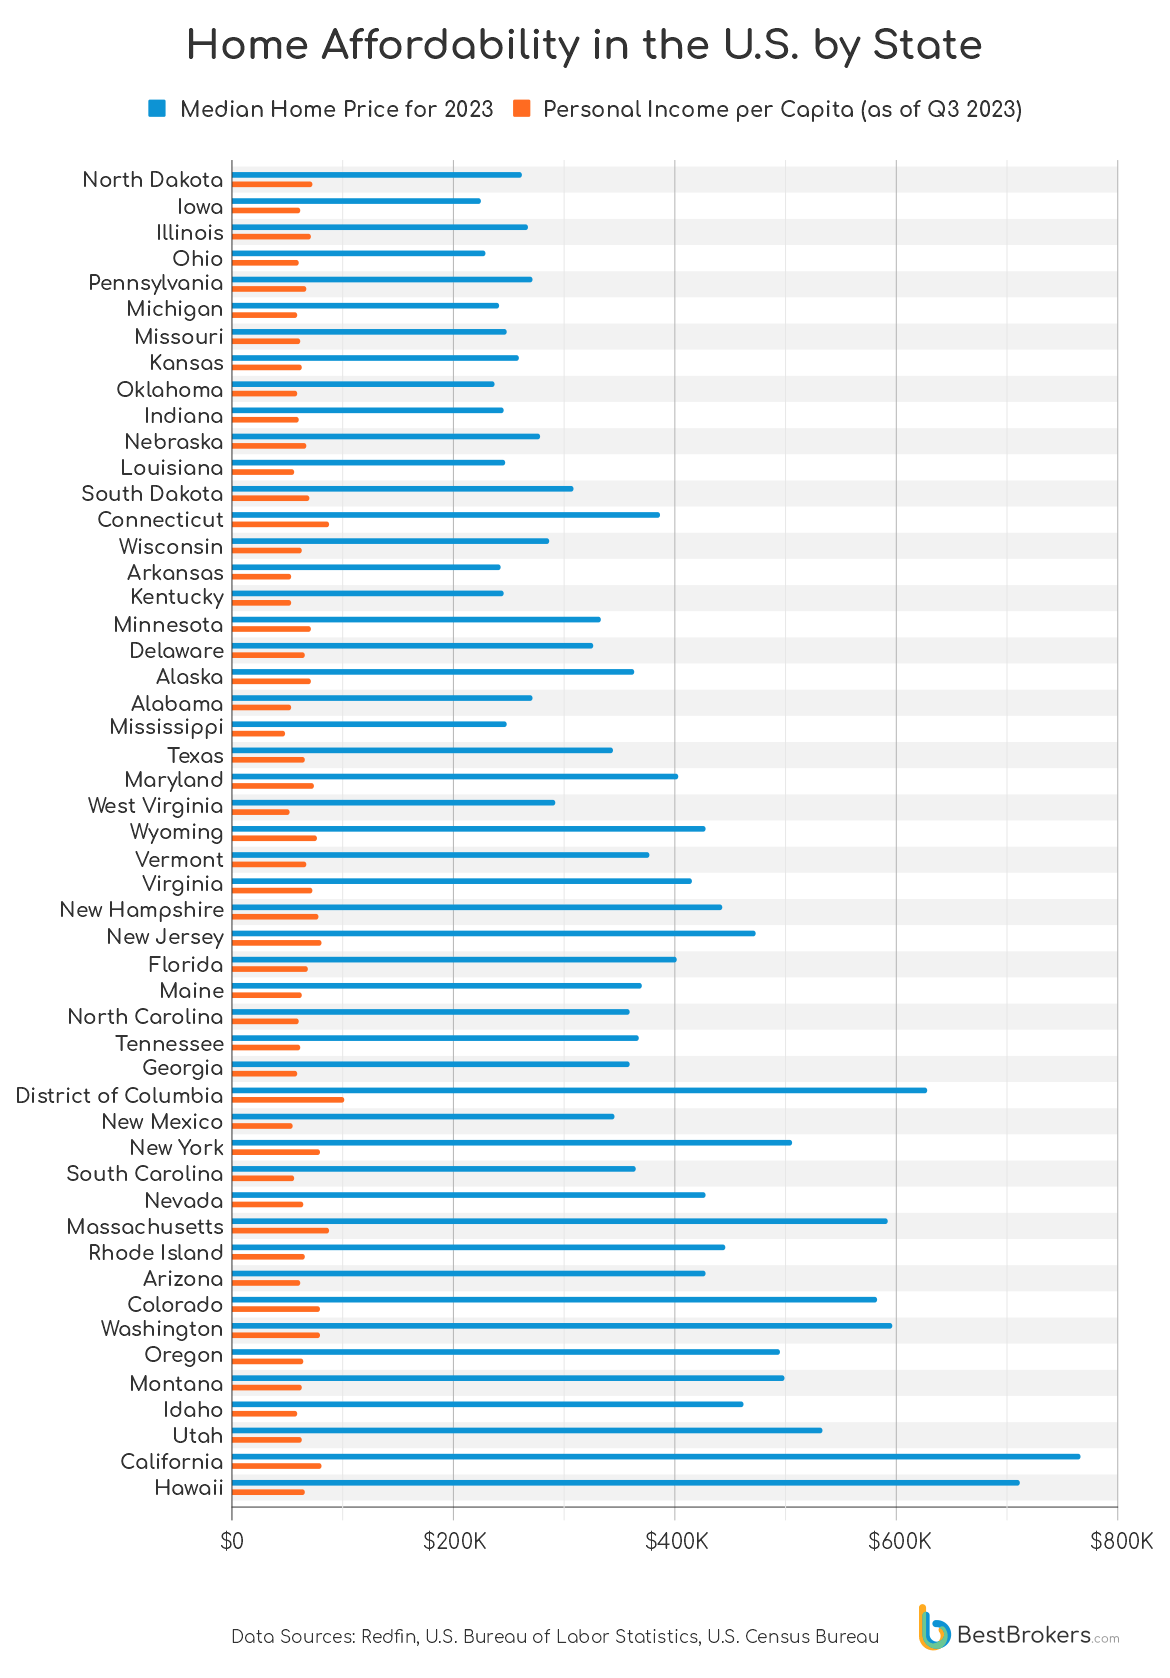
Californians face the highest median home value in the country ($766,158), nearly double the national average, while Iowa boasts the lowest at $224,767. Residents of Washington, D.C., enjoy the highest per capita income in the U.S. ($101,906/year), whereas the lowest-paid workers ($48,130/year) reside in Mississippi.
As for the most home sales last year, the award goes to Florida (379,355). It also holds the top position when we consider the homes sold per 1000 people ratio (16.78). North Carolina (13.33), South Carolina (13.10) and Idaho (12.97) are following closely behind. Although California and Texas also experienced a significant number of home sales, they lag when we examine the same ratio. North Dakota, despite being the most affordable state, recorded the lowest number of home sales in 2023 (3,125), while West Virginia bottomed the ranking with the smallest number of home sales per 1000 residents (ratio of 2.44).
Another thing to note is that living in coastal areas— particularly in coastal cities in California and along the New York–Boston–Washington corridor— tends to be staggeringly more expensive compared to inland. Since coastal communities are highly vulnerable to natural disasters such as hurricanes and flooding, homeowners must pay higher taxes and insurance costs. Their natural beauty, access to amenities such as beaches and waterfronts, and the transportation of goods over longer distances— as is the case with Hawaii, also drive prices up.
The Most Affordable States for Homebuyers
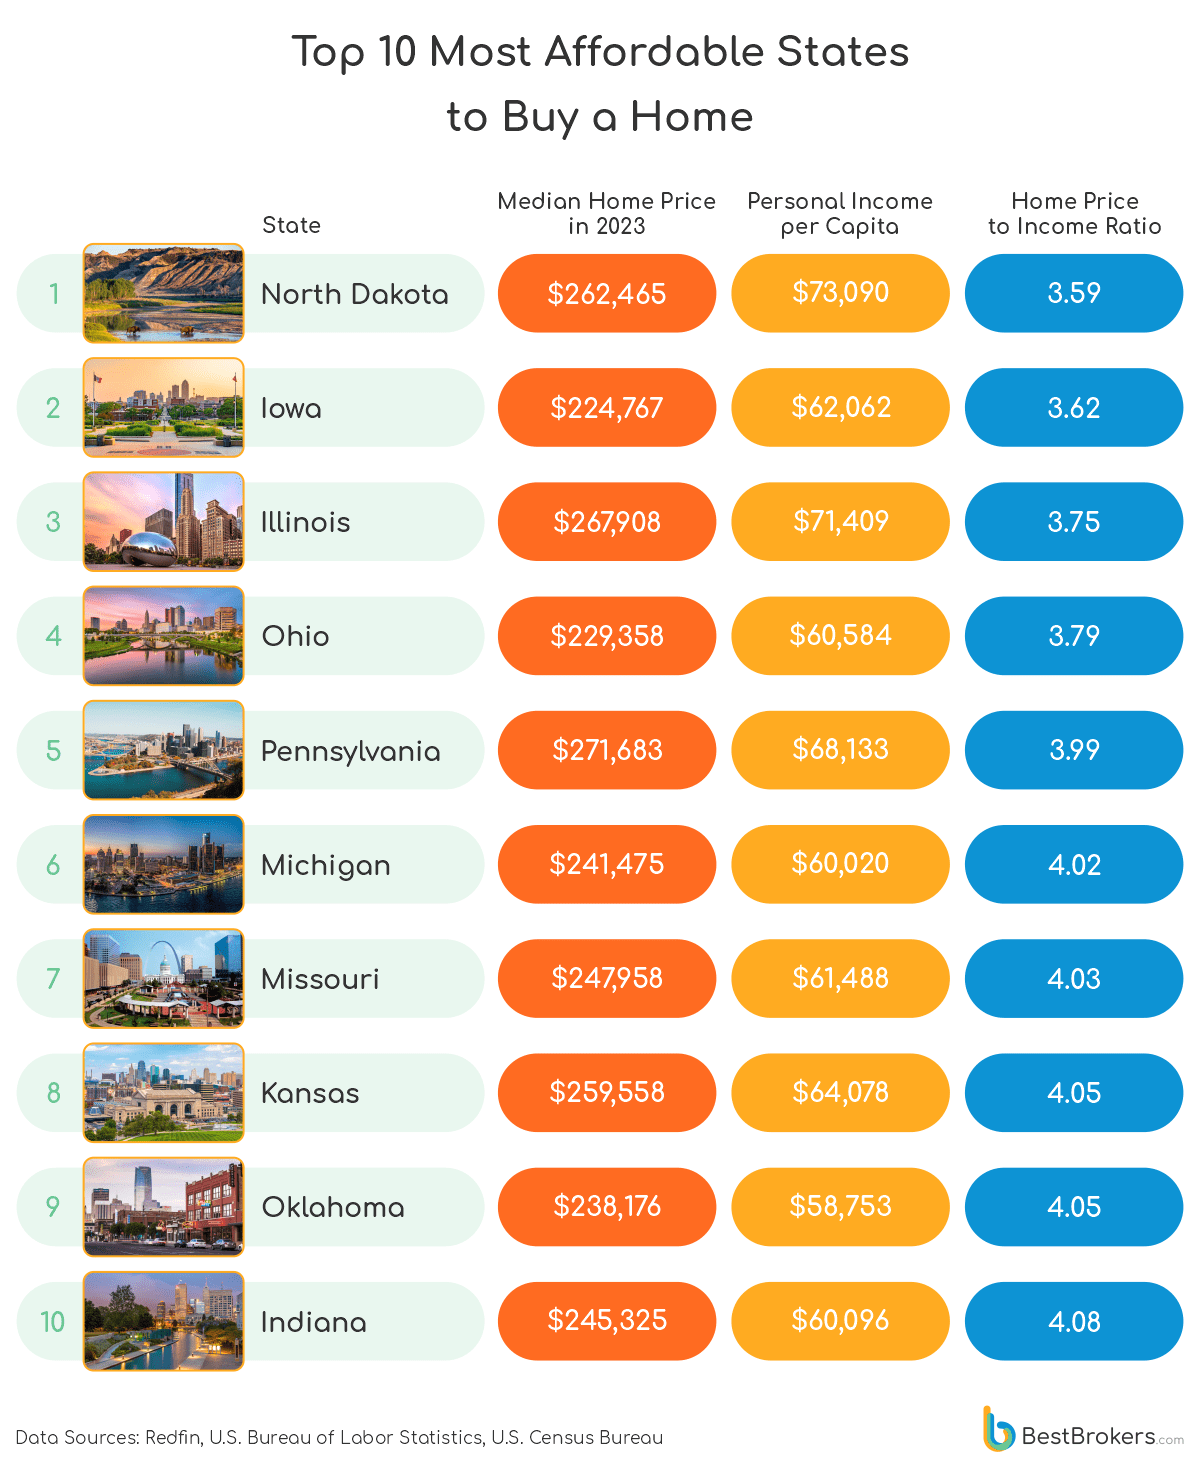
Homebuyers looking for a bargain might find success in the Great Plains. North Dakota leads the way as the most affordable U.S. state, boasting the lowest price-to-income ratio on the list (3.59). With a median home value of $262,465, well below the national median, and an income per capita averaging $73,090 (the highest among the top 10 most affordable list), North Dakota’s housing market should be able to offer individuals the opportunity to invest in properties without straining their finances.
Iowa stands out with the second most affordable housing options, showcasing a median home price of $224,767, the lowest nationwide, alongside a per capita income averaging $62,062 (ratio of 3.62). Put simply, residents would need to save their salaries for 3 years and 7 months to cover the cost of a home. The state’s affordability likely stems from its rural nature, relatively slow-growing population and surplus of available land, leading to less demand and lower prices. But despite the relative accessibility, home prices in Iowa, as might be expected, vary depending on the location. For instance, housing in Des Moines and Cedar Rapids tends to be more expensive than in rural areas.
Illinois secures the third position in affordability for homebuyers, boasting a median home value of $267,908 against an income per capita of $71,409. That makes the expense of buying a home 3.75 times the amount of one’s annual income. This affordability perhaps owes much to the Land of Lincoln’s abundant housing supply, which, driven by a relatively high residential development rate, keeps housing rates in check. Of course, prices in the Chicago metro area can be significantly higher than in the rest of the state.
Ohio follows closely in the ranking, boasting the second-lowest median home price nationwide— $229,358, which is 3.79 times the per capita income of $60,584. This is in all likelihood due to the Midwest state’s low population density, which leads to a larger number of housing units available and keeps the prices relatively low. The stable economy, ensuring plentiful job opportunities, the relatively affordable cost of living, and the well-developed infrastructure make the Buckeye State even more attractive. Housing in Pennsylvania also remains comparatively accessible for many residents as the median cost of homes ($271,683) is roughly just 4 times the per capita income of $68,133. However, it’s worth noting that transportation and healthcare costs are, reportedly, higher than in other areas and you may pay more taxes than you expect.
With a median value summing up to $241,475 as of 2023, Michigan’s real estate market appears affordable, too. One needs to set aside just over four years’ worth of earnings ($60,020) to afford a house. According to the housing market data we looked at, Detroit was the least expensive metro area for homebuyers last year. The real estate market in Missouri is rather appealing to homebuyers, as well, featuring a median price of $247,958, which is 4.03 times the per capita income of $61,488. It also boasts the highest home sales per 1000 people within the 10 top-rated most affordable states list— 12.32 per 1000 residents. Kansas and Oklahoma solidify their positions in the top 10 with a home price-to-income ratio of 4.05, offering a balanced mix of affordability and appeal to potential homeowners. The former takes the higher position by providing a better per capita income ($64,078/year), even though its median housing costs are also more expensive ($259,558).
Last but not least, with a median home price of $245,325 – only 4.08 times the income per capita, amounting to $60,096 – Indiana presents reasonable affordability alongside a modest tax burden. Transportation and grocery costs are also below the national averages. Of course, there are tradeoffs— fewer major cities, employment opportunities, and entertainment options compared to neighboring states.
States with the Worst Home Price-to-Income Ratio
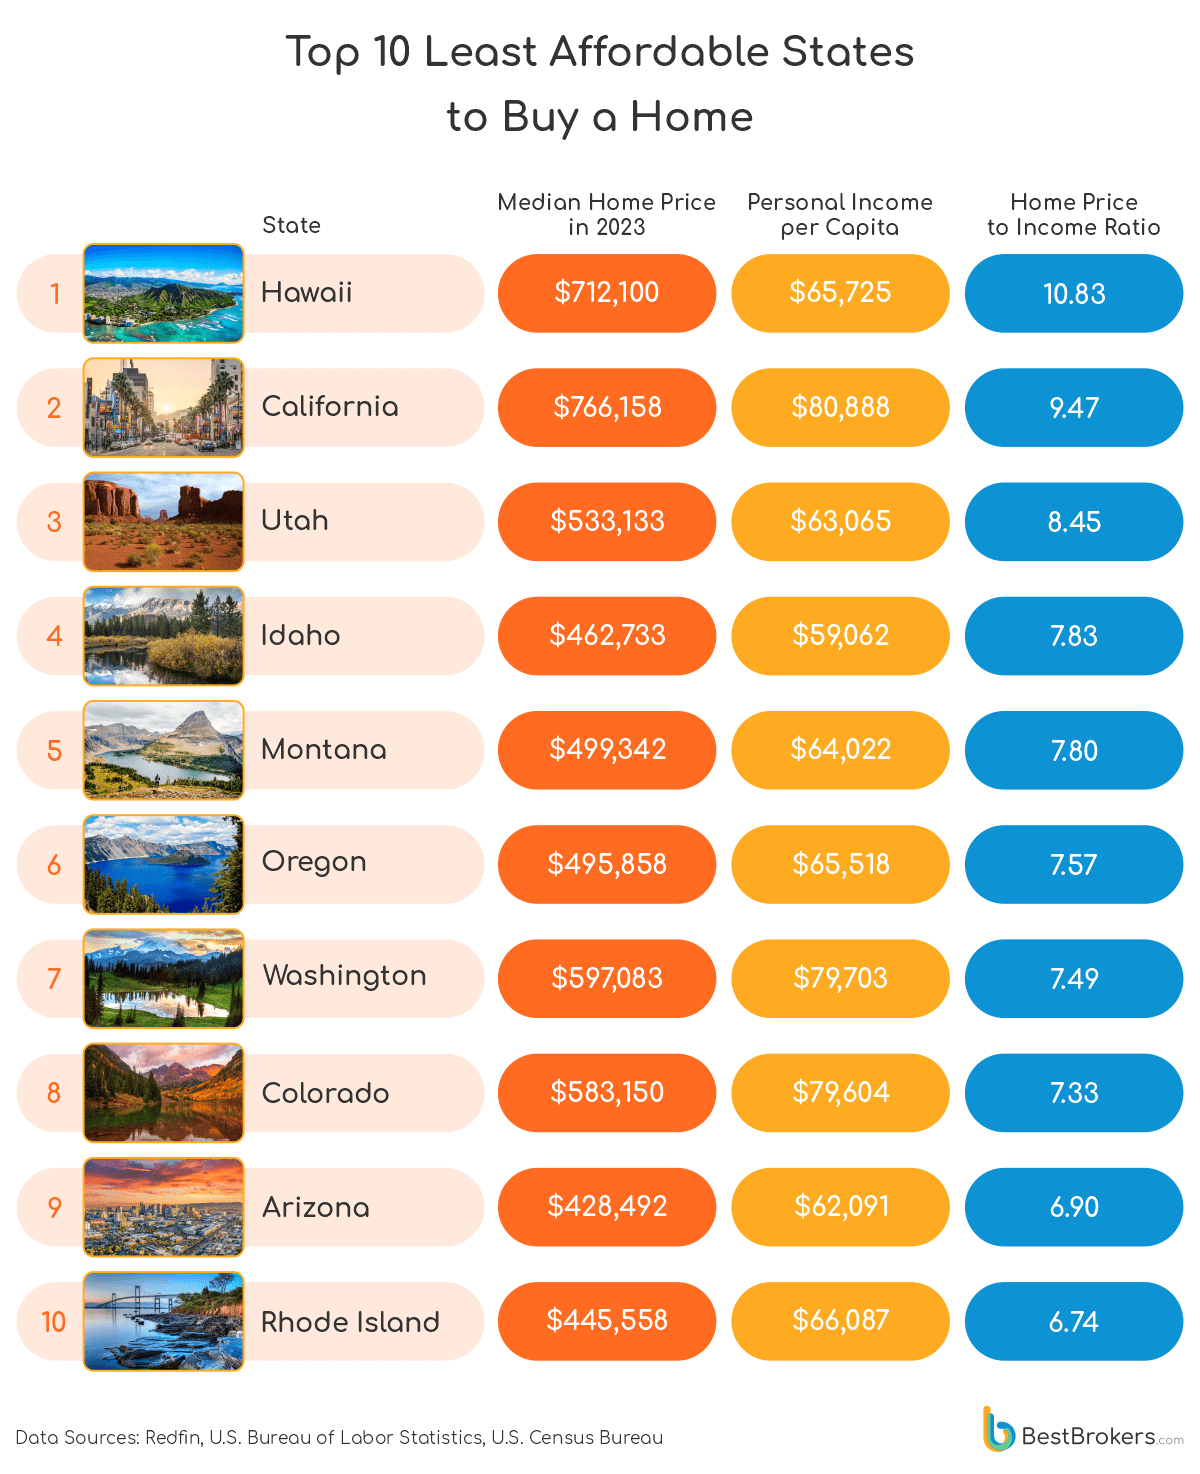
Residents of Hawaii enjoy one of the most breathtaking places on earth but at a high price. The state’s stringent housing regulations have led to a shortage of homes. And with low supply comes high demand— and even higher prices. With a median housing cost of $712,100, nearly double the national average, against an income per capita of $65,725, the Aloha State ranks as the least affordable for homebuyers. If you are on the average salary, it would take you more than ten years to save for a home and it might cost you even more to live there, as prices in Hawaii tend to be double those on the mainland.
With median prices soaring to $766,158, residents of the Golden State face the priciest housing costs in the country. Despite boasting the highest per capita income in the top 10 least affordable list ($80,888/year), those living in California barely make 10.56% of their housing cost per year, resulting in the second-highest price-to-income ratio on the list (9.47). The top six most expensive metro areas were, reportedly, all in California with San Franciso leading the list. While many factors contribute to this affordability crisis, including the impact of the travel industry and the high property taxes, one of the primary issues lies in the strict zoning laws. The construction of new houses in California is restricted, which results in an imbalance between demand and supply and, in turn, leads to soaring home prices.
Utah secures a spot near the top of the country’s most expensive real estate markets, ranking third-highest in terms of home price-to-income ratio, trailing only Hawaii and California. A person’s median annual income ($63,065) only accounts for 11.83% of the expense of buying a home in the Beehive State ($533,133). Idaho also presents affordability issues as home prices have been steadily rising since the beginning of the COVID-19 pandemic and have gone from buyer-friendly to above the national average, especially in the Boise metro area. A typical house ($462,733) would require 7.83 times the annual income of a person ($59,062). Despite the Gem state’s affordability crisis, however, it leads the top 10 least affordable list in terms of the highest number of home sales per 1000 people, with a figure standing at 12.97.
In Montana, housing also rises faster than incomes, placing strain on personal budgets. Affording a typical home in the state now costs 7.80 times the per capita income of $64,022. Next is Oregon, which apart from struggling with a terrible housing shortage, also grapples with limited availability of vacant lots for development, resulting in skyrocketing prices and below-average incomes. A person’s median annual salary only covers 13.21% of the expense of buying a home. Additionally, the state has some of the highest property taxes in the country, further adding to the expense of owning a home.
Washington State also puts properties out of the reach of many. Even though salaries ($79,703/year) exceed the national average, median home prices also soar above it ($597,083), resulting in a discrepancy between price and income (ratio of 7.49). The heavy influence of Seattle, one of the nation’s priciest housing markets, undoubtedly contributes to the elevated costs as well. Similarly, residents in Colorado enjoy per capita incomes above the national average ($79,604/year). However, median home prices are significantly inflated ($583,150), placing the state among the worst in terms of the price-to-income ratio (7.33). Moreover, Colorado’s real estate taxes and mortgage rates rank among the highest in the country. Its popularity as a ski destination further drives costs up, even in smaller towns.
Opting to buy a home in Arizona, particularly in the Phoenix area, may not be the most cost-effective choice either, given that the median home value in the state ($428,492) is 6.90 times the income per capita of $62,091. Rhode Island concludes the country’s most expensive real estate market list with an individual’s annual salary ($66,087) accounting for only 14.83% of the Ocean State’s median home price ($445,558).
The bottom line
While the existing home prices are indeed out of reach for many Americans, note that we provided only median figures. That means half of the properties in every state cost more, and half cost less. If, for example, a $700k house in Malibu or Los Angeles seems unaffordable, remember that many homes in California cost less than that. It’s essential to explore various cities, suburbs, towns, and rural areas to find options that fit your budget since, as we saw, housing affordability varies. Another thing to bear in mind is seasonality as it impacts property prices as well— they typically peak in June and decline towards winter.
Methodology
For this report, the team at BestBrokers analyzed U.S. housing market data for 2023, provided by Redfin, one of the largest national real estate brokerages in the country. The dataset offers insights into the median sales prices of various property types in every state on a monthly basis. We calculated each state’s median price for all residential properties throughout the year and included that number in our analysis.
Additionally, we used data from the U.S. Bureau of Economic Analysis, providing personal income figures for the third quarter of 2023 for every state. These figures are shown in millions of dollars, seasonally adjusted at annual rates, and encompass the entire state’s income. To get the actual income per capita, we divided the income of each state by its population.
Finally, we determined the price-to-income ratio for each state by dividing its median home prices for the entire 2023 by the per capita personal income and ranked the states accordingly. We also calculated the income as a percentage of the median home price. As for the homes sold per 1,000 people figure, we divided the total number of properties sold in 2023 in every state by its population and then multiplied by 1000.
Full Data