


 Richard Perry is a Financial Research and Platform Testing Analyst at BestBrokers.com, specialising in technical analysis, market strategy and the evaluation of trading platforms across forex, stock, cryptocurrency, CFD, gold and Bitcoin markets.
Price action refers to analyzing the performance of a particular trading instrument (a currency pair, commodity, stock, cryptocurrency, etc.) in order to predict its future price movement by identifying certain patterns (signals) in the market. Price action traders employ a variety of methods to predict market movement and profit in the short-term.
Some traders use “naked” or “pure” price action, a technique that involves placing orders based on charts containing raw price data without relying on technical indicators or other market analysis tools. The approach enables traders to improve their market reading skills and prevents information overload.
When reading the segments (candlesticks or bars) of a price chart, traders look for easily recognizable price action signals (price action patterns) to predict future market fluctuations. Experienced traders can usually detect such signals at a glance by identifying particular candlestick formations or repetitions in past price performance.
Why is price action so popular in Forex trading? The difference between price action and technical analysis
Price action trading enjoys a particularly high popularity among forex traders, which can be attributed to the following reasons:
- First, the forex market delivers unmatched liquidity compared to other market segments, allowing traders to enter and exit their positions quickly and with ease;
- Second, the market is so mature that it is easier to detect recurring patterns and trends;
- Third, the market is always active, but rarely reaches significant peaks or troughs. This makes it suitable for beginners who are willing to experiment with smaller positions before increasing their trade size as they gain more experience.
If we are to compare price action with technical analysis, we should note that price action indicators are mere flickers of activity, which experienced traders can detect quickly on the price chart and use them to make informed decisions in real time.
While technical analysis requires detailed calculations across multiple trading timeframes to forecast future market movements, price action focuses only on the price movements of one trading instrument within a single timeframe examined by the trader. Price action traders typically abstain from using additional technical indicators to read the market.
In this guide, we shall discuss the different trend reversal and trend continuation patterns, based on one, two, or more segments of the price chart (candlesticks), which traders can use when analyzing the global markets.
First, we shall begin with the single candlestick formations.
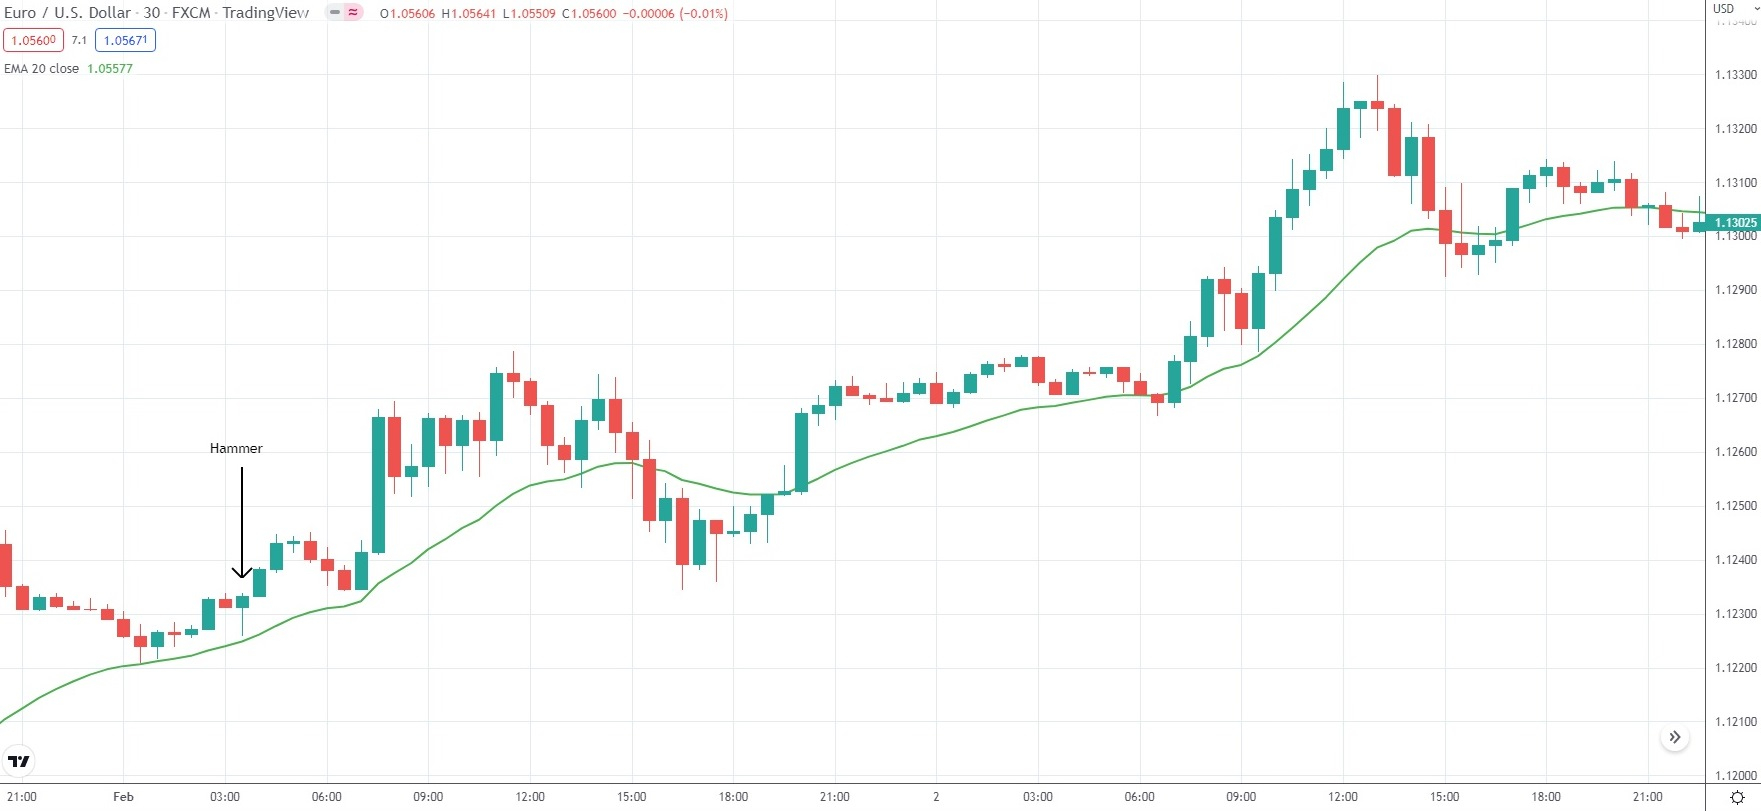
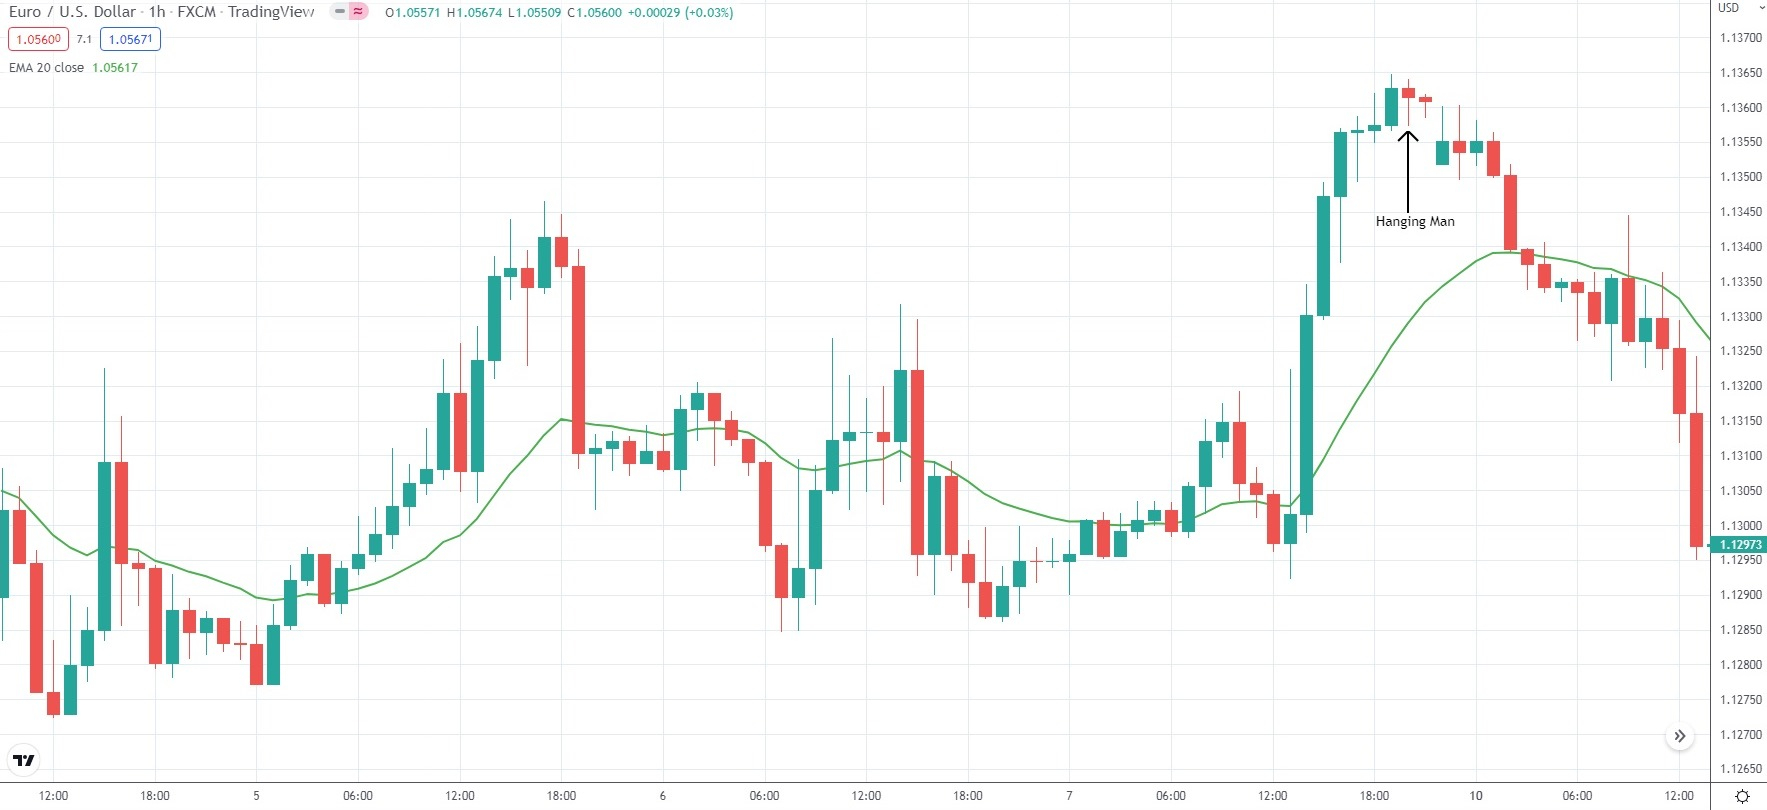
“Hammer” and “Hanging Man” Candlestick Patterns
Although these candlestick formations may appear similar on the chart, they play a different role. Both of them have long lower wicks, small bodies, and short (or no) upper wicks.
The “Hammer” is a bullish reversal pattern and usually appears after the market has been in a bear trend. It may be spotted at support levels and indicates that price action has reached a trough and may reverse direction. This pattern represents an opportunity to go long, but traders should still look for confirmation that prices will indeed move to the upside. This may come in the form of a green candle with a closing price above the open price or the high price of the candle that precedes the “Hammer”. This pattern has the following key features:
- Short or no upper wick
- Long lower wick, preferably two or three times longer than the body of the candle
- The body is at the upper end of the candle
- Green hammers are preferable over red ones as they represent stronger bullish sentiments.
The “Hanging Man” is a bearish reversal pattern and usually appears after the market has been in a bull trend. It may be spotted at strong resistance levels, indicating price action has peaked and may reverse direction. This pattern represents an opportunity to go short.
As with the “Hammer”, traders should beware of false signals and look for confirmation that the prices are indeed shifting down. This may come in the form of a red candle with a closing price below the open price or the low price of the candle that precedes the “Hanging Man”. This pattern has the following key features:
- Short or no upper wick
- Long lower wick, preferably two or three times longer than the body of the candle
- The body is at the upper end of the candle
- A red Hanging man is preferable as it has a greater potential to move upside compared to its green counterpart.
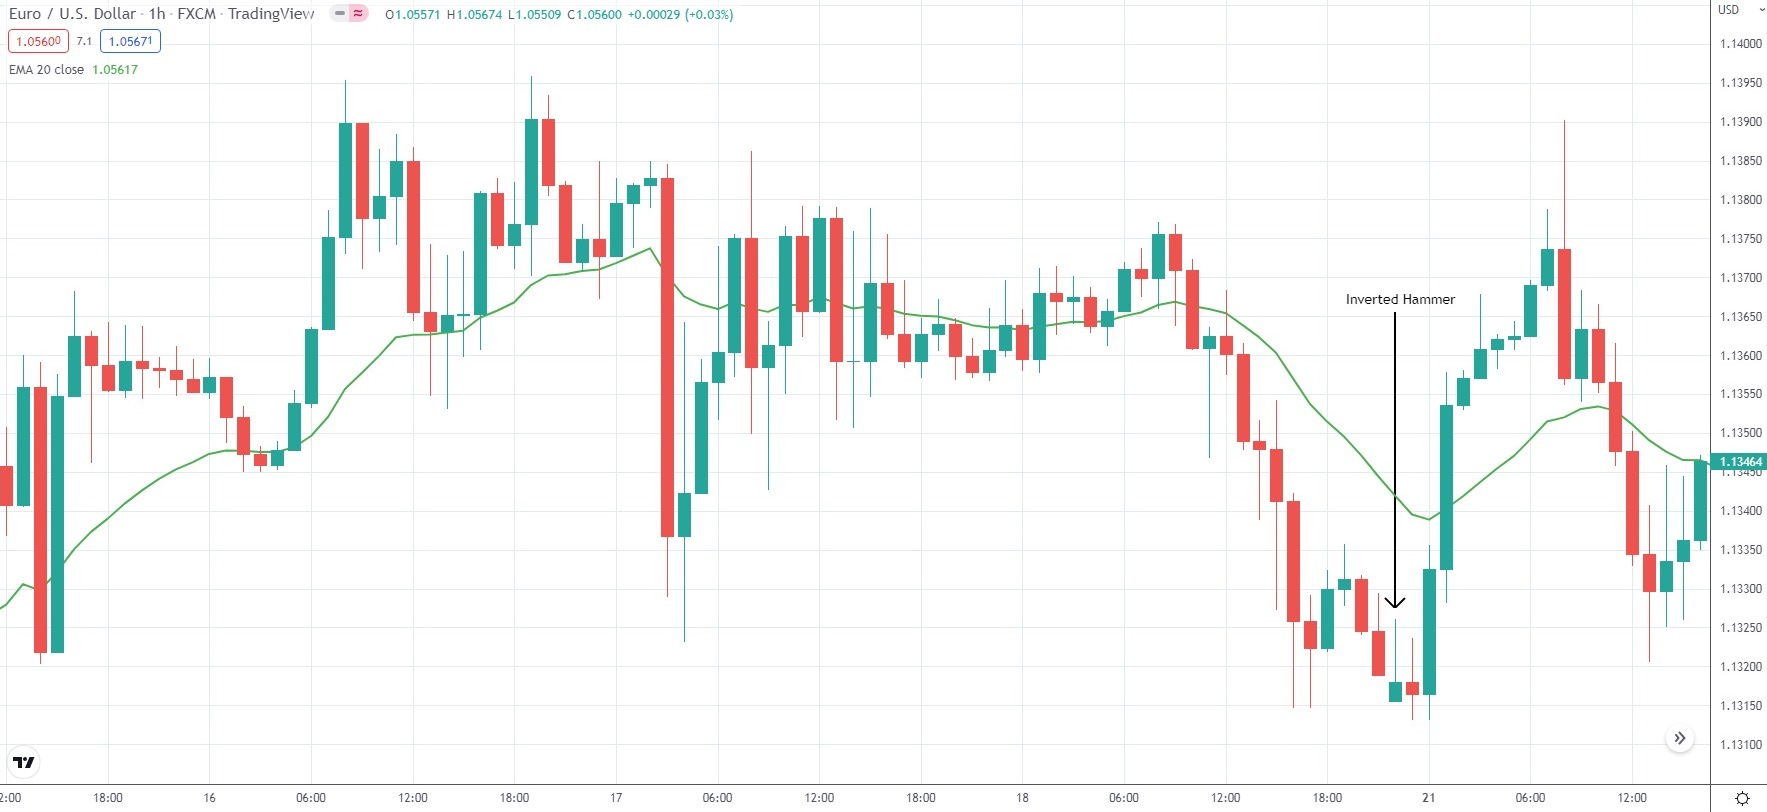
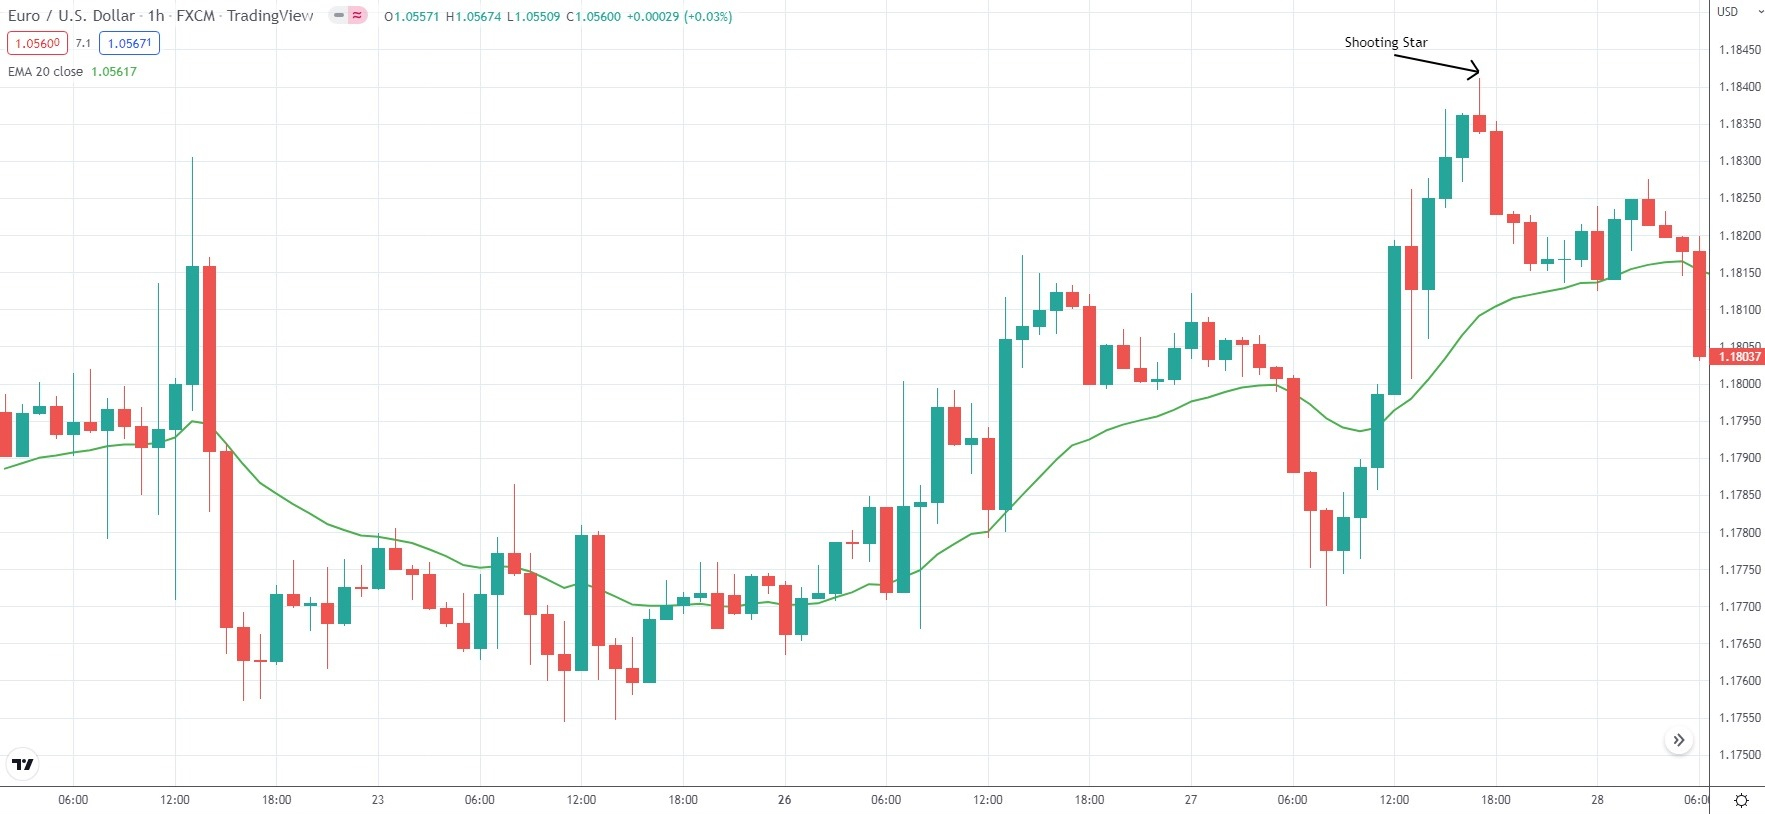
“Inverted Hammer” and “Shooting Star” Candlestick Patterns
Much like the previous two patterns we discussed, the “Inverted Hammer” and the “Shooting Star” may appear similar on the price chart, but are used in different contexts. Both have long upper wicks, small bodies, and short (or no) lower wicks.
The “Inverted Hammer” pattern usually appears after the market has been in a bear trend, signaling a bullish reversal. It may be spotted at support levels and suggests the price action has reached a trough and may reverse direction. It represents an opportunity to go long, but traders should still seek confirmation that the price action is indeed reversing to the upside. This may be a green candle with a closing price above the open price or the high price of the candle that precedes the “Inverted Hammer”.
The “Inverted Hammer” may sometimes appear in proximity to the regular “Hammer”, confirming support levels are quite strong.
The “Inverted Hammer” pattern will have the following key features:
- Short or no lower wick
- Long upper wick, preferably two or three times longer than the body of the candle
- The body is at the lower end of the candle
- Green Inverted Hammers are preferable as they suggest strong bullish sentiments.
The “Shooting Star” pattern usually appears after the market has gone through a bullish period, suggesting a reversal to bearish sentiments. It may be spotted at resistance levels and signals that prices are declining after a peak.
This pattern indicates an opportunity for going short, but traders should still wait for confirmation that bears are driving the prices downward. This confirmation usually comes in the form of a red candle with a closing price below the open price or the low price of the candle that precedes the “Shooting Star”.
The “Shooting Star” pattern will have the following key features:
- Short or no lower wick
- Long upper wick (preferably three times longer than the body of the candle)
- The body is at the lower end of the candle
- Red Shooting Stars are preferable because they are more bearish than green candles.
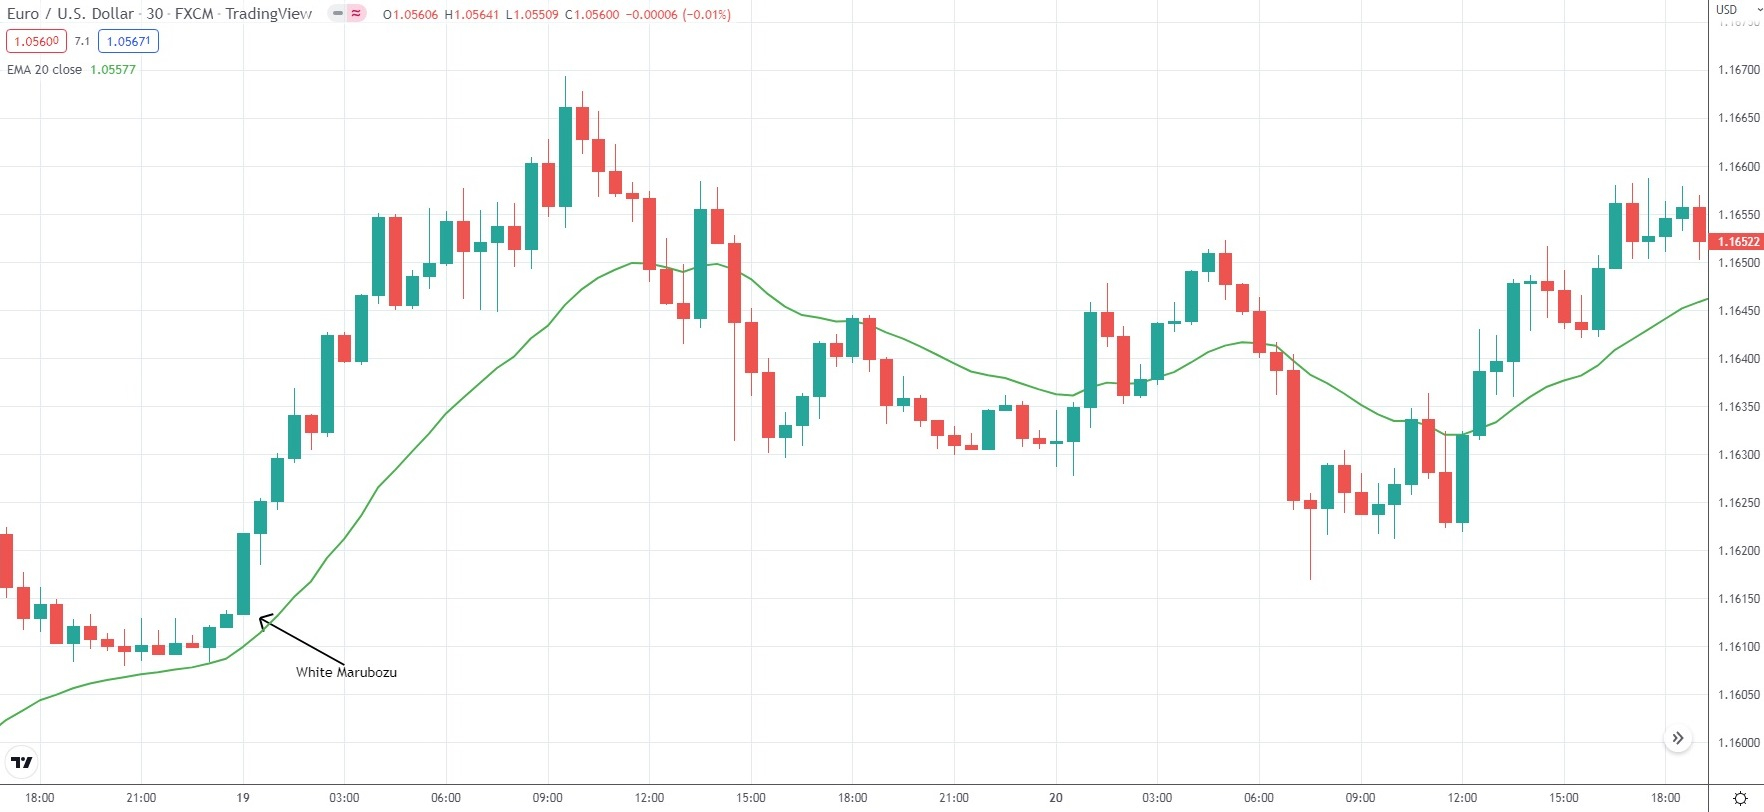
White Marubozu
This is a single candle pattern that appears after bearish periods, typically signaling a bullish reversal. The candle has a huge bullish body and no upper or lower wicks, which suggests the buyers are exerting pressure and the price may reverse to the upside. It is important to note that a White Marubozu appearing at the end of a downtrend is a stronger bullish reversal signal than if it appears within an established uptrend where it might signal continuation.
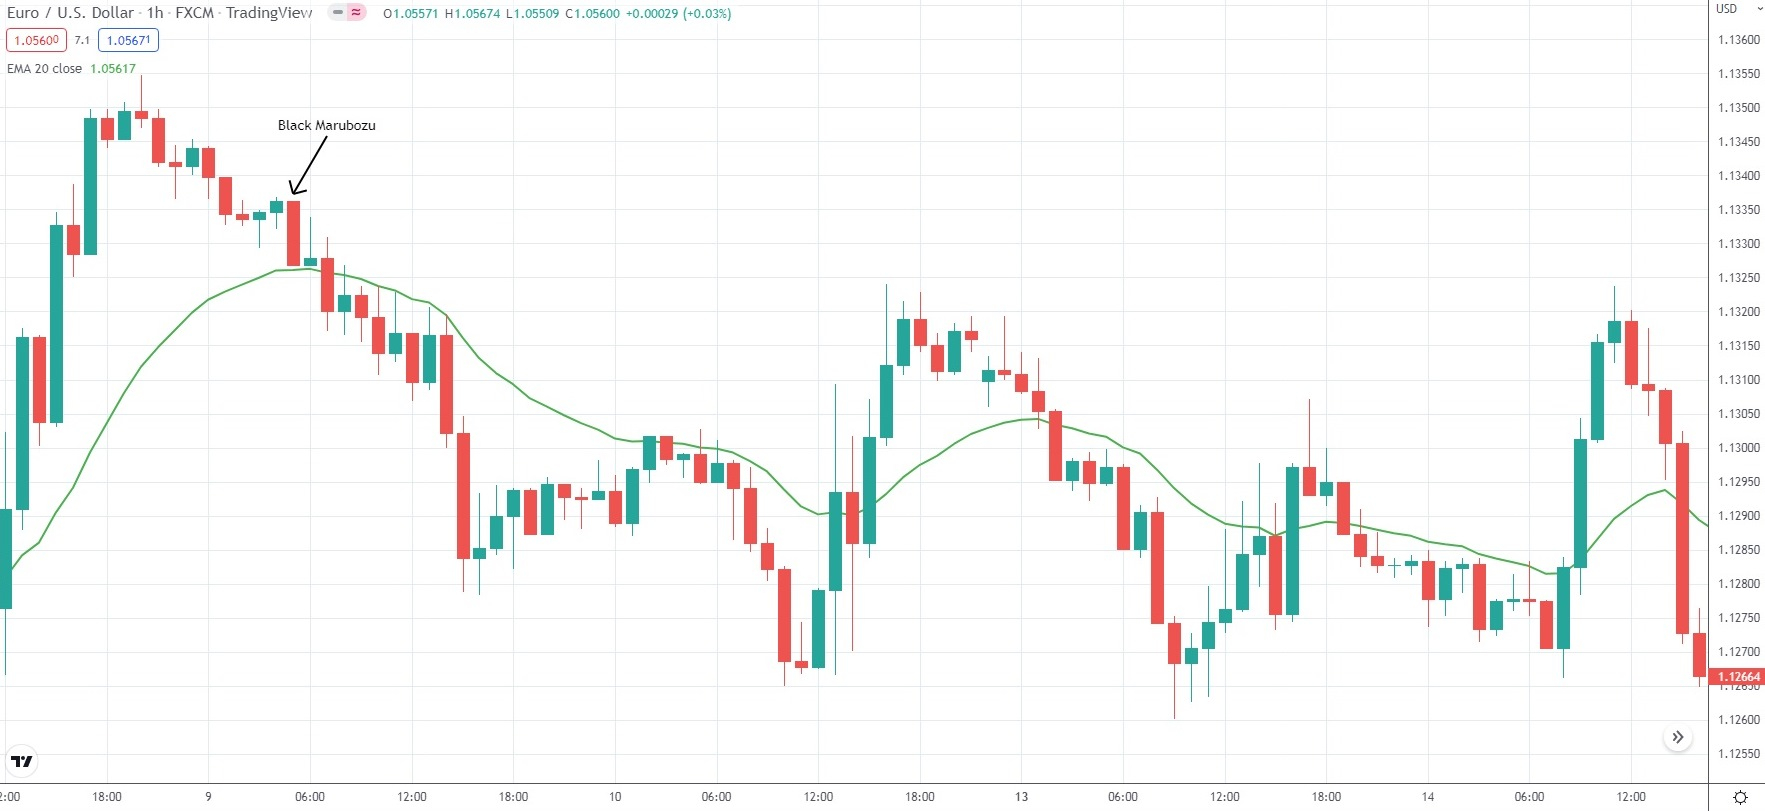
Black Marubozu
This is a single candle pattern that appears after a bull trend and signals a bearish reversal. The candle has a huge bearish body and no upper or lower wicks, which suggests the sellers are exerting pressure and the price may reverse down. A Black Marubozu at the end of an uptrend is a stronger bearish reversal signal.
Doji Candles
These candles appear on the price chart when the open and close prices of a particular trading instrument are virtually identical. As a result, the doji candle has a considerably smaller body compared to regular candles. Doji candles provide useful information since they enable traders to determine whether trends are losing momentum and identify potential reversals in price direction. This allows traders to enter and ride a market trend when it commences or exit the market before it ends. Setups based on Doji candles tend to offer reliable signals only within trending markets.
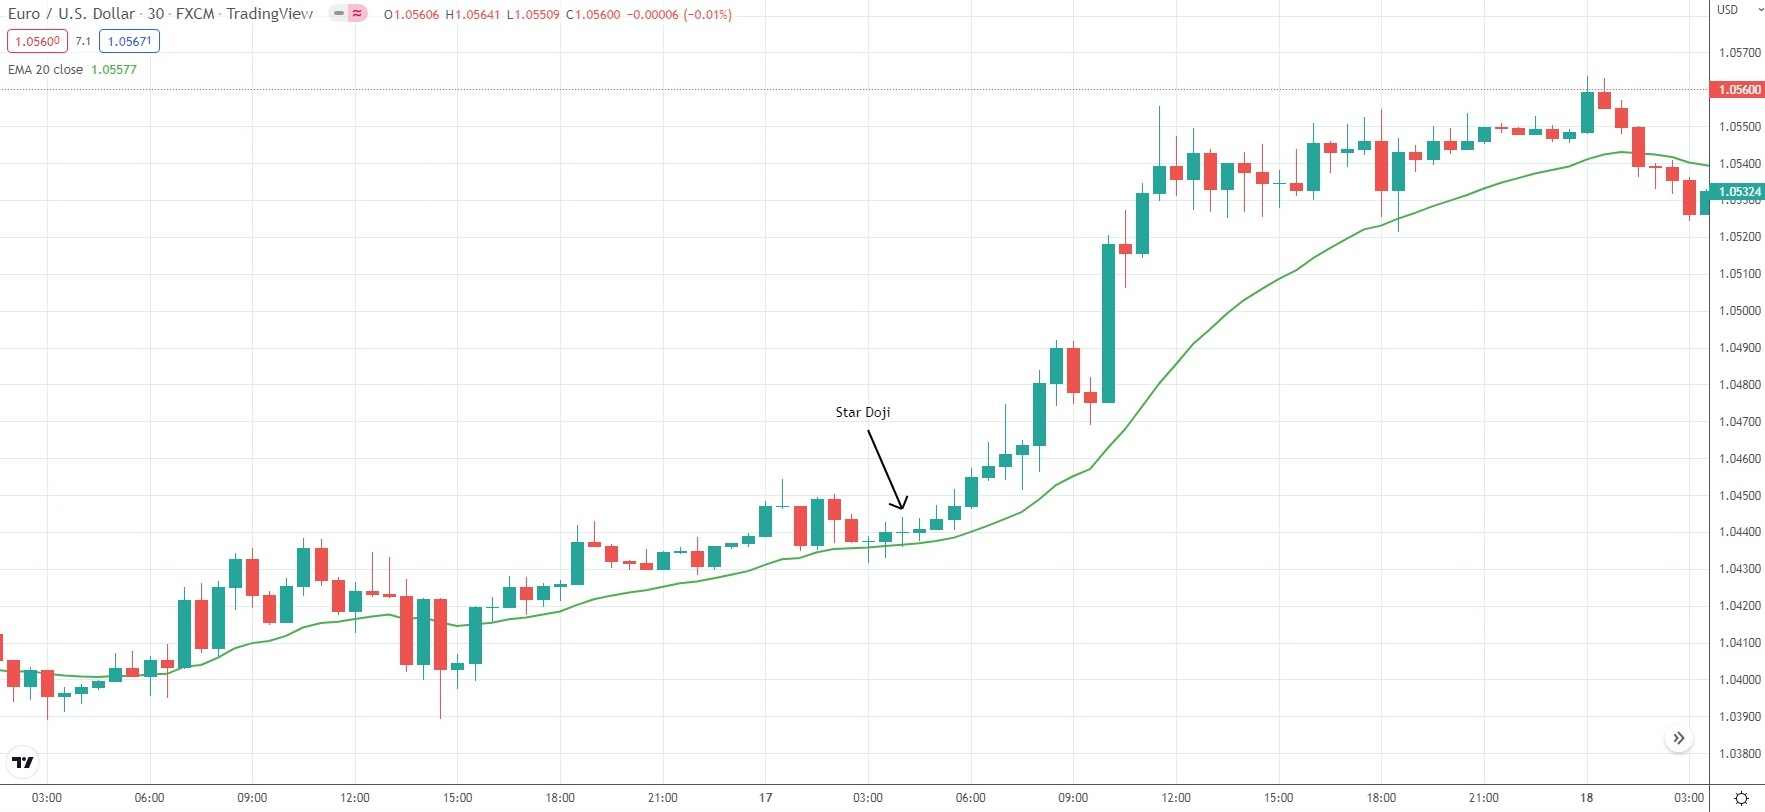
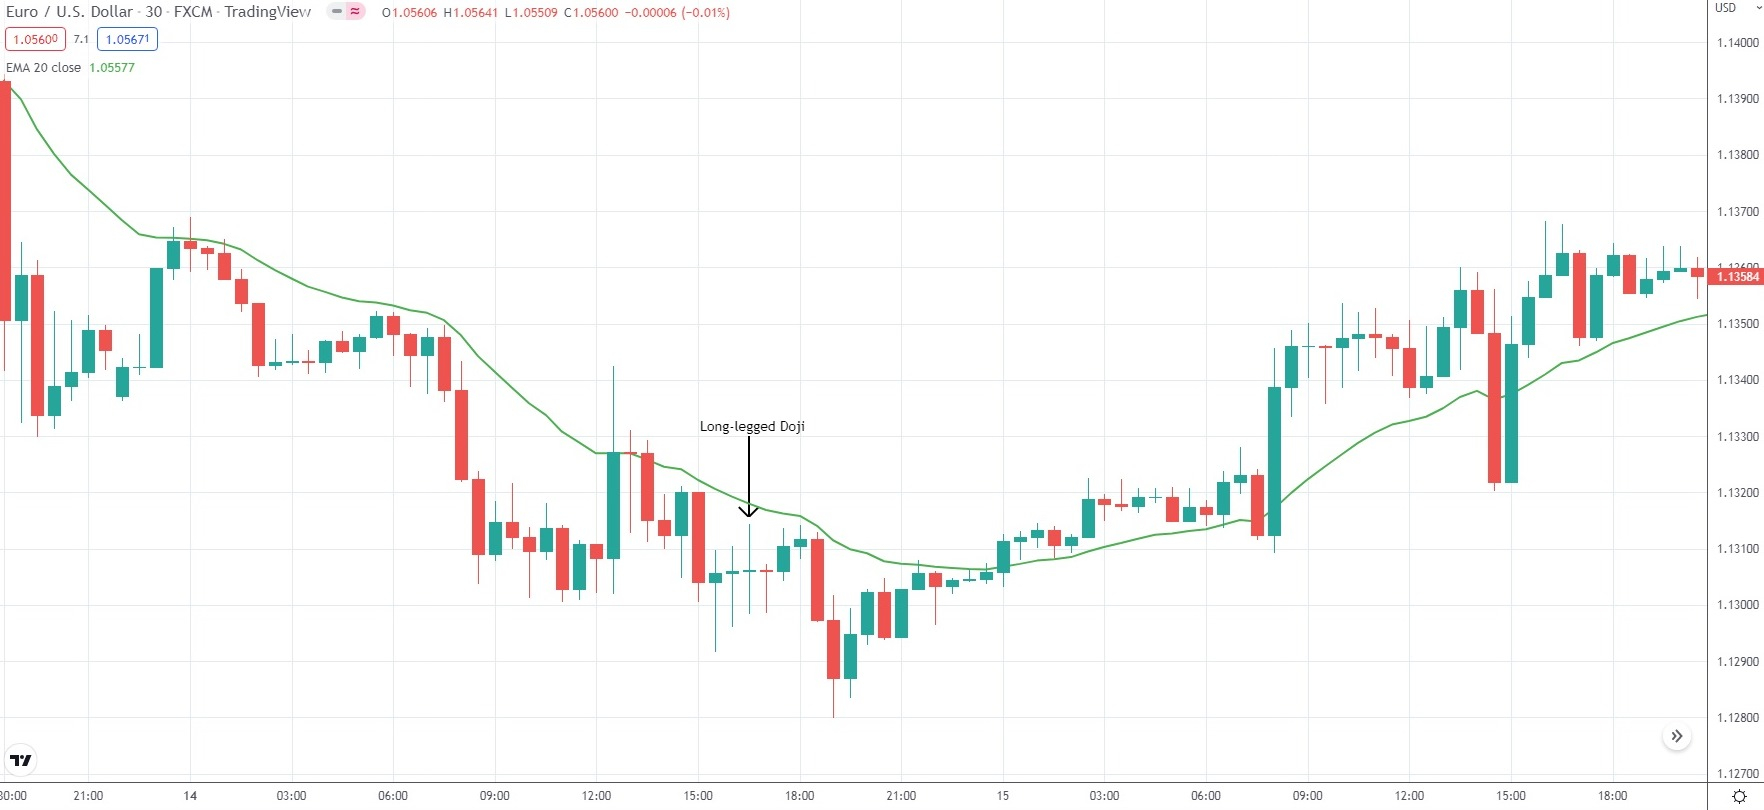
There are 4 different types of Doji candles – Star Doji, Long-legged Doji, Dragonfly Doji and Gravestone Doji.
The Star Doji candle has short upper and lower wicks that appear of nearly identical length. This Doji candle forms when the opening and closing prices are the same, while the price range is narrow. The Star Doji indicates indecision among market participants during the respective period.
The Long-legged Doji candle has longer upper and lower wicks, while the price range has been considerably wider. This Doji candle indicates that again, bulls and bears are battling for control, but now both sides are much more active.
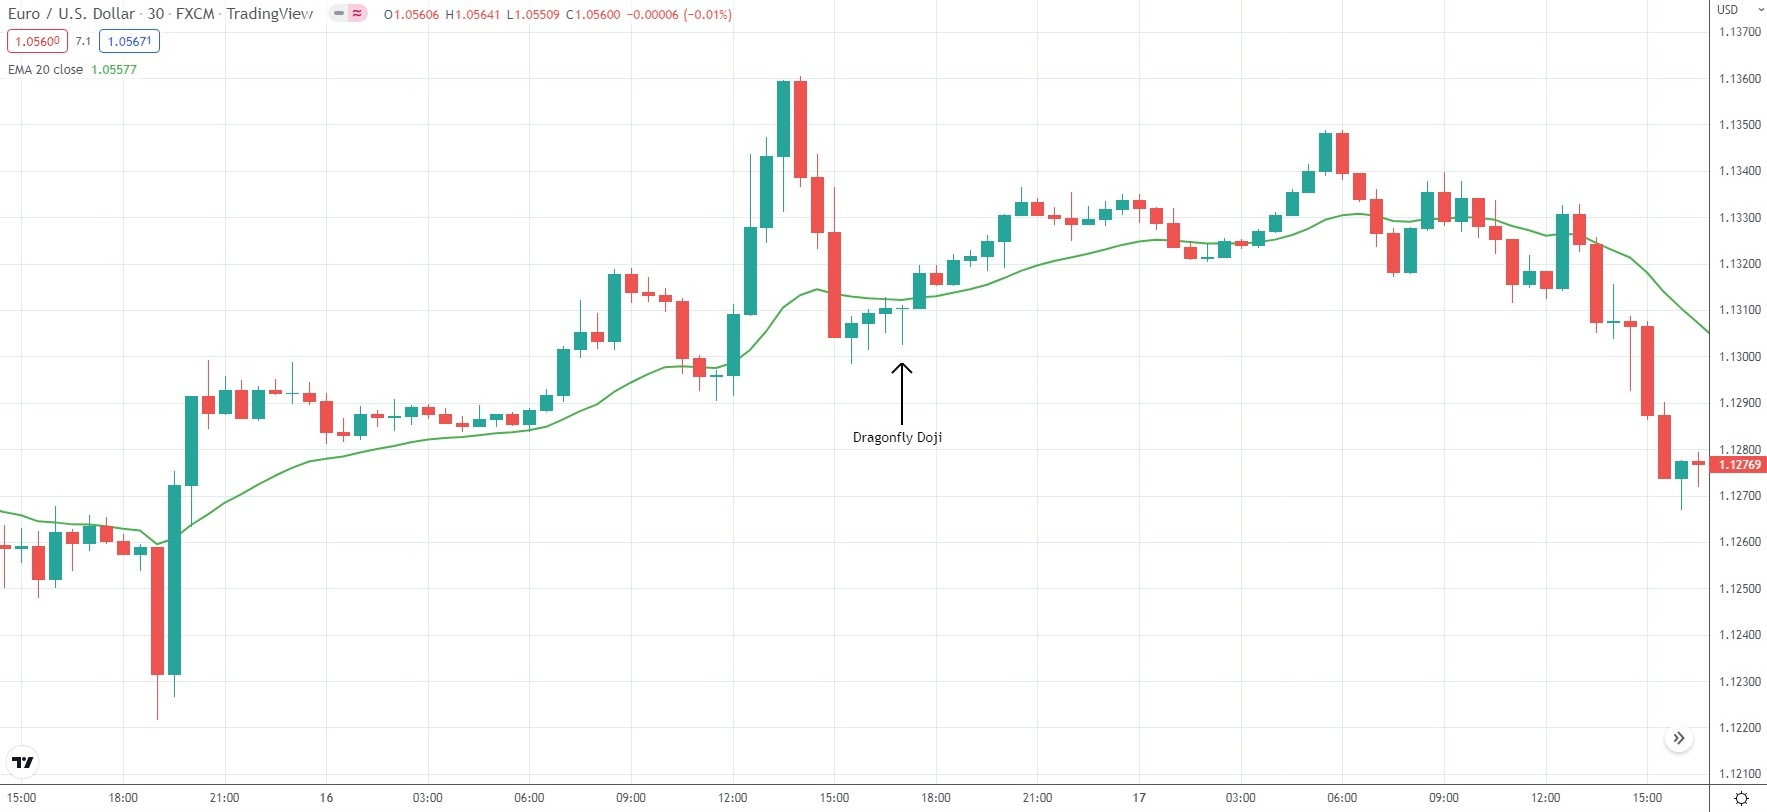
The Dragonfly Doji has a long lower wick, with a candlestick that opens and closes at the same price level, typically at the high end of the range. This Doji signals that bears have dragged the price in their favor before losing control due to a surge in long positions. The absent upper wick implies that bears stand firm and bulls do not cause sufficient pressure to trigger a breakout beyond that price level. The Dragonfly Doji usually generates a bullish signal.
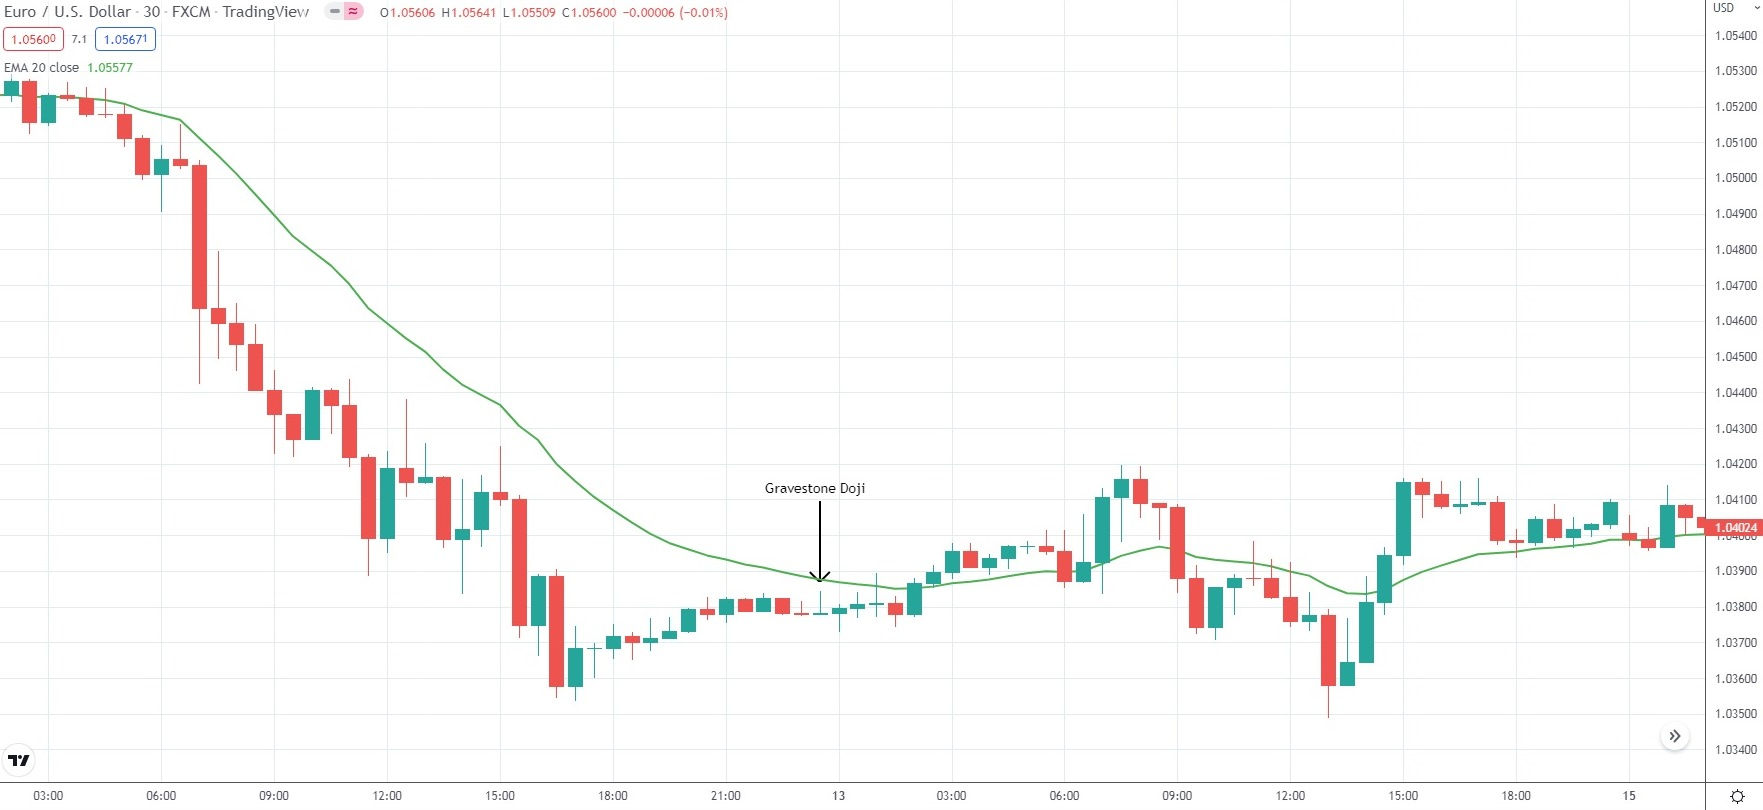
The Gravestone Doji has a long upper wick, and the candlestick opens and closes at the same price level, at the low end of the range. This Doji signals that bulls have dragged the price up until a surge in short positions occurred. The absent lower wick implies that bulls still support the price as bears do not cause sufficient pressure to trigger a breakout beyond that price level. The Gravestone Doji usually generates a bearish signal.
Short-term price patterns can also consist of two candlesticks. The most popular double-candlestick patterns include the Bullish and Bearish Engulfing, Dark Cloud Cover and Piercing Line, Tweezer Tops and Tweezer Bottoms, and Harami.
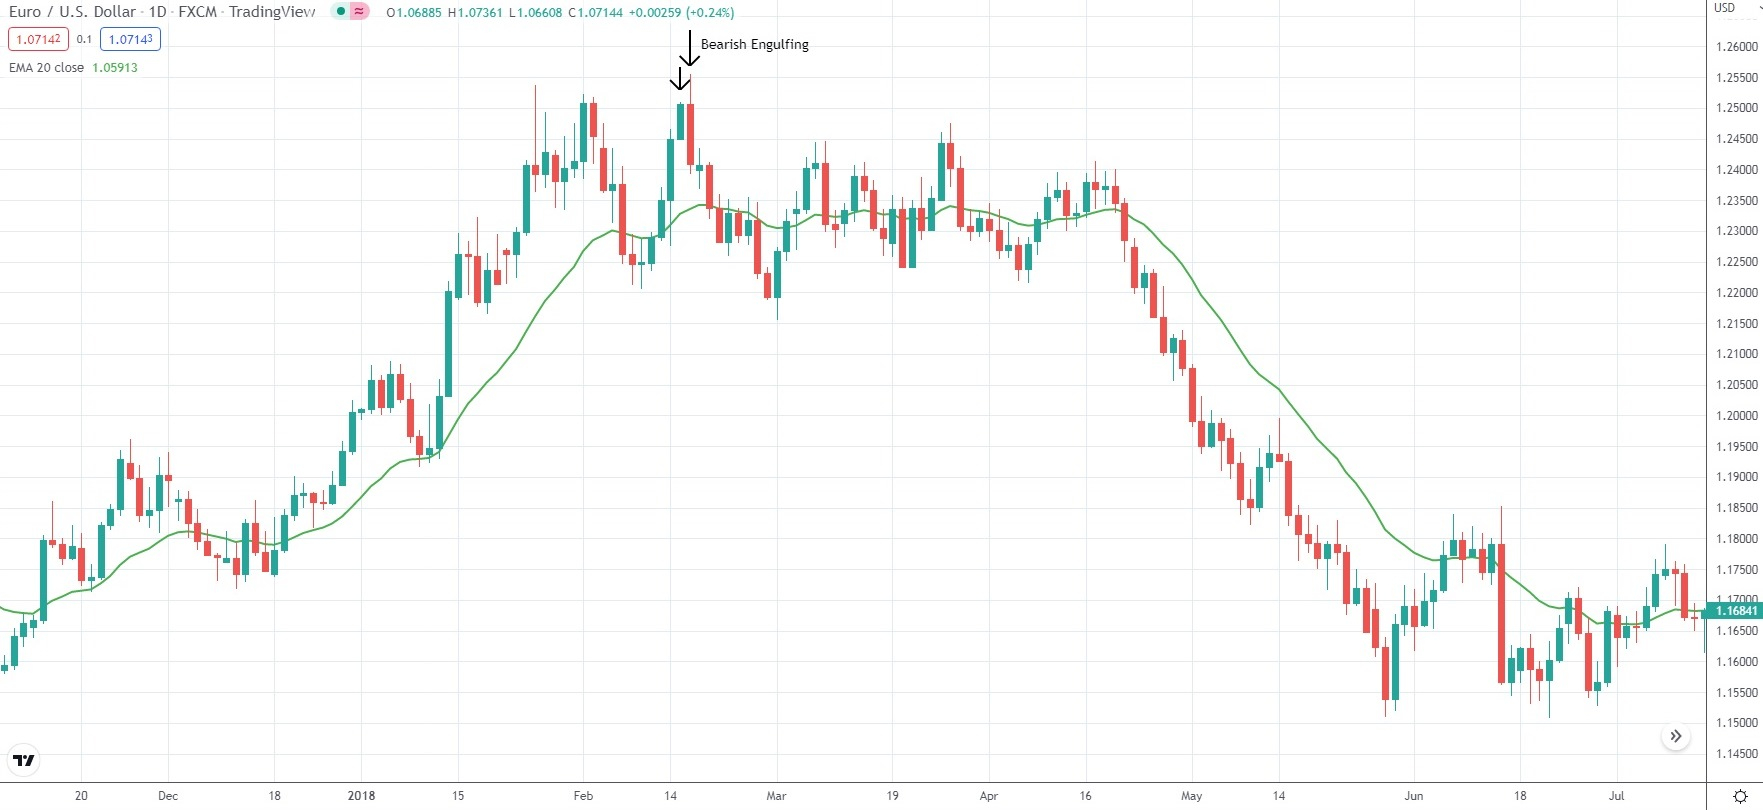
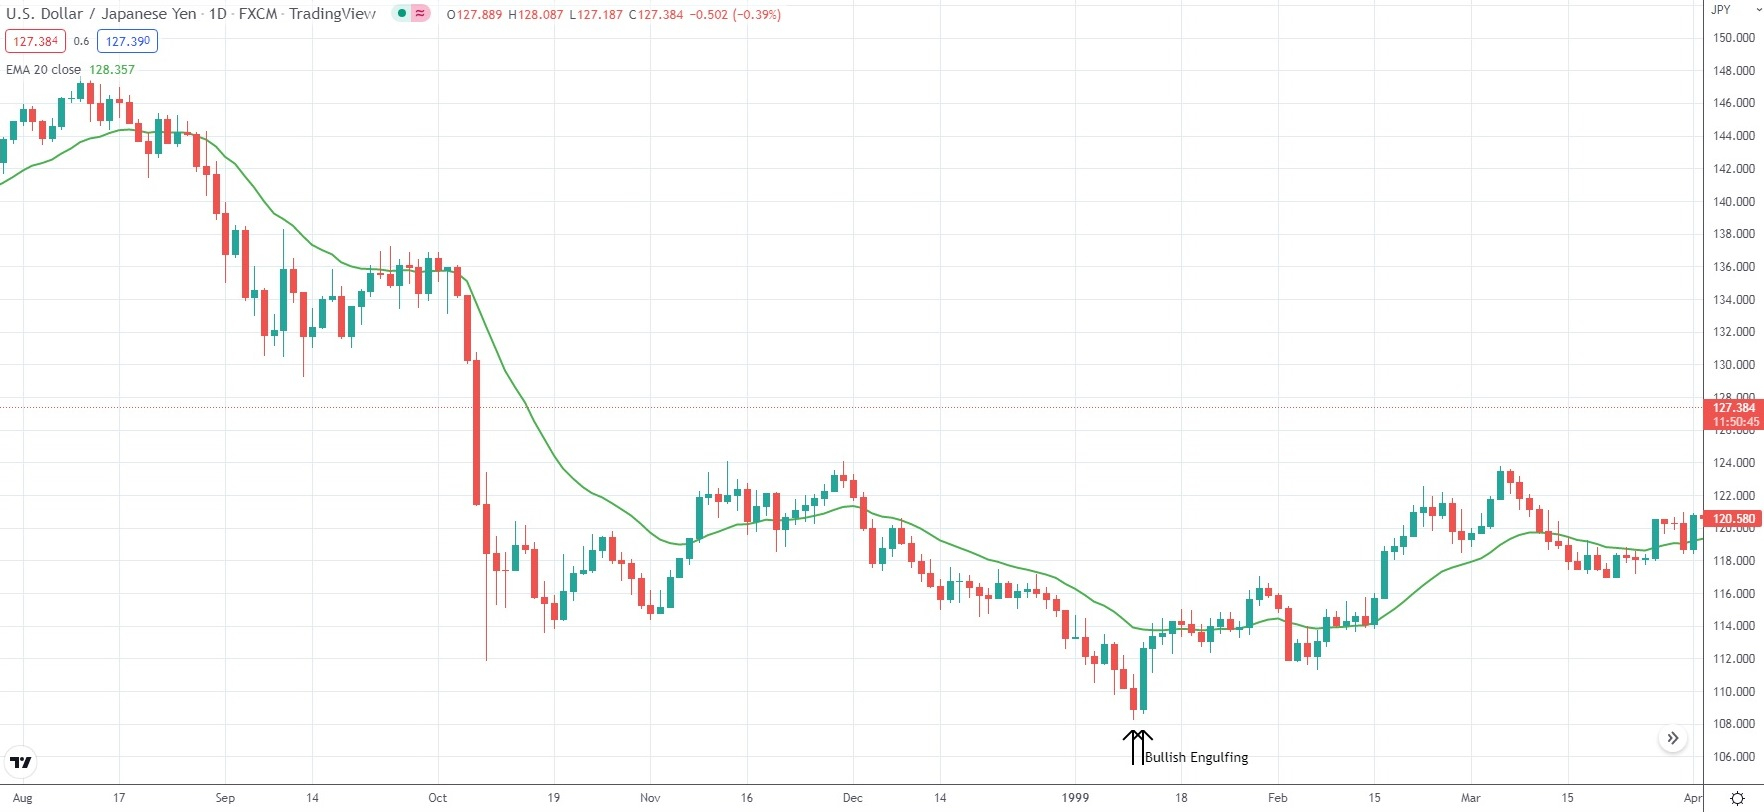
Bullish and Bearish Engulfing patterns
The Engulfing formation is a double candle setup that signals a trend reversal. This signal tends to be quite strong when we have favorable conditions for the pattern. Since the formation typically indicates trend reversals, the market must exhibit a recognizable trend for the Engulfing to work properly.
In a confirmed trend, a Bearish Engulfing formation will indicate the market has reached a peak, and a new bear trend may be about to begin. A Bullish Engulfing formation will indicate the market has reached a trough, and a new bull trend may be about to form.
There are several requirements to properly identify an Engulfing formation.
- First of all, the market should exhibit a confirmed short-term or long-term trend.
- Second, one of the candles should be bullish and the other bearish. When the first candlestick is bearish, the second should be bullish to complete a Bullish Engulfing formation.
- Third, the body of the first candle should be smaller than that of the second candle. The second candlestick does not need to additionally engulf the wick of the first candle. Yet, its high-low range should be equal to or wider than the high-low range of the first candle.
In an ideal Engulfing formation, the body of the second candle engulfs the entire first candle, including its wicks. If the formation appears after a Doji candle, the setup will be even more powerful.
It is generally accepted that the smaller the first candle and the larger the second candle is, the stronger the Engulfing formation will be. If the difference between the two candlesticks is not that significant, the pattern will be weaker. If both candles are of almost equal size, the formation becomes irrelevant and will likely lead to a sideways price movement.
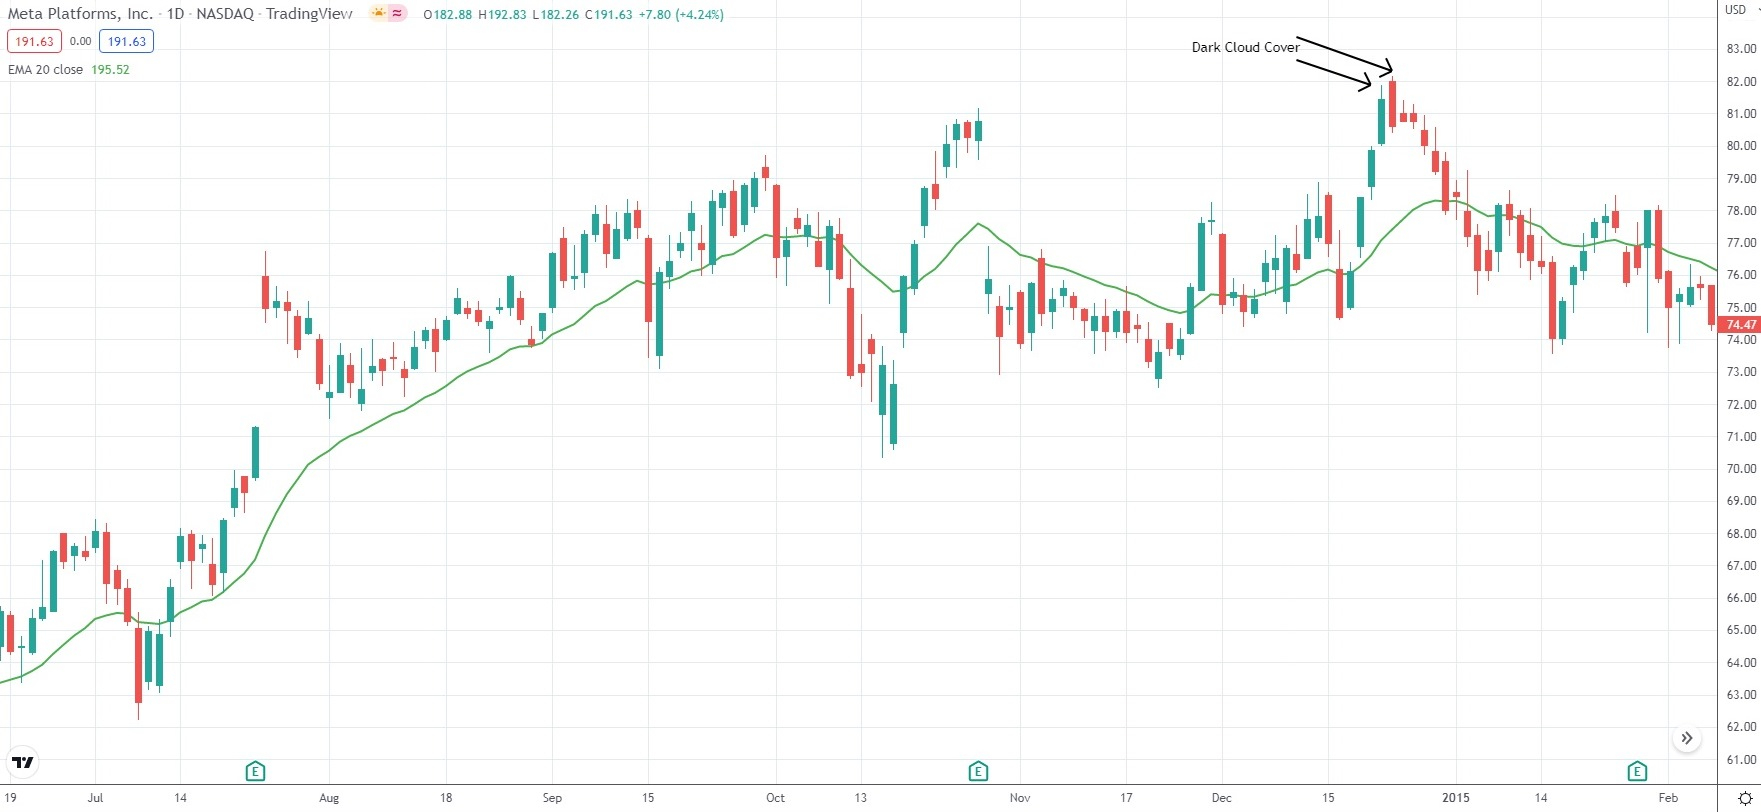
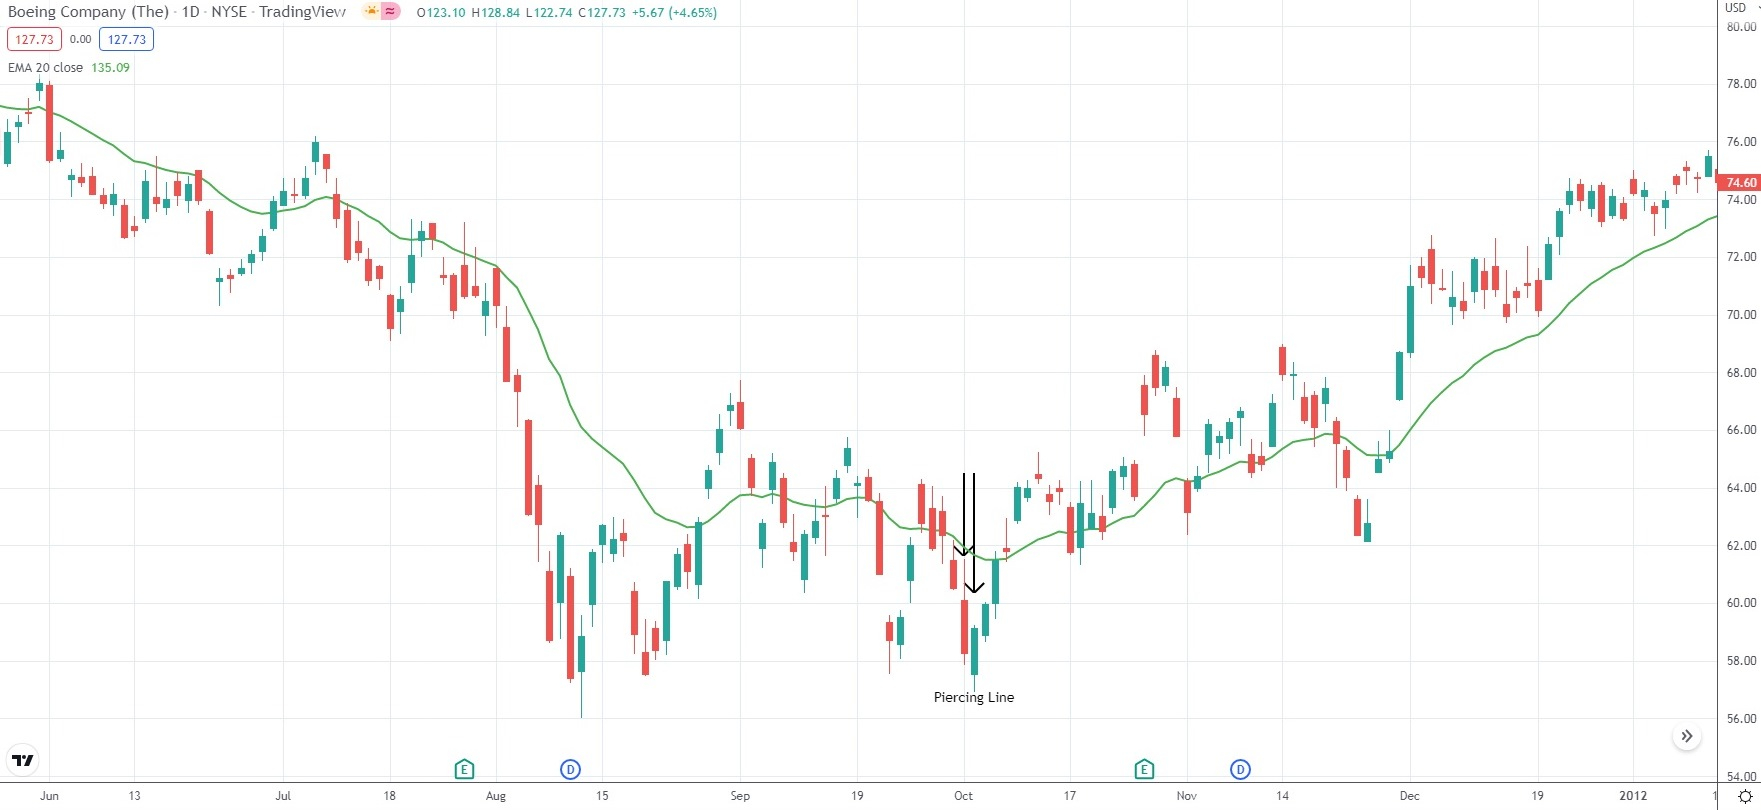
Dark Cloud Cover, Piercing Line
The “Dark Cloud Cover” and its opposite, the “Piercing Line”, represent double-candle trend reversal patterns. The “Dark Cloud Cover” forms at a market peak and signals a reversal to the downside. The first candle in the setup is large and bullish, while the second is smaller and bearish. The second candle must open above the upper wick of the first candle, usually forming an upward gap.
The price must decline further and close within the body of the first candlestick, ideally below its midpoint. The bigger the penetration is, the stronger the pattern.
An ideal Dark Cloud Cover formation assumes the second candlestick closes below the midpoint of the first candle’s body. We should note that liquid markets like forex may require more flexible setup conditions. For instance, the second (bearish) candlestick may open above the closing price of the first (bullish) candlestick instead of its high price, while the close may not be as deep. Yet, if the closing price of the second candle does not reach the midpoint of the first candle’s body, the formation may be inconclusive.
The “Piercing Line” pattern usually manifests after a strong bear trend, indicating the market has reached a support level or zone. The pattern signals that either a market correction or a new bull trend is about to occur. All requirements for the Dark Cloud Cover can be applied to the Piercing Line, but in reverse. These patterns can be observed on various timeframes,and their reliability might vary depending on the timeframe. Longer timeframes often carry more weight. Trading volume also bears consideration here, as higher volumes on the second candles add significant weight to the signal. A strong reversal pattern with low volume might be less reliable.
Tweezer Tops, Tweezer Bottoms
Tweezers also signal a trend reversal. Tweezer Tops are a bearish formation since they indicate that an existing bull trend is about to end. Conversely, Tweezer Bottoms signal a bullish reversal since they suggest that an existing bear trend is ending.
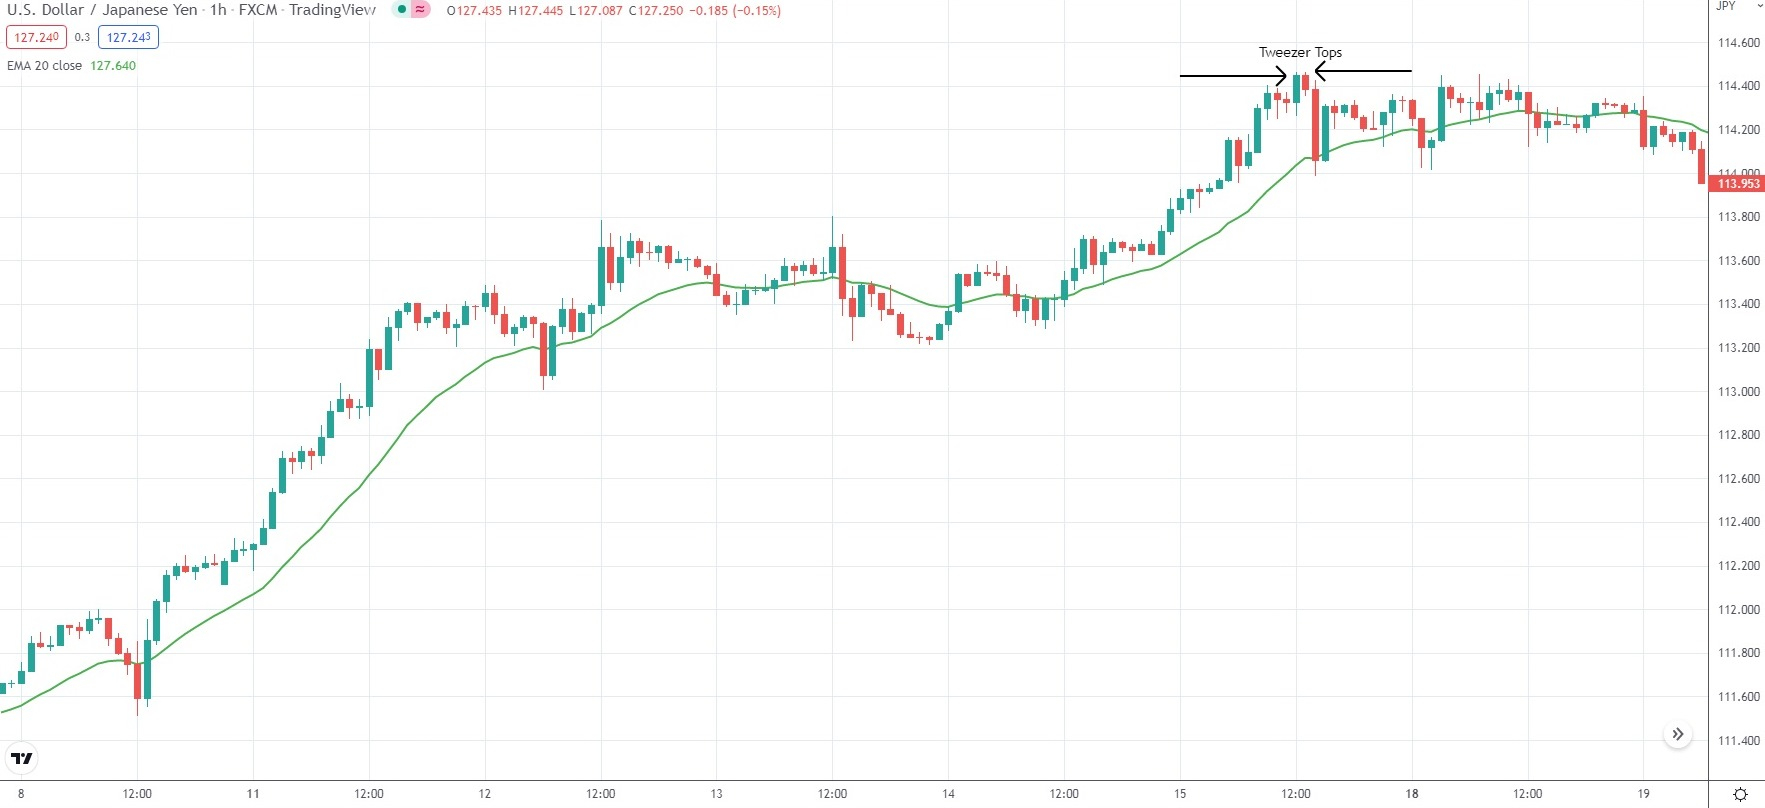
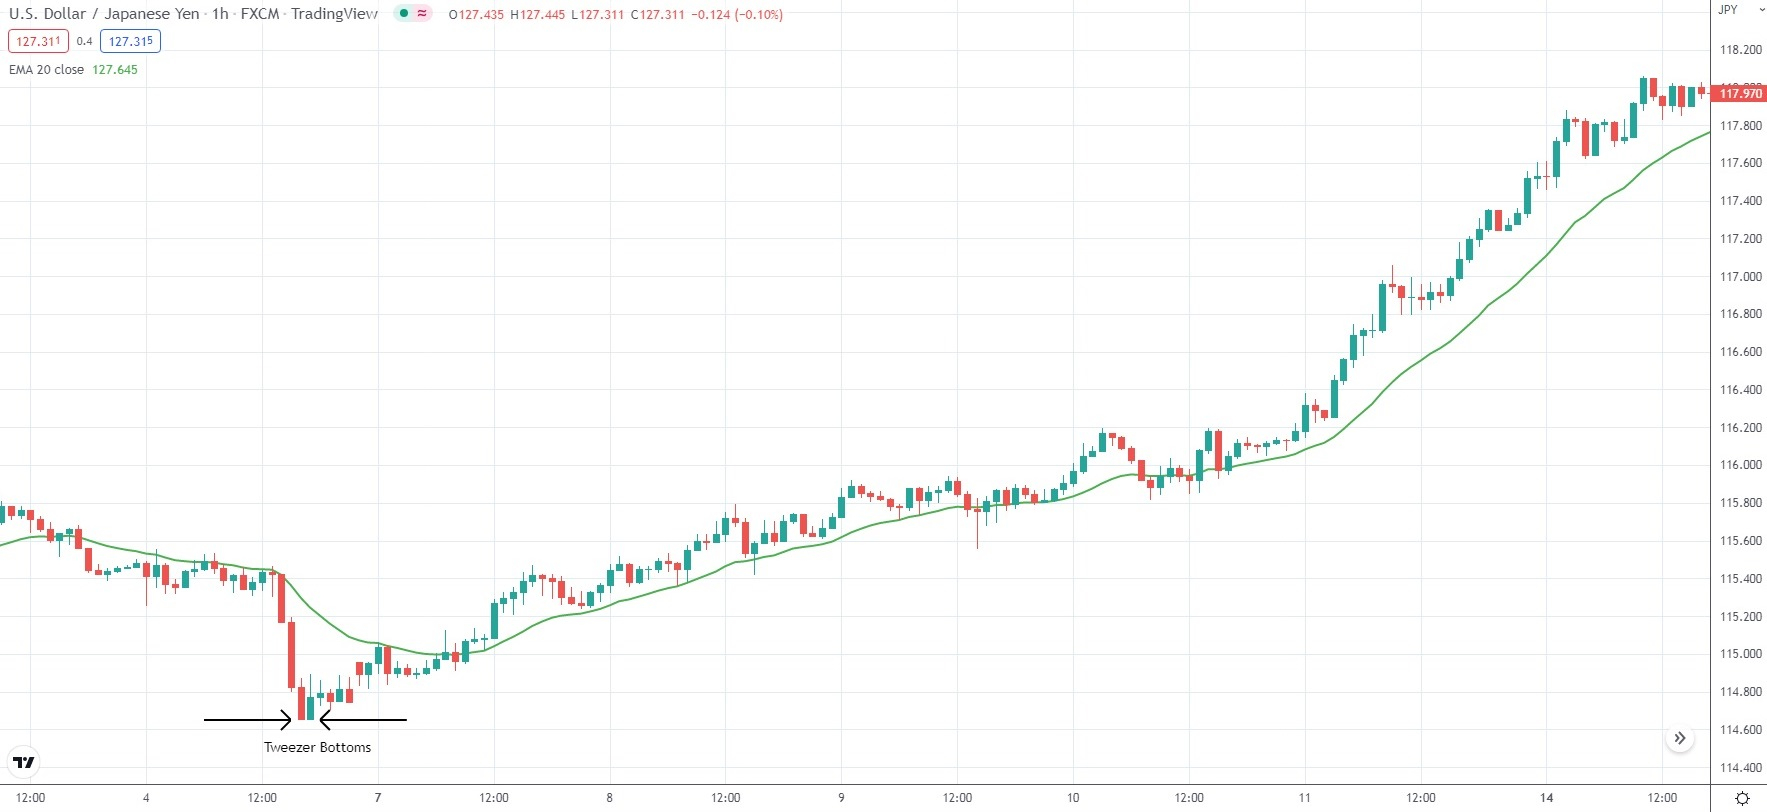
Both variations consist of two opposite candlesticks, one bullish and one bearish, with their lows and highs matching. Again, for Tweezers to work properly, the market must exhibit a recognizable short-term or long-term trend.
How can this pattern be interpreted? In a bull trend, at the wick of the first candlestick, the bulls have been overpowered by the bears. The wick of the second candle indicates another attempt by the bulls to drive the market higher. After the bulls fail to assume market control twice in a row, sellers finally gain the upper hand and can drive the price down.
In general, Tweezers must have matching highs or lows, whether the match occurs in their bodies or wicks. The highs or lows of the candles in some Engulfing formations may also match, but this is still considered a Tweezer. Therefore, more than two candles may participate in the formation of Tweezers, and they must all have matching lows or highs.
The ideal Tweezer scenario assumes that the bodies and wicks of the two candlesticks are quite similar. The formation is even more powerful when the candles look like “twins”.
Note that the bodies of the two candlesticks are not necessarily required to be the same size. The matching lows and highs may also show a small difference. However, the more identical the candles appear on the chart, the greater the possibility of a trend reversal.
Harami
This is a double-candle pattern consisting of one large candlestick (either red or green) and one small candlestick, whose body is completely engulfed by the first candle’s body. The second candlestick is also known as a spinning top and can be a Doji, a Hammer, a Hanging Man, or a Shooting Star. Traders should look for situations where the second candle’s body is within the first candle’s body. The wicks of the second candle are not required to be within the range of the first candle. It follows that traders should watch the open-close range rather than the high-low range of the candles.
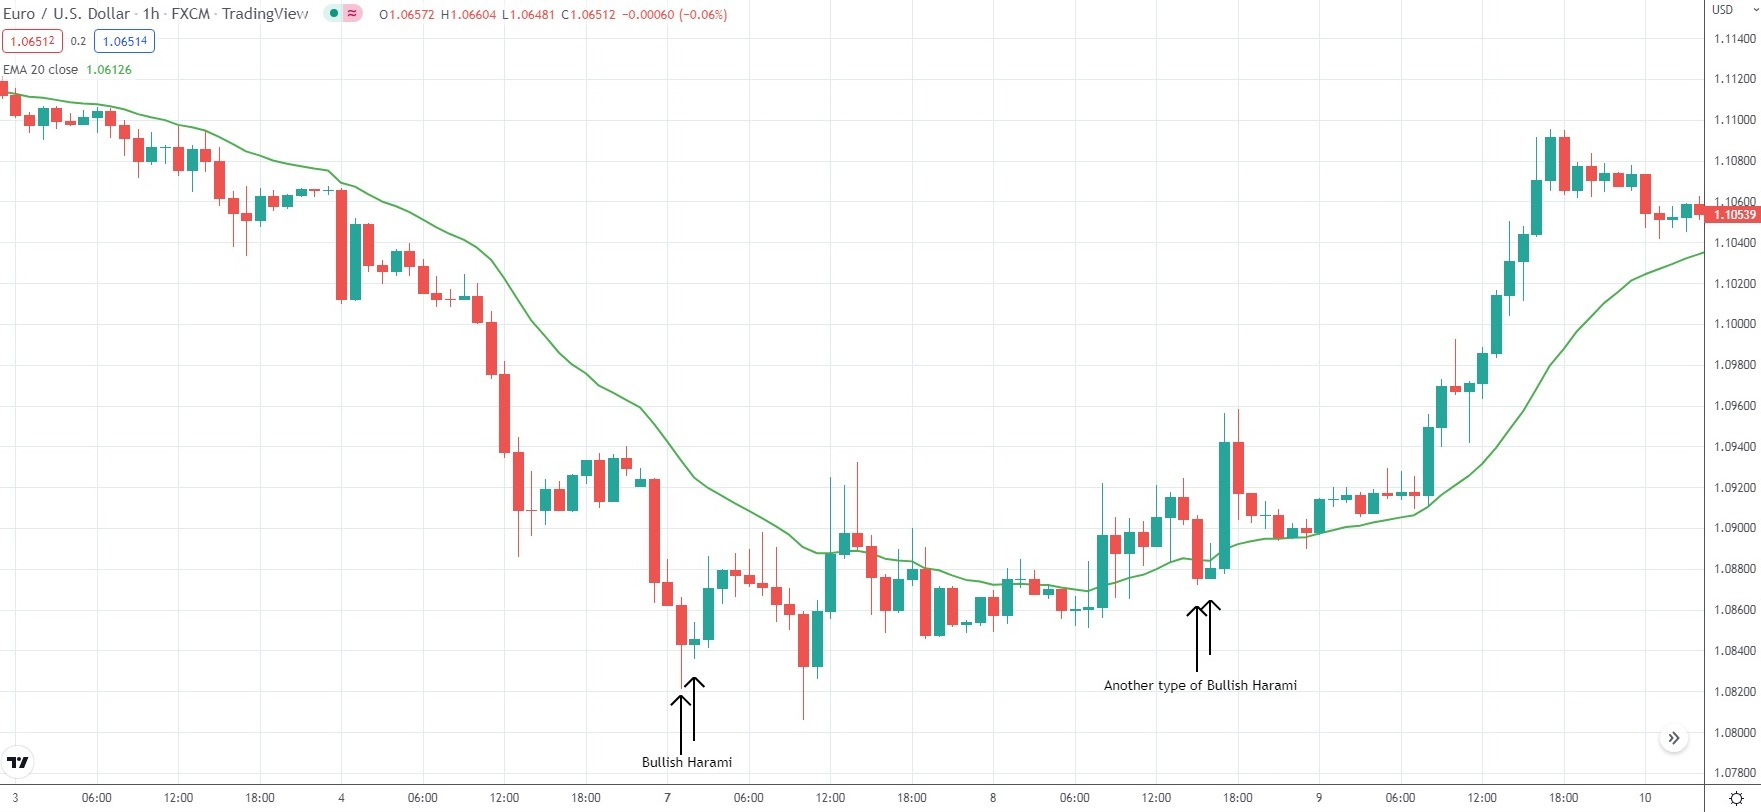
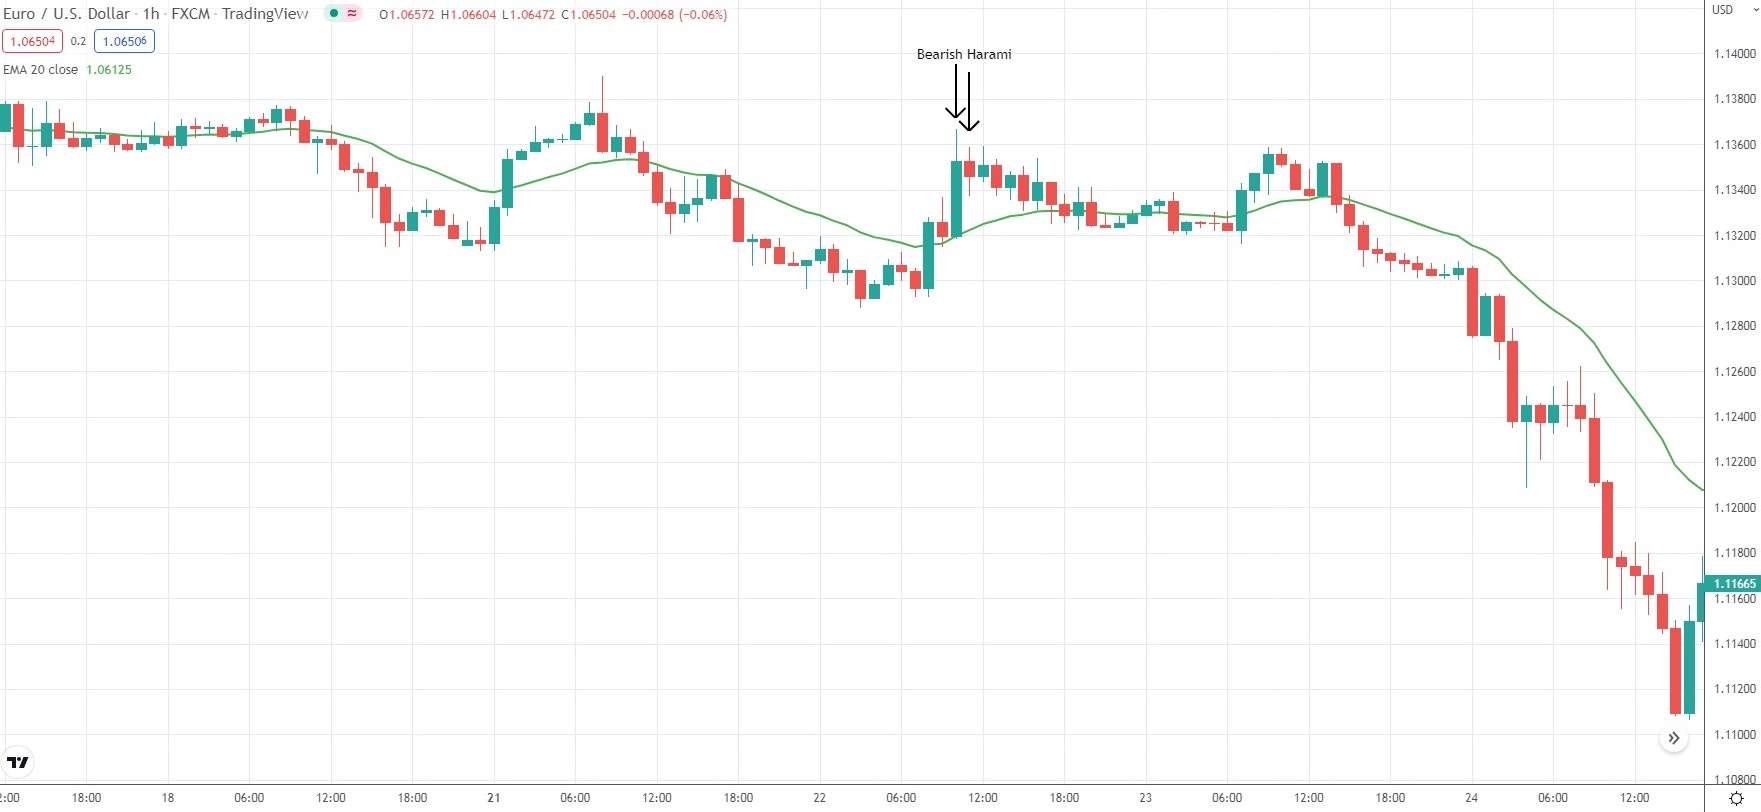
The second small-body candlestick suggests a contraction in market volatility. In the short-term, this is usually followed by a surge in volatility and the beginning of a new trend. Therefore, the Harami may signal either a trend reversal or current trend acceleration. It depends on the direction of the breakout.
Next, we shall discuss some price patterns consisting of three candlesticks.
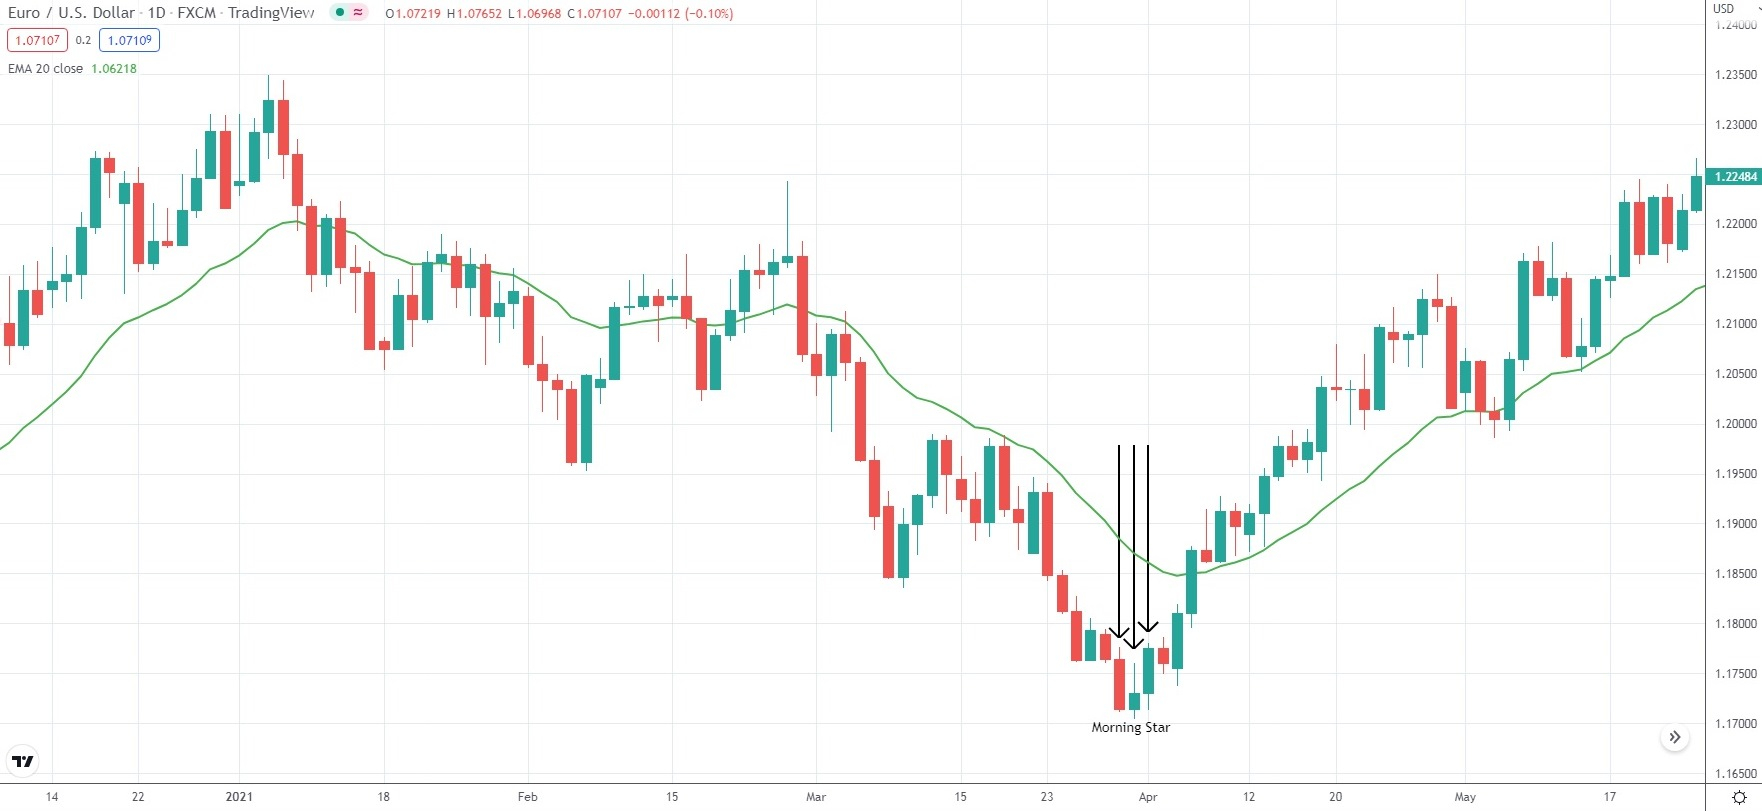
Evening Star, Morning Star
Both formations signal a trend reversal. The Evening Star is a triple-candle bearish formation that appears at a market peak, signaling the end of a bull trend. The first candle in the pattern is big and bullish and is followed by a small candle known as a “star”. As was the case with the Dark Cloud Cover, the appearance of a star candle suggests an opening gap. Yet, since the price decreases afterward and the body of the star forms, we should note that it must not cross the body of the big bullish candle (the first candle in the pattern).
The star candle can be either bullish or bearish. It can also be a Doji candle, in which case the formation is an “Evening Doji Star”. Even if the second candle is not a Doji, it will always bear certain similarities to the Doji since it indicates a sudden halt in price movement.
For the Evening Star pattern to be successful, the third candle must be a big bearish one. This signals the bears have overpowered the bulls during the formation of the star candle. The body of the third candle must not cross the star. However, this is not an essential requirement for the Evening Star since it occurs rarely. On the other hand, a key condition for the pattern is for the bearish candlestick to deeply penetrate the body of the bullish candlestick. The level of penetration is essential – the body of the third candle must extend to 2/3, or even 3/4, of the height of the first candle in the formation.
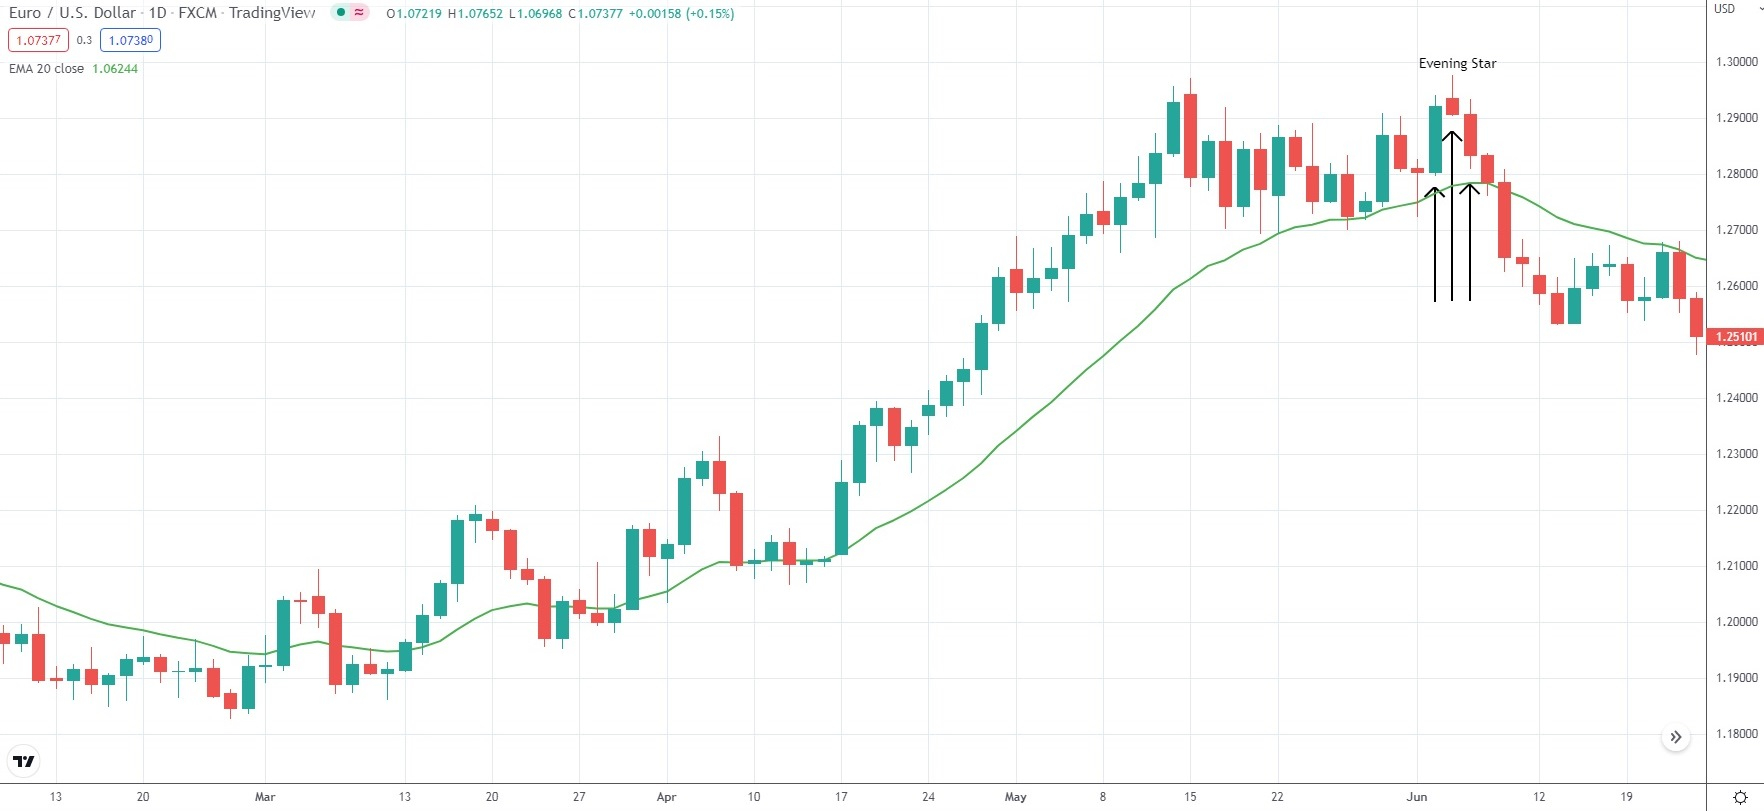
If the market closes above the pattern’s high, the Evening Star formation is a false signal. If the market closes below the pattern’s low, the formation is successful.
The Morning Star is a bullish formation, and all the requirements we discussed above apply in reverse.
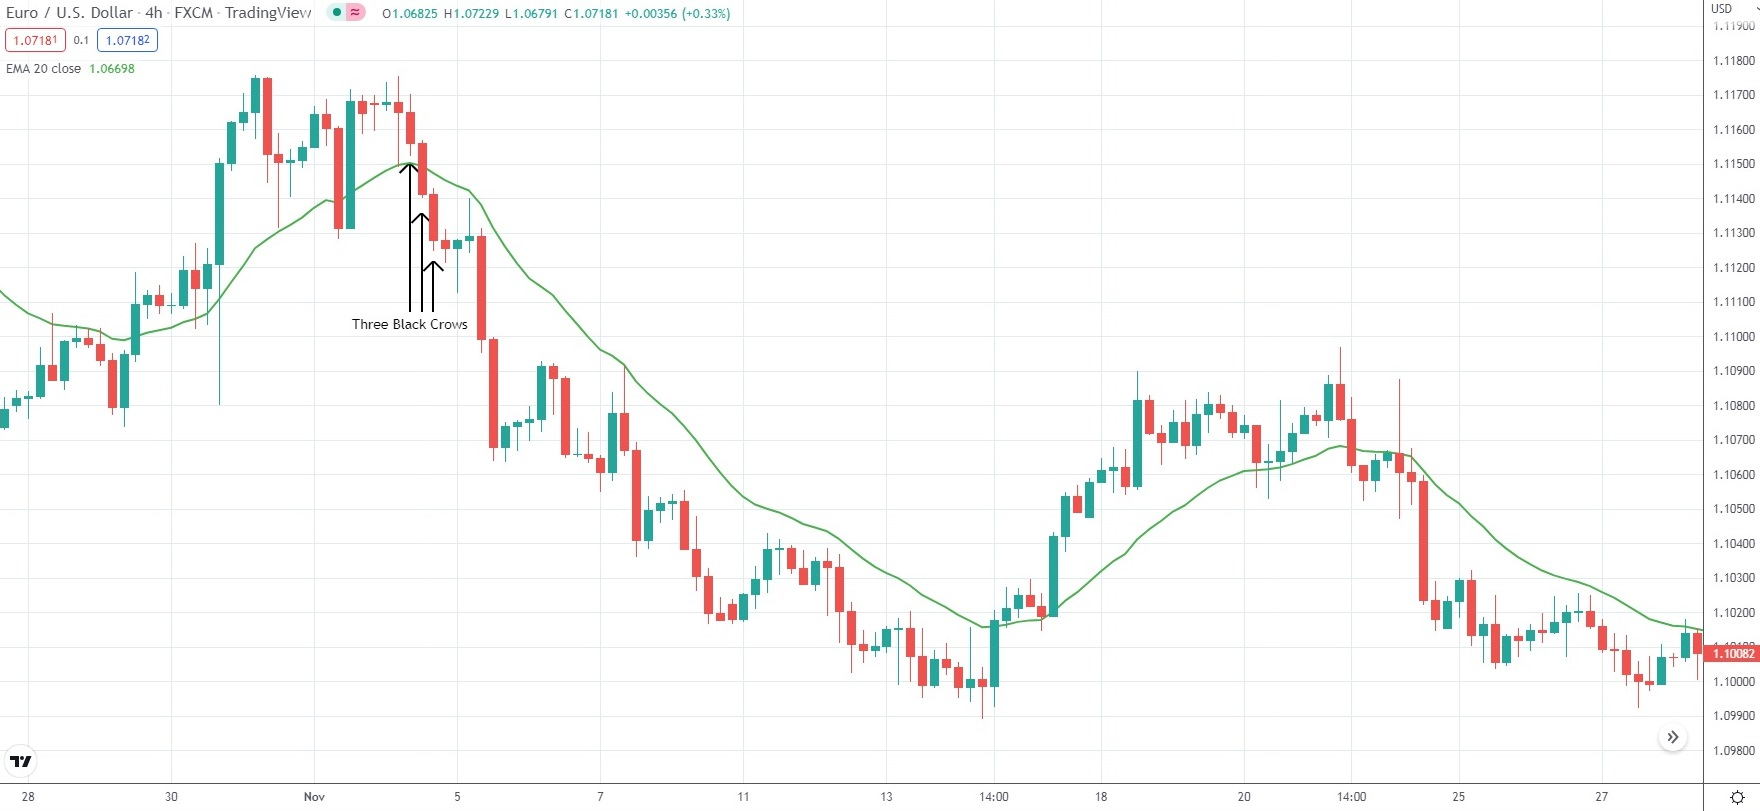
Three White Soldiers, Three Black Crows
These two patterns comprise 3 identically colored candlesticks. The Three White Soldiers formation signals a bullish reversal, while the Three Black Crows pattern signals a bearish reversal.
The Three White Soldiers formation consists of 3 successive bullish candles of similar size and usually appears after a bear trend. The second candle is larger than the first, while the third candle is at least the size of the second candlestick. If the third candle appears to be considerably smaller than the first two, this would suggest buyers are not fully in control of the market, while such an occurrence may be the reason why there is no reversal of the bear trend.
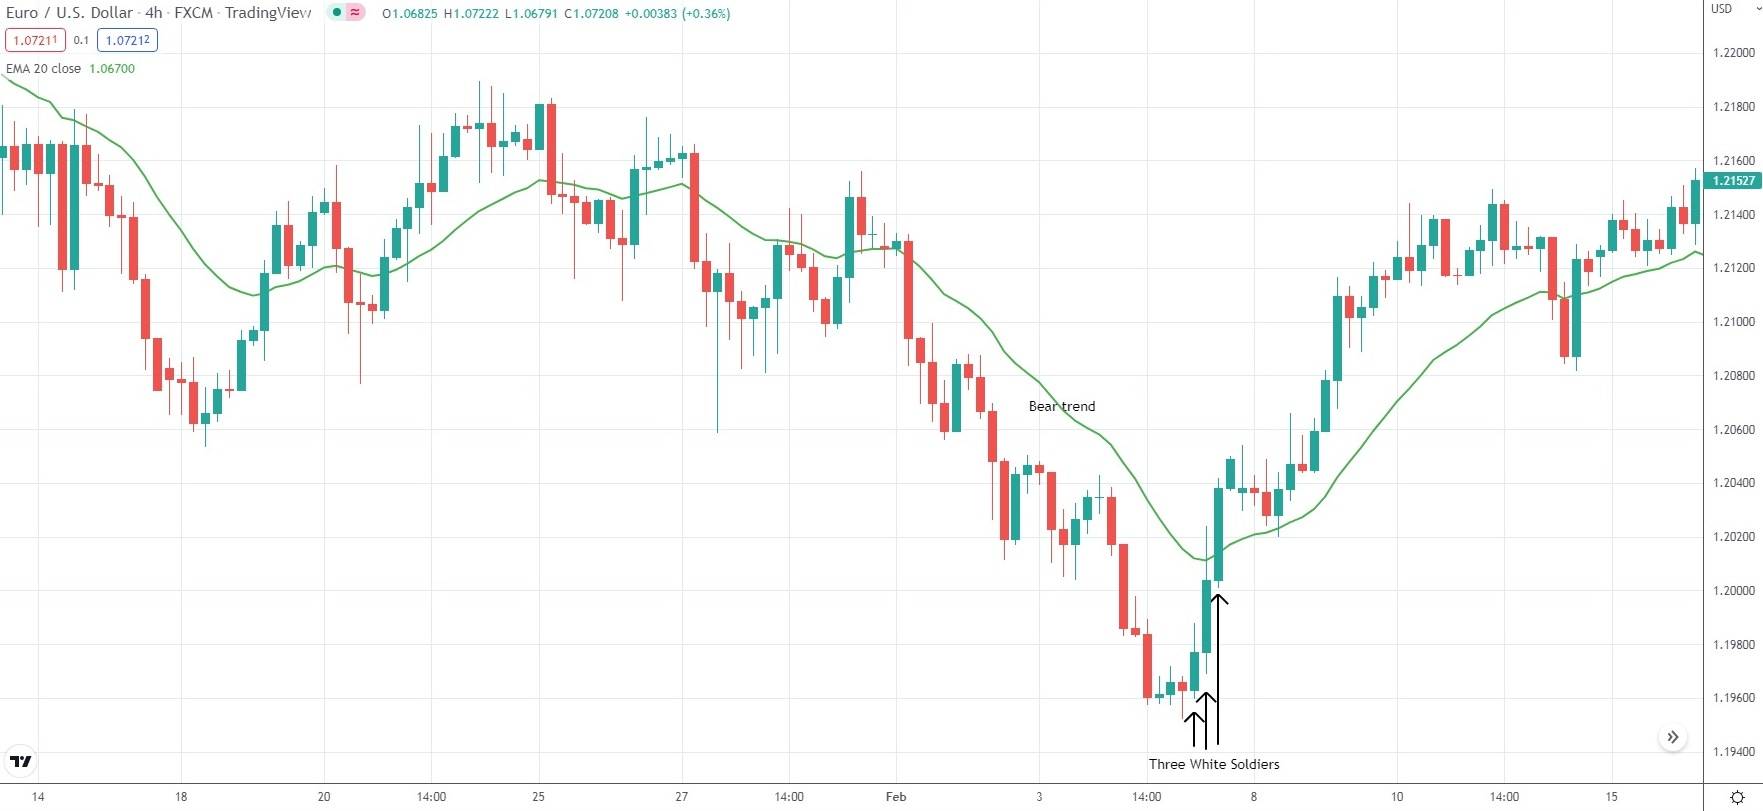
Each of the candles needs to open within the body of the prior candle or at its high. Overextended bodies are also something to be on the lookout for, since the trading instrument could become overbought, and a retracement may occur. The three candles need to be reasonably long and to have small or no upper wicks – or, they need to close at or in proximity to their highs. Note that if the wicks are too long and match or even exceed the length of the candles’ bodies, this would suggest that sellers are still strong.
The formation becomes more powerful when the open prices of the second and the third candlesticks coincide with the closing prices of the first and the second candles, respectively. The pattern will also be stronger if it appears both after a prolonged bear trend and a consolidation that follows it, separating it from the Three White Soldiers setup.
The Three Black Crows pattern comprises 3 successive bearish candles of similar size and usually appears after a bull trend. Each of the three opens within the body of the prior candle or at its low. Ideally, these candles should be reasonably long with small or no lower wicks. A significantly smaller third candle might suggest weakening bearish momentum, while overextended bodies could indicate oversold conditions and a potential for a bounce.
Bullish Abandoned Baby Pattern
This is a three candle pattern that forms in an existing bear trend and signals the potential reversal of that trend. Price action traders expect that once the pattern has been completed, the market will continue to move higher, as selling has been exhausted (at least for now). There are certain criteria required for the Bullish Abandoned Baby pattern to form:
- First of all, the first candle is a large bearish one, and it is part of a defined bear trend;
- Second, the next candle is a Doji that gaps below the closing price of the first candle;
- Third, the final candle is a large bullish one that opens above the Doji and demonstrates aggressive movement to the upside.
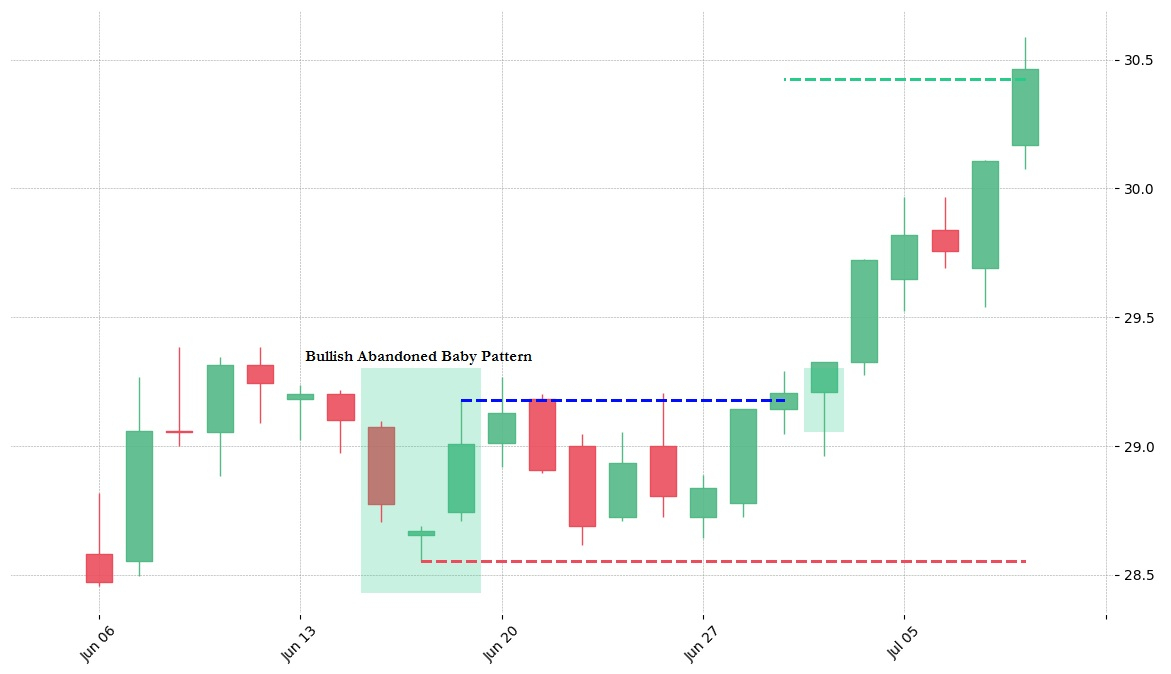
The idea behind this pattern is that the market has been moving in a defined bear trend and another big sell-off has just occurred, as evidenced by the appearance of the first large bearish candle. The appearance of the Doji indicates leveled-off selling, with the opening and closing prices of the candle being almost the same. It also indicates bears may be losing momentum, and bulls are starting to join in. The Doji is followed by a large bullish candle that gaps higher. It indicates that bulls have regained control of the market, while selling has been exhausted for the moment.
At times, traders can observe the formation of two or three Doji candles before the market makes a move to the upside. This is again considered a Bullish Abandoned Baby pattern, because there has been a steep decline and a leveling off, followed by a sharp increase.
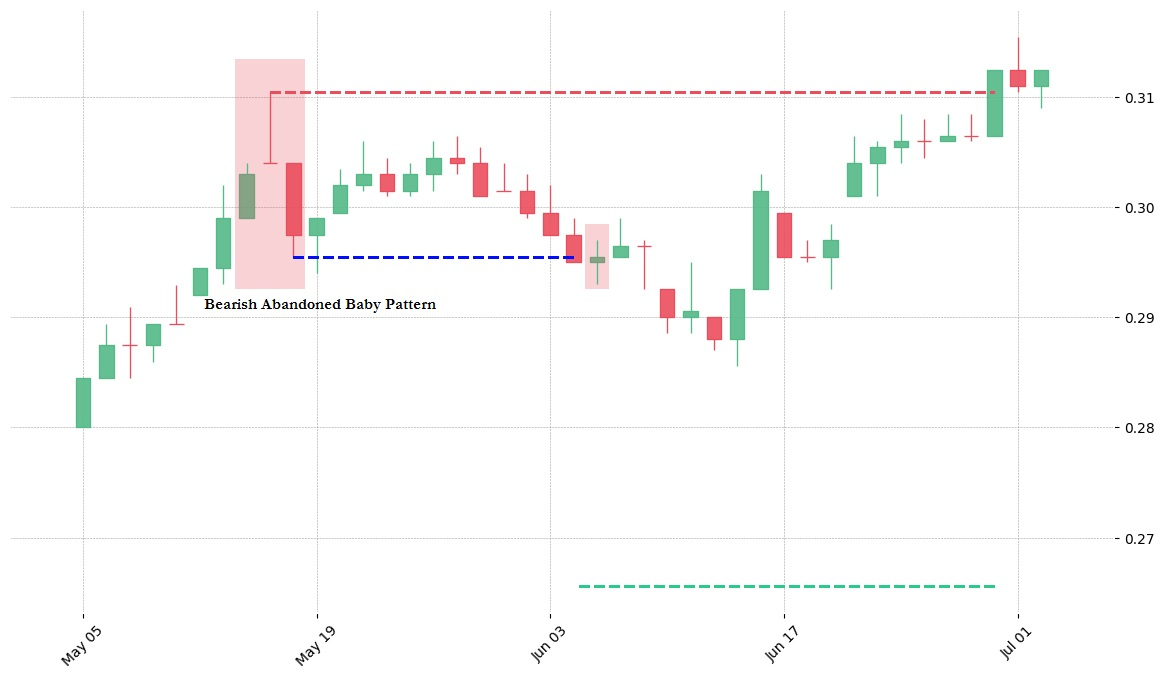
Bearish Abandoned Baby Pattern
This is a three-candle pattern that forms in an existing bull trend and signals its potential reversal. Price action traders expect that once the pattern has been completed, the market will continue to move lower, as buying has been exhausted for the time being. There are certain criteria that will need to be met for the Bearish Abandoned Baby pattern to form:
- First of all, the first candle is a large bullish one, and it is part of a defined bull trend.
- Second, the next candle is a Doji that gaps above the closing price of the first candle.
- Third, the final candle is a large bearish one that opens below the Doji and demonstrates aggressive movement to the downside.
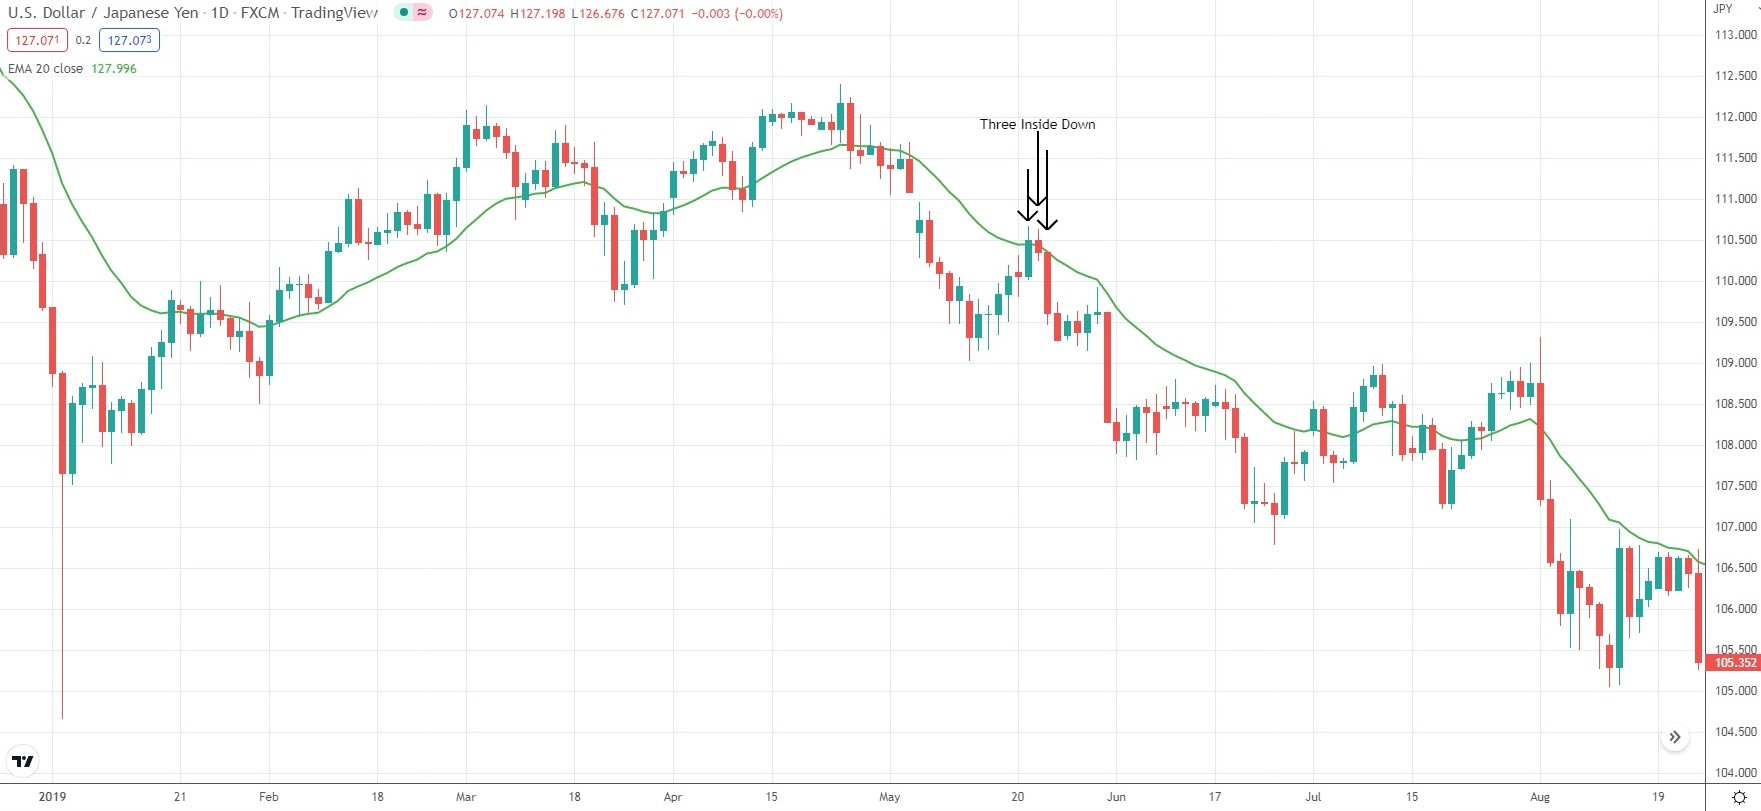
Three Inside Up, Three Inside Down
The Three Inside Up represents a bullish reversal formation that appears at market troughs, while the Three Inside Down is bearish and manifests at market peaks. The Three Inside Up formation can be observed at the end of a bear trend and often coincides with a support level.
Note that the pattern does not necessarily suggest that a trend reversal will occur soon. It may simply precede a market pause or a correction. The first candle in the pattern is a large bearish one, while the second is a smaller bullish spinning-top candle or a Doji. Thus, the two candles form a Harami.
The smaller candle must close at least at the midpoint of the previous candle’s body. Then, a third bullish candle breaks up and closes above the body of the first candle. An even stronger signal will be generated if the third candle closes above the first candle’s high.
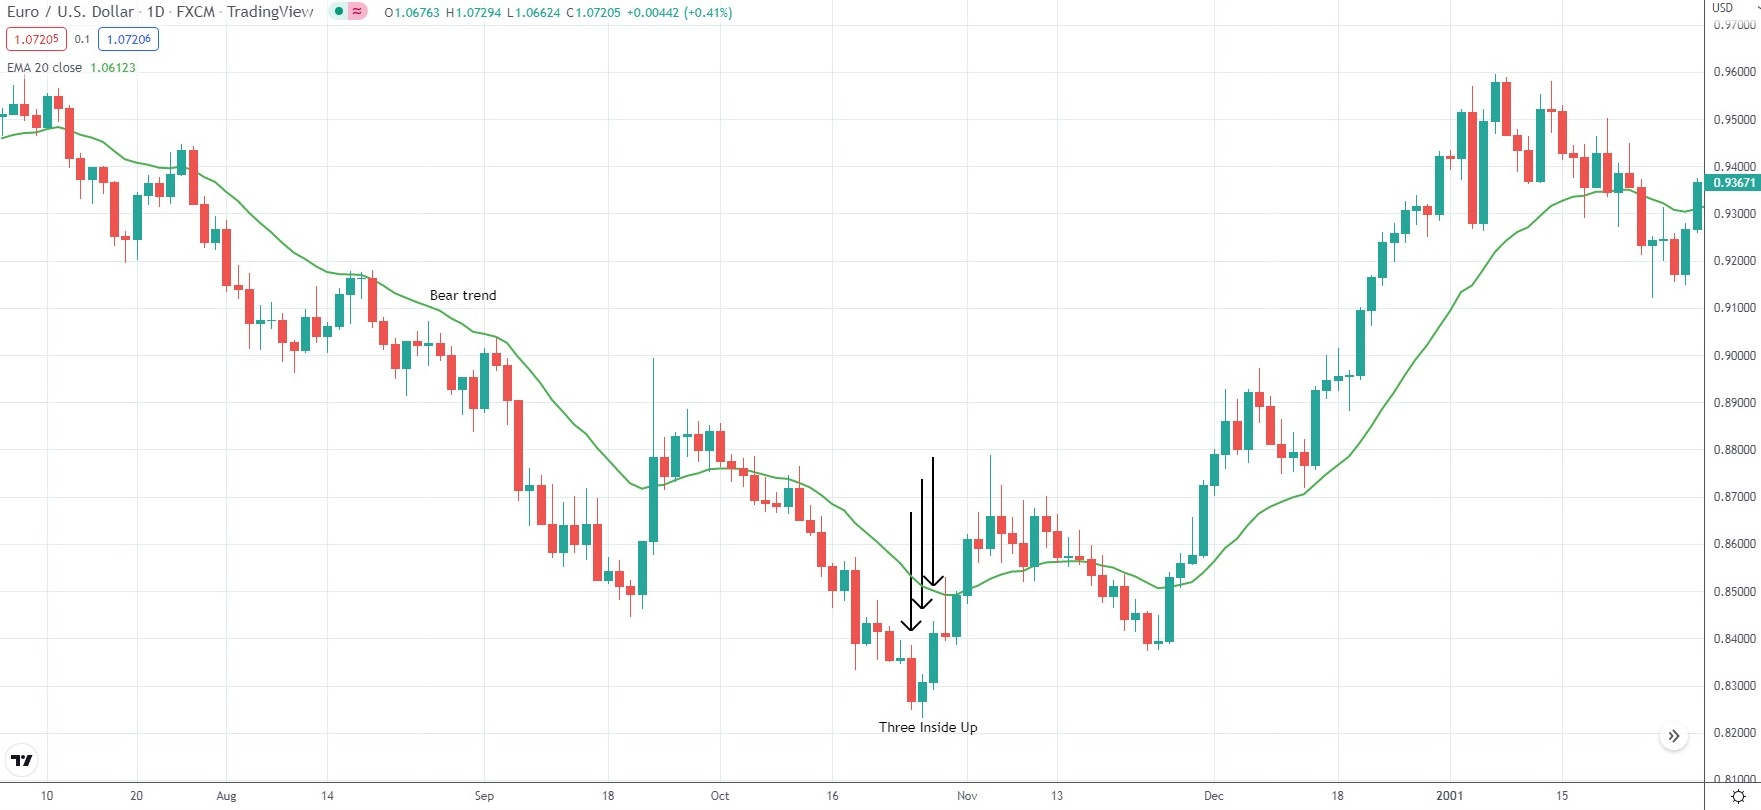
The Three Inside Up pattern bears a certain similarity with the Morning Star. Yet, it is even more powerful since the second (middle) candle has not reached a new high or low when the opposite side (bulls in this case) takes control of the market. What is more, by the time the third candle begins to form, the bulls are already dominating and eventually manage to drive the price even higher compared to the price movement we see in the Morning Star pattern.
Three Outside Up, Three Outside Down
The Three Outside Up (bullish) and the Three Outside Down (bearish) formations also signal a trend reversal. The Three Outside Up formation usually appears at market troughs. The first candle is a small bearish spinning-top type of candle that matches recent market movement. The second candle in the pattern is a large bullish one and engulfs the first candle. We can say that the Three Outside Up actually starts with an Engulfing formation. The pattern then ends with the appearance of a third bullish candle closing above the second candle. The third candlestick reaches a new peak above the high of the Engulfing formation.
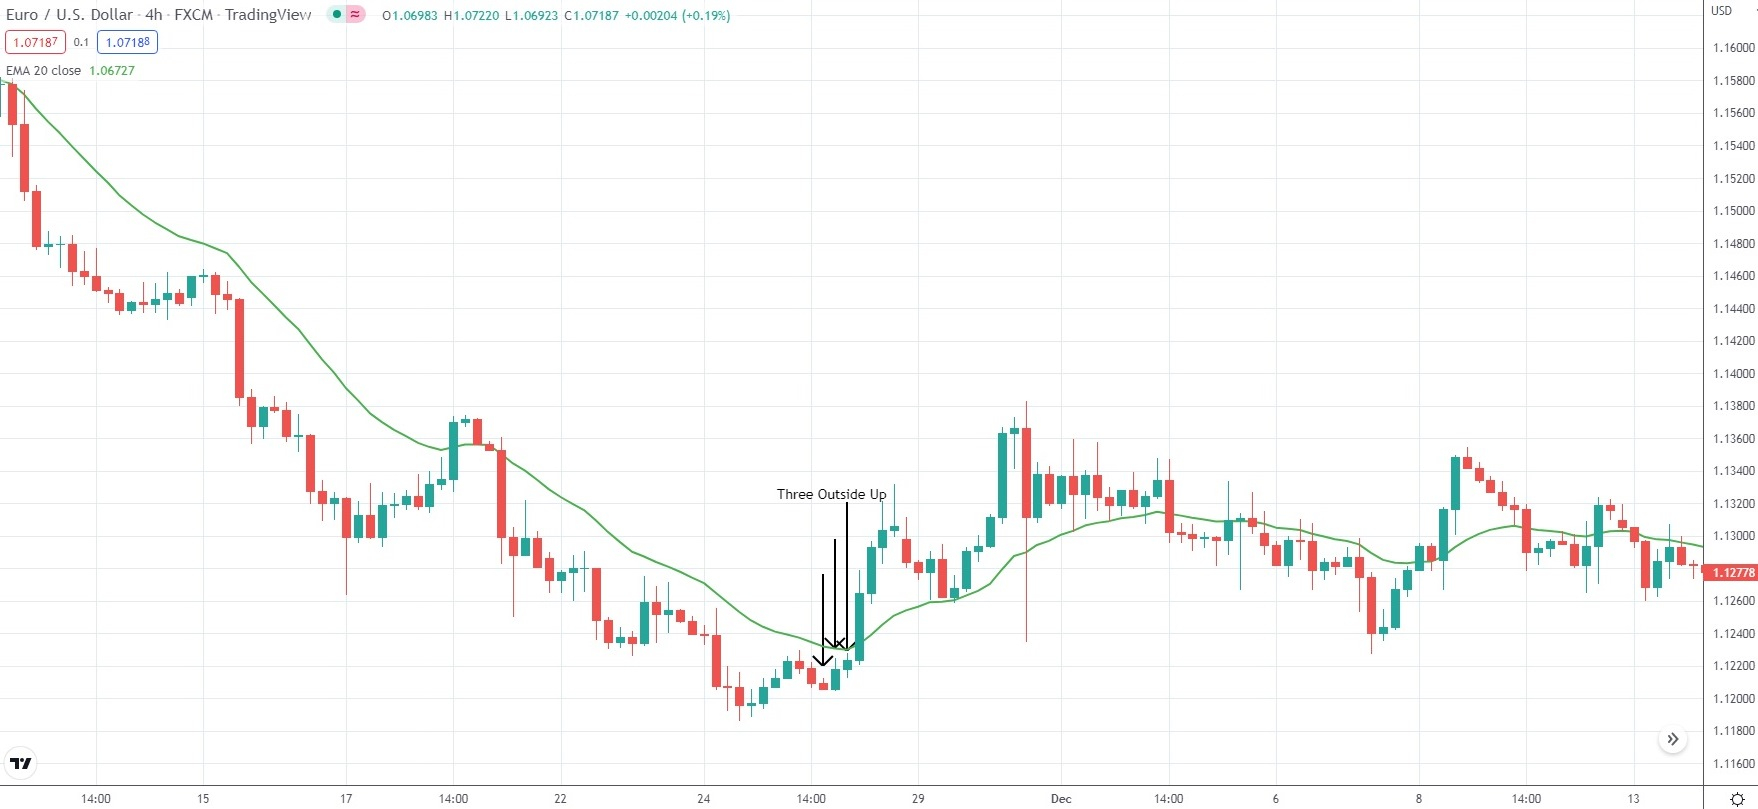
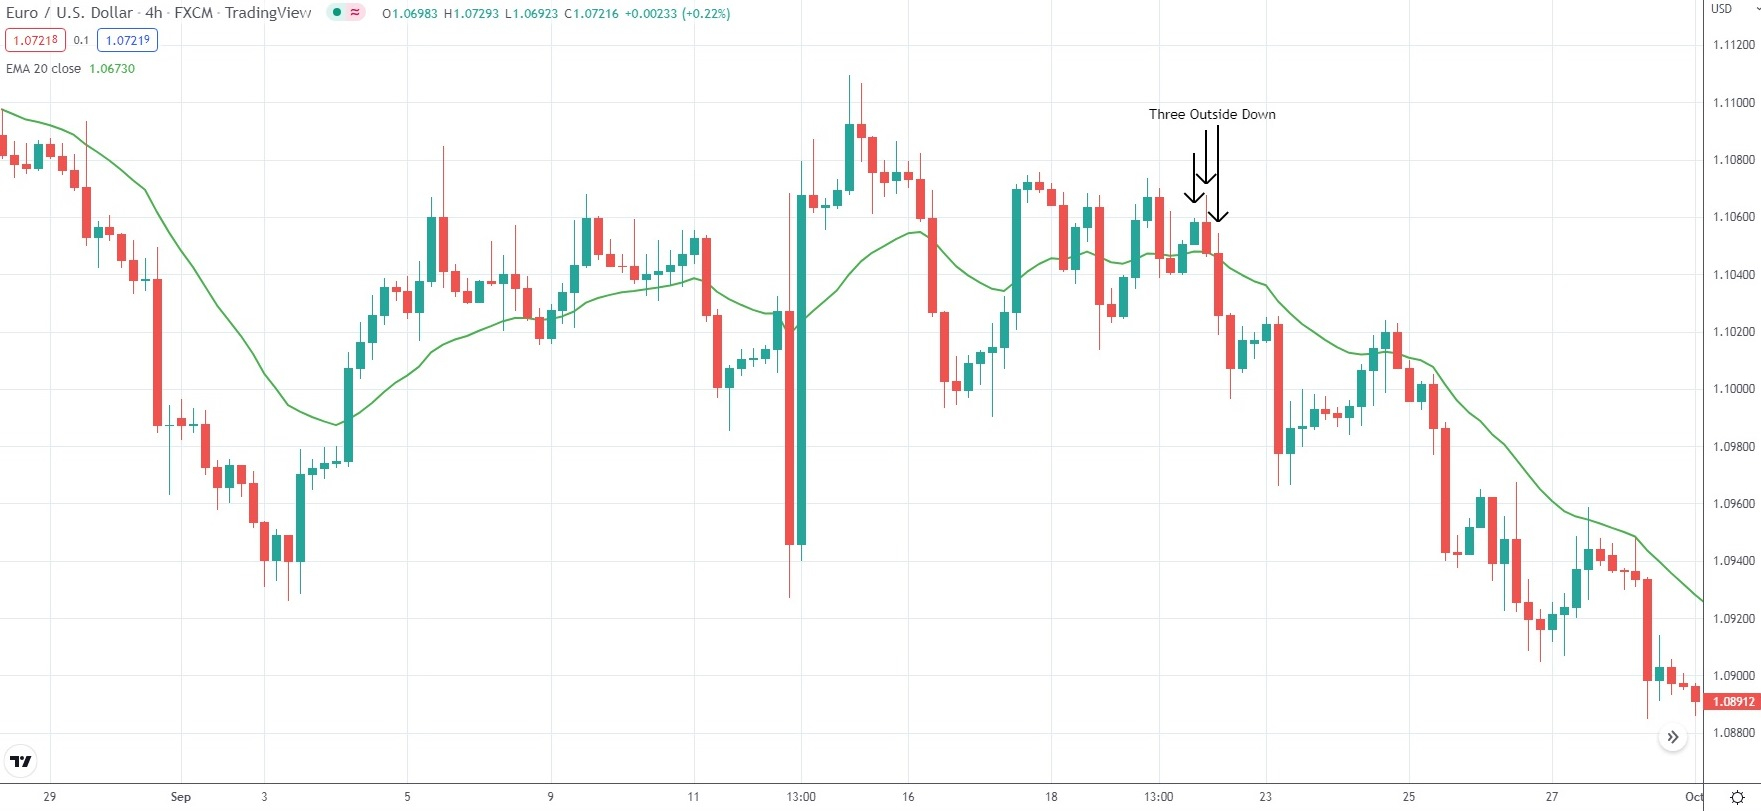
The Three Outside Up pattern is usually regarded as less reliable than other triple candle formations, because outside candles are less predictable and profitable compared to inside candles, as in Morning Star/Evening Star and Three Inside Up/Three Inside Down patterns.
Now, let us take a look at several trend continuation candlestick setups.
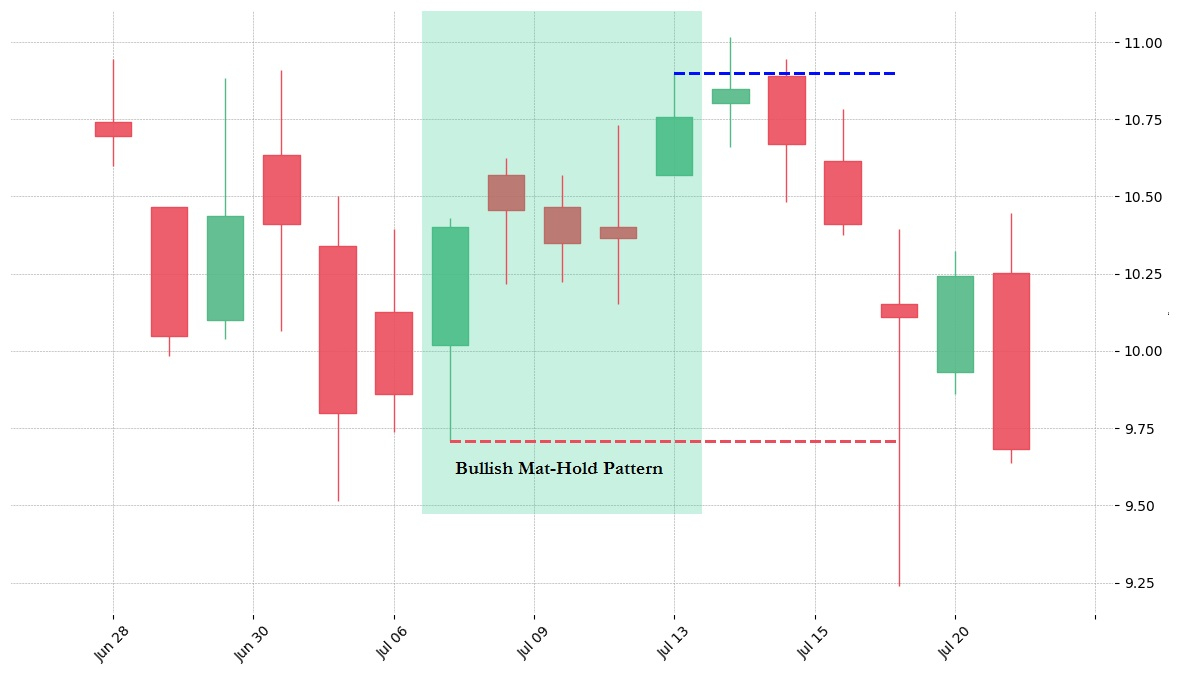
Mat-Hold Pattern
This is a five-candle trend continuation pattern with a bullish and a bearish variation. The bullish pattern consists of a large bullish candle and a higher price gap, followed by three small-bodied bearish candles. These three candlesticks ideally remain contained within the price range of the first large bullish candle, representing a temporary pause or profit-taking within the existing uptrend. The fifth candlestick is again large and bullish, signaling that the underlying buying pressure has resumed and indicating a potential continuation of the uptrend.
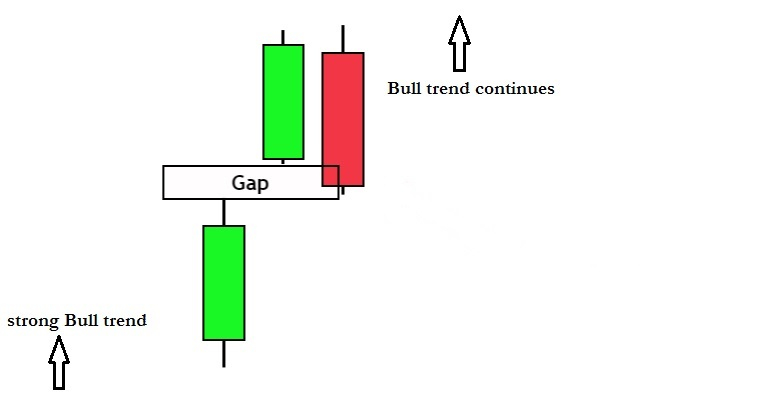
Upside Tasuki Gap
This is a three-candle bullish continuation pattern that appears during an existing bull trend. The first candle has a large body and is bullish. The second candle is also bullish and forms after a gap up. The third candle is bearish and closes in the gap formed between the two bullish candlesticks. Ideally, this bearish candle should not completely close the gap; the failure to do so suggests that the underlying bullish momentum remains strong. Further bullish price action after the completion of this pattern can serve as confirmation of the continuation signal.
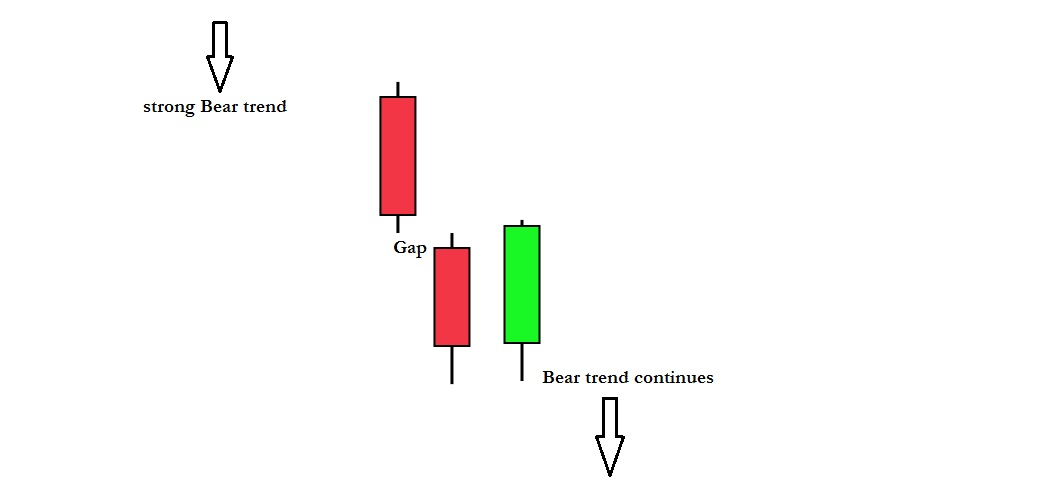
Downside Tasuki Gap
This is a three-candle bearish continuation pattern that appears during an existing bear trend. The first candle has a large body and is of a bearish type. The second candle is also bearish and forms after a gap down. The third candle is of a bullish type and closes in the gap formed between the first two (bearish) candlesticks. The failure of the bullish candle to close the gap indicates that the bearish momentum is still strong.
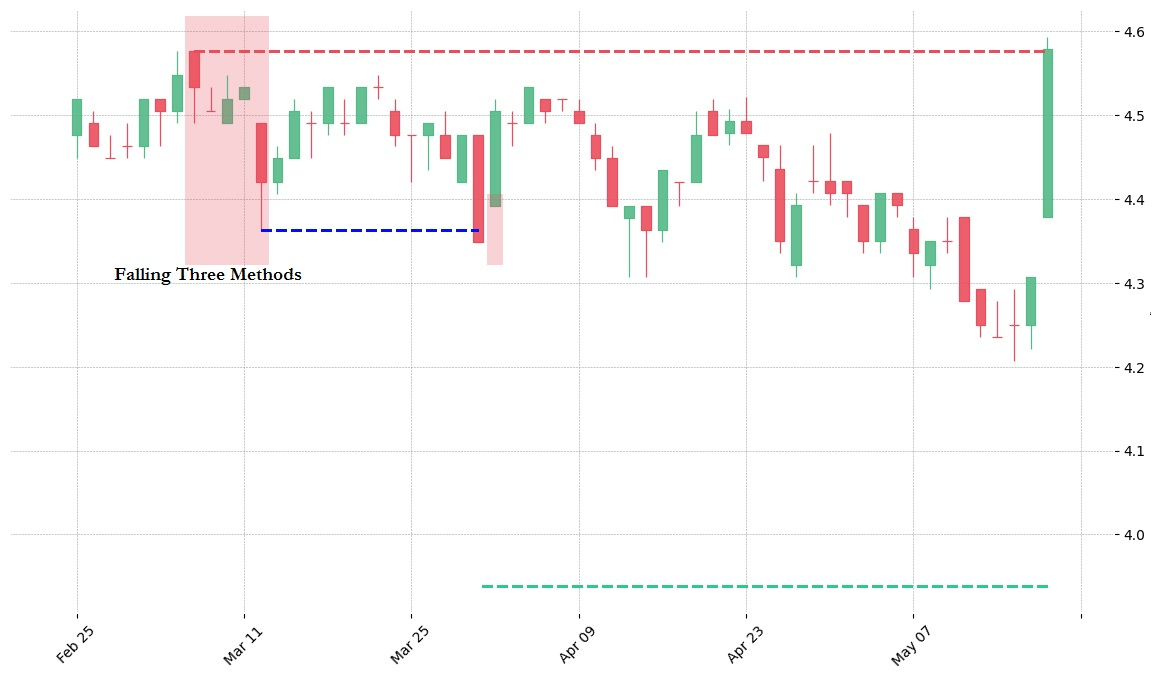
Falling Three Methods Pattern
This is a five-candle bearish continuation pattern indicating a temporary market interruption without reversal of the existing bear trend. The pattern includes two large candles in the direction of the underlying trend at the start and end, with three small counter-trend bullish candles in the middle. The formation indicates buyers are still not strong enough to reverse the existing trend.
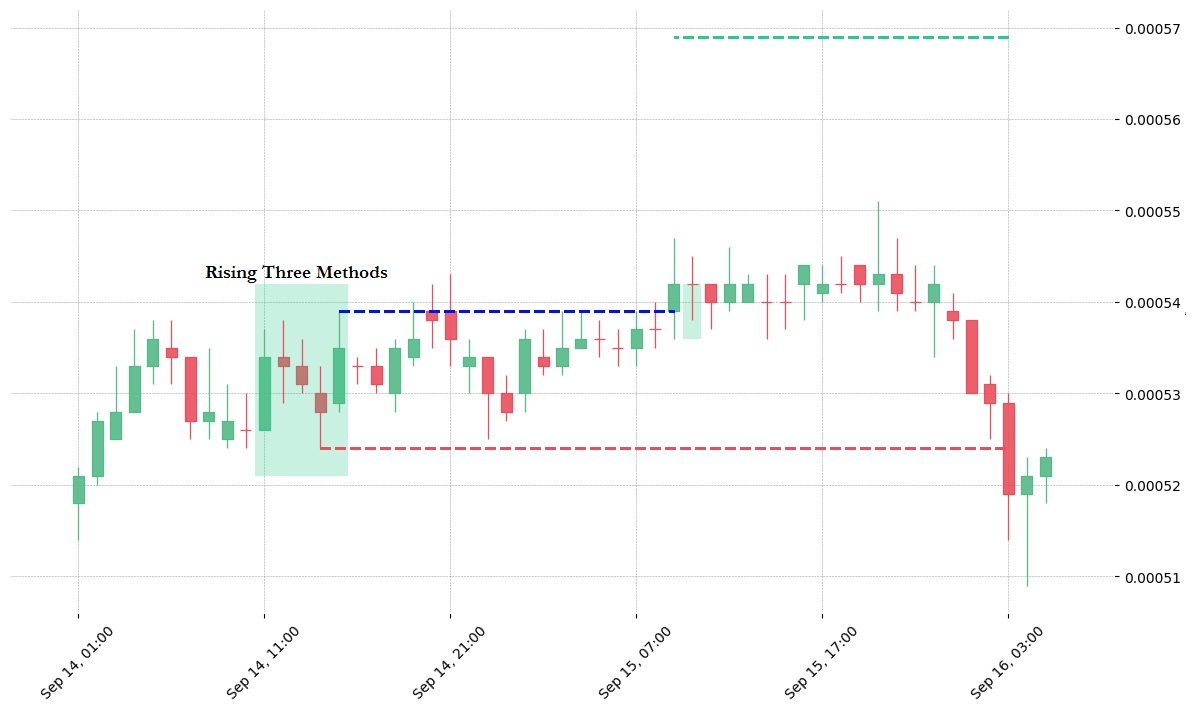
Rising Three Methods Pattern
This is a five-candle bullish continuation pattern indicating a temporary interruption in the market with no reversal of the existing bull trend. The pattern includes two large candles in the direction of the underlying trend at the start and end, as well as three small counter-trend (bearish) candles in the middle. This formation tells price action traders that sellers are still not strong enough to reverse the existing trend.
Fibonacci Levels Calculator
| Level | Price |
|---|
| Level | Price |
|---|
Conclusion
Price action trading is closely related to recent historical data and takes into account all technical analysis tools, including charts, trend lines, price bands, swing highs and swing lows, support and resistance levels, consolidation, and so on. Common patterns observed by price-action traders include breakouts, retracements, and various candlestick setups. In comparison, a typical technical analysis scenario, such as a shorter-term moving average crossing over a longer-term moving average, will lead to similar behavior and action among multiple traders.
Psychological and behavioral interpretations and the trading decisions resulting from them are also an essential aspect of price action trading. Different traders will usually interpret a given price action differently, because they have defined rules and different behavioral understanding of the market.
Price action trading is more appropriate for short-to-medium-term trades rather than for long-term positions. Many traders believe that global markets follow a random pattern and there is no systematic way to build a trading strategy that works flawlessly every time. Price action has gained massive support within the trading community, as it combines technical analysis with recent price history to identify trading opportunities based on one’s interpretation of market conditions.
Self-defined price action strategies offer flexibility and apply to various asset classes. You can backtest and use them with any trading software, application, or portal. While technical analysis tools can aid price action trading, the decision to open a position ultimately depends on the individual trader. To sum up, traders relying on price action benefit from greater flexibility as they are not adhering to a fixed set of rules.
About the Editorial Team