With increasing mortgage rates and persistently high inflation that continues to put a strain on many family budgets, affordability has become a top priority for new home buyers. Although the drop in fuel prices over the summer gave people a certain relief, housing prices in the US continue to climb, with some experts predicting that the housing market bubble is about to burst.
Whether that is the case or not, prices of new and existing homes are likely to cool off in the coming months. However, this does not mean that homes will become more affordable. On the contrary – unless there is a steep drop in prices and mortgage rates, or a considerable rise in wages, or some combination of the two, buying a home in the near future will be just as difficult as it is now for most people.
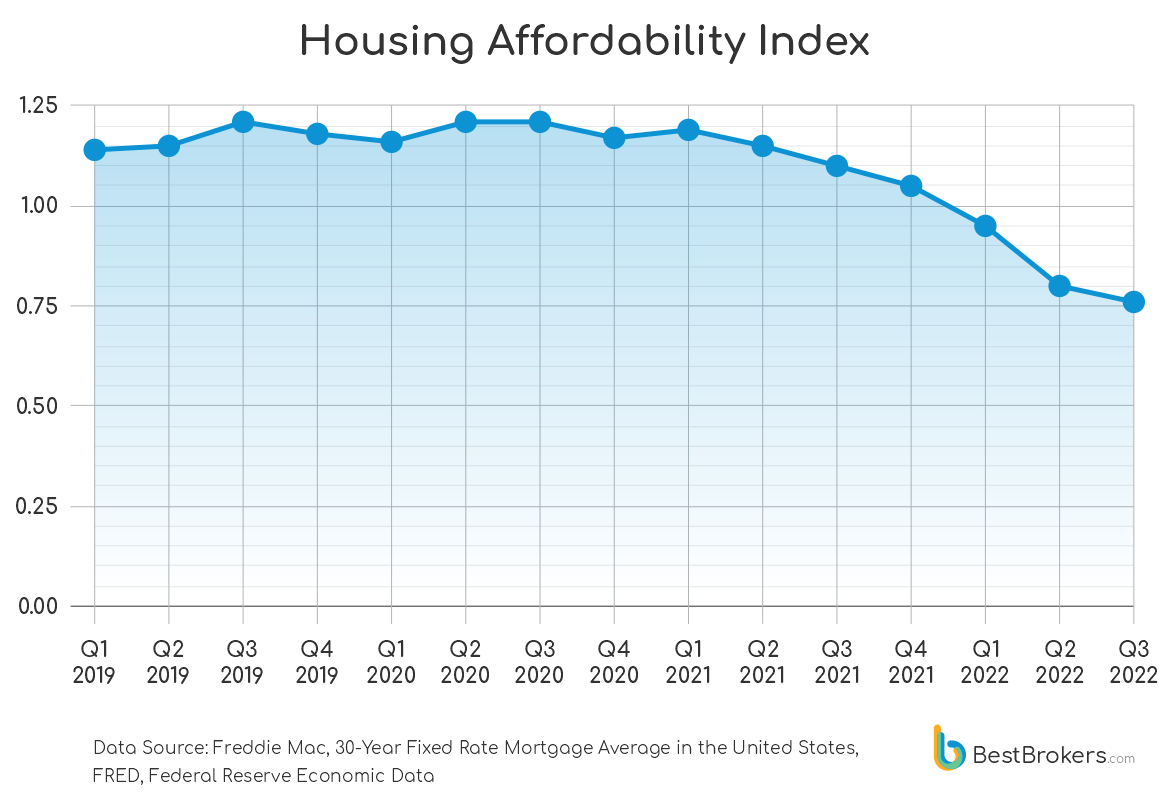
An index that compares sales prices to median family income clearly shows that purchasing a new home has become less affordable in 2022, compared to just a few years ago.
Moreover, it reveals that the affordability of homes has been dropping at increasing rates since 2020. The index was developed by the analyst team at BestBrokers in order to measure the cost of buying a new home relative to the amount buyers are actually able to pay. It shows that since the beginning of 2022, the average family income has not been sufficient to meet mortgage payments. In other words, families earn less than what is required to pay for their newly-purchased homes.
Rise in housing prices continues in Q3 2022, although at a slower pace
The soaring prices in 2022 have forced the Federal Reserve to take aggressive measures to curb inflation – four 75 basis point hikes in interest rates were introduced over the past year. This led to a spike in mortgage rates, which more than doubled from a year ago, reaching 6% and surpassing 7% for certain markets.
Another factor driving the upsurge in housing prices is the low supply – even before the COVID-19 pandemic, there was a supply shortage. As social distancing caused people to move away from urban areas, demand for new homes increased. This disrupted supply chain affected construction, leading to further shortages in new housing supply.
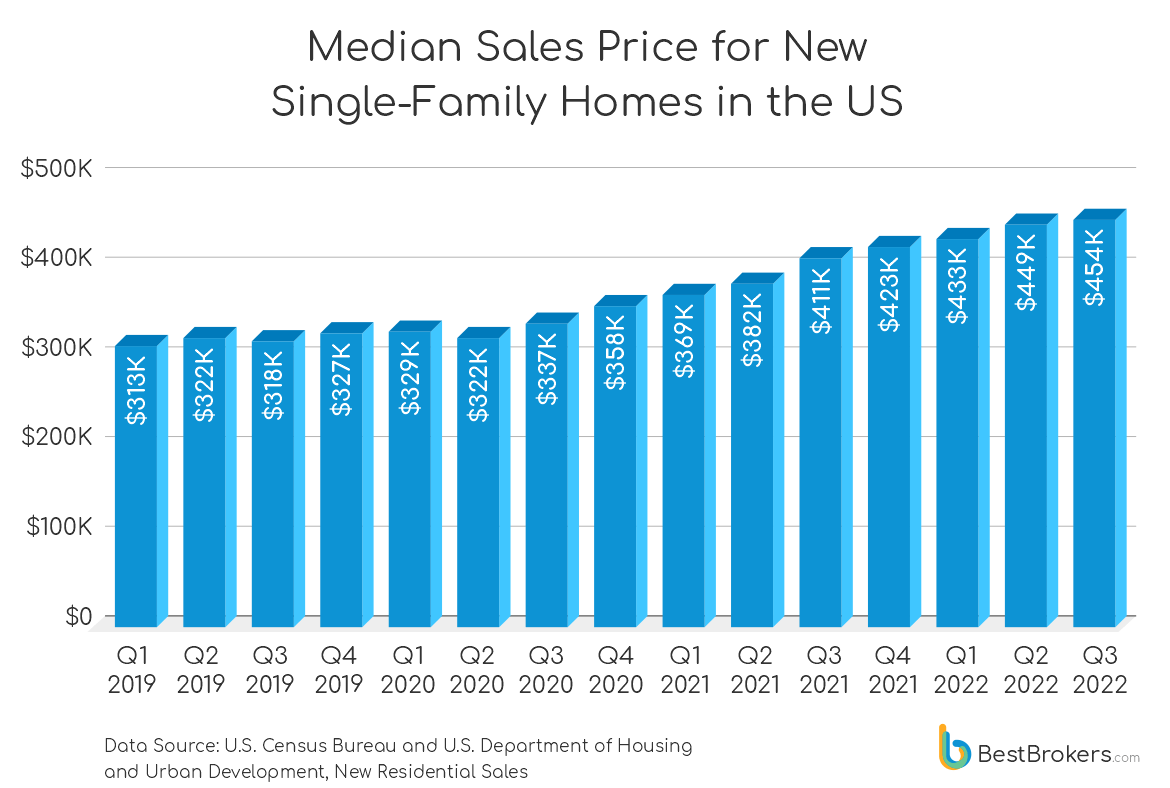
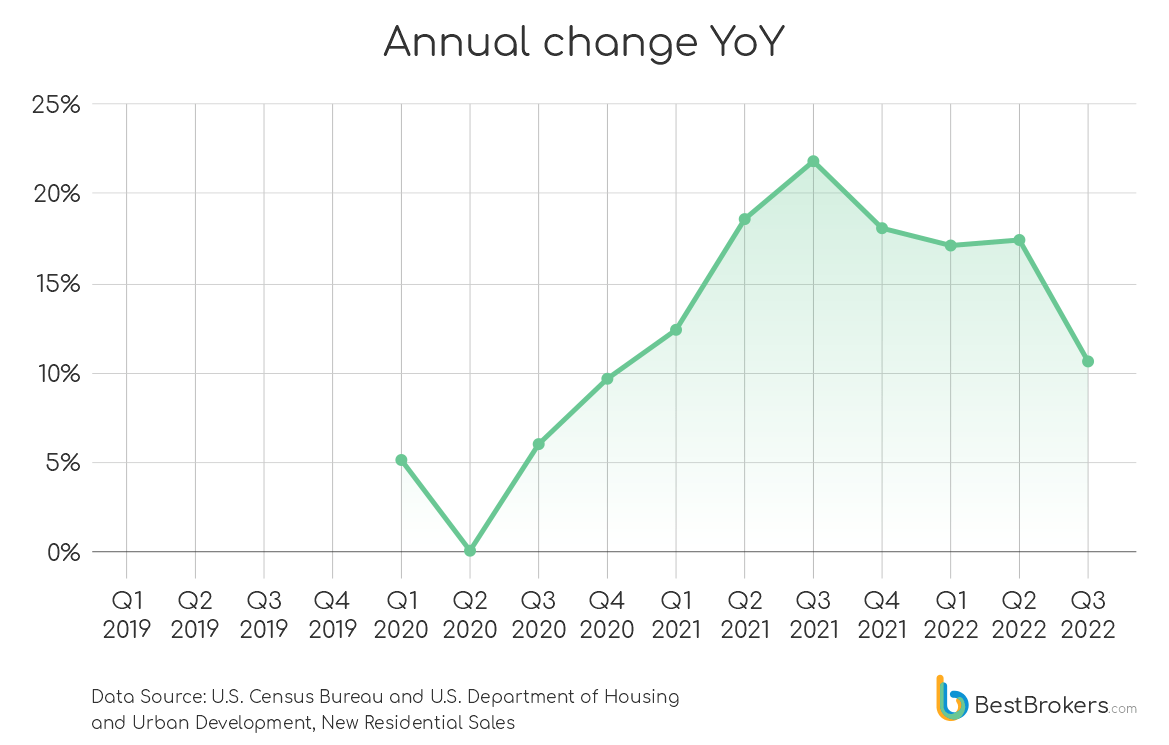
According to new residential sales data from the U.S. Census Bureau and the U.S. Department of Housing and Urban Development, there has been a double-digit rise in the sales price of new single-family homes since the first quarter of 2021. The increase shown in the graphic below is on an annual basis, and compares the median sale prices of homes that were sold within the given period. The steepest rise in this segment of the market was in the third quarter of 2021, when prices soared by almost 22% to $411,200 from the same period in 2020, which showed a median sale price of $337,500.
The higher mortgage rates seem to be cooling off the upsurge, however – while the rise in prices in the first two quarters of 2022 was around 17%, the third quarter saw a lower increase of 10.63% – from $411,200 in Q3 2021, the median price rose to $454,900 in Q3 2022.
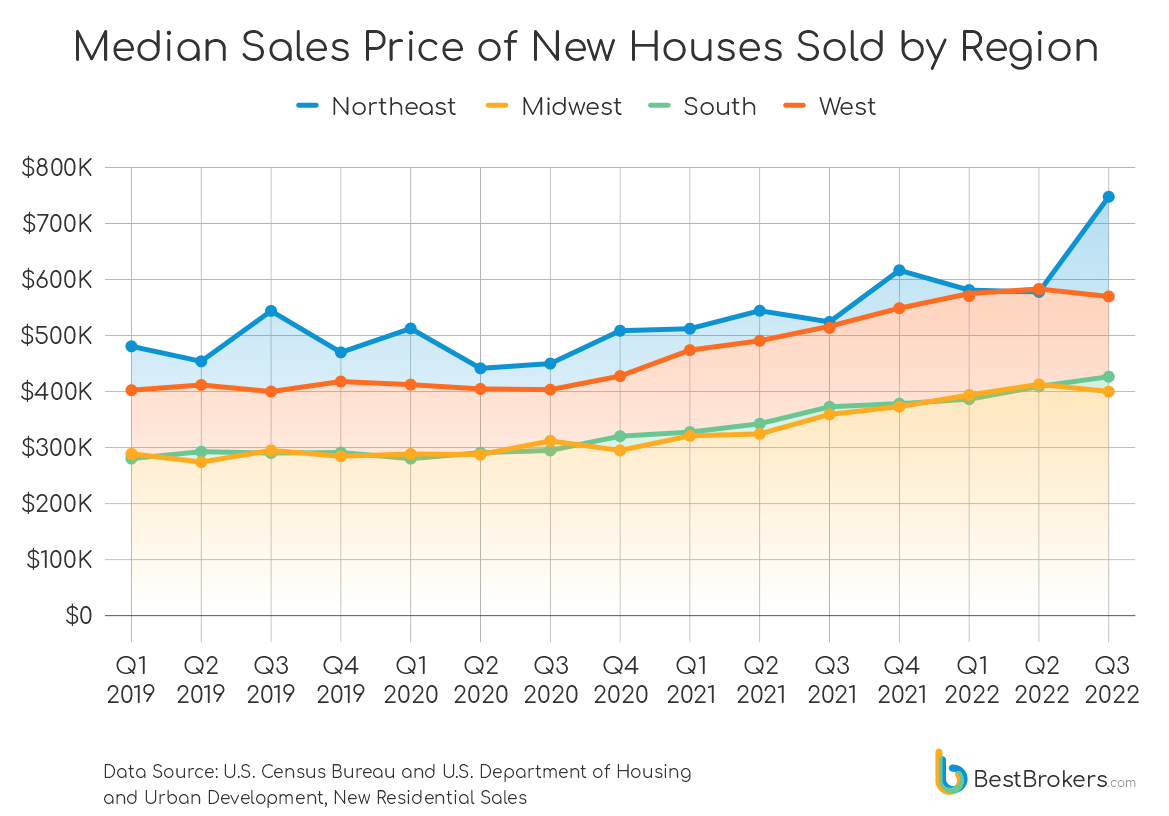
The increase in housing prices varies significantly across the country, however. The Northeast remains the hottest market, where homes are now much more expensive than they were last year. Statistics show that the median price in Q3 of 2022 surged 42.61% from the same period in 2021 to $747,000 – this is an appreciation of more than $223,000 within just a year, and nearly $170,000 from the previous quarter of this year.
Homes in the Midwest, on other hand, are the cheapest, and their prices only increased by 11.43% year-over-year to $399,800 in Q3 of 2022. Compared to Q2 of 2022 when the median price was $412,500, this was a drop of 3.08%. Prices in the West also fell from the second quarter of this year – down 2.3% to $569,200. Still, they increased 10.31% year-over-year.
September 2022 sales numbers plunge 17.6% YoY
Compared to just a couple of years ago, fewer people are now willing to invest their savings and commit to high-cost mortgages in order to purchase a home. Data from the U.S. Census Bureau and the U.S. Department of Housing and Urban Development shows that fewer homes were sold in September compared to the same period last year. A total of 603,000 new houses were sold this September, down 17.6% from September 2021, when around 732,000 new units were sold.
| Period | Percent change in new houses sold (computed using unrounded data) | New Houses for Sale at End of Period | ||||
|---|---|---|---|---|---|---|
| United States | Northeast | Midwest | South | West | ||
| Sep. 2022 from Aug. 2022 | -10.90% | 56.00% | 4.30% | -20.20% | -0.70% | 1.10% |
| Sep. 2022 from Sep. 2021 | -17.60% | 25.80% | 10.60% | -19.30% | -30.40% | 23.20% |
3% Drop in Prices in November, Decline Likely to Continue in 2023
According to data from the U.S. Census Bureau and the U.S. Department of Housing and Urban Development, homebuyers paid an average of $448,075 for a new, single-family house in the past twelve months through November 2022. This is up 14.82% from the $390,242 paid during the previous period (January 2020 to November 2021). Prices peaked in October, reaching an all-time high of $484,700 for that segment, while in November, they declined nearly 3% to $471,200. Still, compared to November 2021, this was an increase of 9.5%.
Data from Freddie Mac for the 30-year fixed rate mortgage average shows that mortgages increased to 20-year record levels in late October and November. From 7.08 in the second week of November, the average mortgage rate fell to 6.27 in the third week of December. At the same time, sales of new single‐family houses rose slightly to seasonally adjusted annual rate of 605,000 in October and to 640,000 in November. Although the November figures show a monthly increase of 5.8%, this is still 15.3% below the units sold in November of 2021.
“The housing market boom that started during the Covid-19 pandemic drove prices to record-high levels but the rising interest rates made mortgages more expensive for new buyers, which led to a dramatic decline in sales in the fall. Prices also dropped in November and are expected to fall even further in the coming months, even though not as much as they did during the 2008 market crash. In 2023, the U.S. housing market is likely to cool, although within the new house segment, the drop would probably be less significant than what we will see with the prices of existing homes.”
– comments Alan Goldberg, an analyst at BestBrokers.
The rapidly growing mortgage rates in the second half of the year put a stop on the overheating housing market. Price growth slowed down along with sales and most experts and market analysts expect that the cooling off will continue in 2023, as well. A market crash is unlikely, according to projections but many factors, including inflation rates and possible further Federal Reserve action, will weigh in. The seventh rate hike this year was on December 14 when the Fed raised interest rates by another 0.5 points.
Housing Affordability Index
There are a number of affordability indexes, all of which are used to assess whether people can afford to purchase a certain item. When it comes to purchasing a home, multiple factors affect buyers’ ability to pay for the property they want. The team at BestBrokers created a Housing Affordability Index modeled after similar indexes, but with a couple of different features. It measures whether a typical family in the US has sufficient income to qualify for a mortgage loan. Moreover, it measures whether a family can afford the monthly housing costs without putting too much strain on the family budget.
We compare the median income of a family (earning the median family income as reported by the U.S. Bureau of the Census) to the income which lenders require of households. Typically, the qualifying income is at least twice the monthly income of a person – banks calculate buyers’ income for mortgage qualification in various ways, depending on credit score, income during the past two years, location, and others. For this index, we calculated the qualifying income based on the notion that the monthly housing costs should not be more than 25% of the total income a family earns per month.
The index is shown as a ratio where 1.0 means that families earn just enough to be able to cover the monthly payments associated with purchasing a new home. If the index is higher than 1, then families earn more than they need to pay the mortgage, while if the number is below 1, it indicates that families can’t afford to purchase a new home.
Methodology
The team at BestBrokers used data from the U.S. Census Bureau and the U.S. Department of Housing and Urban Development for the number of homes sold and the median price of new single-family homes. The loans used for the index are 30-year fixed mortgages with a 20% down payment, while the interest rates were taken from Freddie Mac, 30-Year Fixed Rate Mortgage Average in the United States (FRED, Federal Reserve Economic Data).
In order to calculate the monthly payments, we used the Bankrate mortgage calculator. Along with the principal and interest, the monthly payments include property tax and home insurance. However, both vary significantly within states and counties, which is why we used national average rates. According to WalletHub and Census Bureau data, the average American pays $2,471 in property taxes each year, amounting to $206 per month. Bankrate data shows that the national average cost of home insurance is $1,383 per year for $250,000 in dwelling coverage, or $115.25 per month.
Lastly, we used data for the median family income from the U.S. Bureau of the Census, but as it does not provide figures for 2022, we calculated the index ratio based on 2021 data.