


 Richard Perry is a Financial Research and Platform Testing Analyst at BestBrokers.com, specialising in technical analysis, market strategy and the evaluation of trading platforms across forex, stock, cryptocurrency, CFD, gold and Bitcoin markets.
Fundamental analysis encompasses the whole study of underlying factors that tend to influence a particular economy. It relates to the entire methodology, which aims to determine future price action and market trends through analysis of a range of macroeconomic indicators, policies of governments and central banks, society-linked factors, as well as force majeure events (natural disasters, war, and so on).
Fundamental analysis is one of the two distinct schools of analysis of market conditions, with the other being technical analysis. Still, we should note that market participants cannot necessarily define themselves as pure fundamentalists or pure technicians. Fundamental traders will have to track from time to time signals generated from sole price action. Technicians will not be able to completely ignore macro data, important political developments, or social issues that could trigger substantial price fluctuations.
Why do traders employ fundamental analysis?
Fundamental analysis tends to be quite precise in forecasting economic conditions as a whole, but it is not precise in price level forecasting. If a fundamentalist examines the preliminary expert estimate concerning the US GDP or Non-Farm Payrolls data, he/she may find it difficult to obtain at once a clear picture of overall economic health and all the key factors that have contributed to it. Or, he/she may require a precise method to translate all the macro data into a trading strategy (with timely points of entry and exit).
Fundamental traders will usually build a model, which includes a set of empirical data. The main objective is to forecast market movement and to determine future exchange rates (or prices) of forex pairs (or Stocks) by employing a string of historical values of macroeconomic (or corporate) indicators.
The information obtained is then used to derive trades. Forecasting models can vary quite a lot, just as the fundamentalists who build them. The reason for that lies in the fact that different people will look into the same data set from a different perspective. As a result, they will draw different conclusions about the way the data could affect the market. Therefore, if one is to connect all the dots and get the bigger picture, he/she will need to thoroughly study every key fundamental indicator.

Just like the case with the stock market, forex fundamental analysis aims to determine the true (fundamental) value of a given currency. To do so, fundamental traders examine a spectrum of economic and non-economic events.
All the political and social news, as well as the economic data, released from a particular country (or region) are similar to corporate events and news in that the information helps traders and analysts to form a notion of value.
In the current guide, we shall focus mostly on the key fundamental factors that tend to influence the Foreign Exchange market in both the short-term and long-term, their interpretation and how they are related, and, additionally, we shall provide a brief overview of stock market fundamentals.
What factors do influence the Foreign Exchange market in the long term?
Capital Flows
Capital flows and trade flows account for the balance of payments of a particular country. And the balance of payments is very tightly related to demand for the particular currency over a specific stretch of time. When a country’s balance of payments equals zero, this suggests the country’s currency will retain its current valuation. And when the balance of payments has a positive value, this suggests capital inflows into the economy are faster than capital outflows; thus, the country’s currency should increase in value.
Meanwhile, capital flow as an indicator reflects the net amount of a particular currency that is bought or sold by investors. In case a country has a positive capital flow balance, this indicates that inflows of physical or portfolio investments from abroad exceed outflows from the country’s economy. And if the country has a negative capital flow balance, this indicates physical or portfolio investments held by foreign investors are lower compared to those held by domestic investors.
Physical investment flows comprise foreign direct investments by enterprises that operate in various economic sectors (real estate, manufacturing, retail trade, etc.) as well as of business activities such as domestic corporate acquisitions. To make such investments, foreign enterprises need to buy the domestic currency and sell the foreign currency, or these activities induce movement in the forex market.
We can say physical investment flows are indicative of actual investment activity. It is so because these flows will go through certain alterations whenever there are changes in the economic growth prospects and financial state of the particular country. Physical investment flows are also heavily influenced by changes in domestic legislation that aim to stimulate foreign investments.

At the same time, portfolio investment flows are related to inflows and outflows of capital in a given country’s equity and fixed income markets. A rally in the equity market of a given country will usually attract investors from any geographic region of the globe due to the stunning technological progress that enables the movement of capital with ease. As a result, there is a considerable correlation between a particular country’s equity market and its local currency:
- If the country’s stock market is in a strong bull trend, there will be higher demand for the local currency, because retail and institutional investors will not want to miss the opportunity to generate profits.
- If the country’s stock market is in a bear trend, domestic investors will look to sell shares of public companies and invest their capital in other markets abroad.
Bond markets are also quite tightly correlated to the foreign exchange market. Investors tend to increase their holdings of fixed income assets during periods of economic or political uncertainty because of those assets’ inherent safety. Countries that offer the most lucrative fixed income opportunities will logically attract foreign investments, while the latter will require the purchase of the domestic currency.
Short-term and long-term government bond yields globally are generally used to gauge capital flows in fixed income markets. The spread differentials between 10-year US government bond yields and 10-year bond yields elsewhere are closely watched by investors. They will always look to invest their capital in those countries that offer the highest-yielding assets.
For instance, if Australian bonds have one of the highest yields globally, they would attract more investments from abroad. As a result, the Australian Dollar will also gain in value due to higher demand.
Forex traders who keep track of the short-term flow of funds will pay attention to spread differentials between 2-year government bonds of particular countries. Federal funds futures serve as another valuable gauge of US funds movement. It is so because they reflect investor expectations in regard to the Federal Reserve’s future interest rate policy.
Trade Flows
Trade flows are tightly related to the net trade balance of a particular country. Nations can be either net exporters or net importers.
- Net Exporters: Net exporters are those countries whose exports to international customers exceed imports from foreign producers. Generally, those countries generate a net trade surplus. As a result, there is a higher chance for the currencies of those countries to gain in value, because they are being bought more than they are being sold. International clients who intend to purchase the exported goods or services will need to purchase the currency of the net-exporting country first. Thus, demand for that particular currency will likely increase.
- Net Importers: Net importers are those countries whose exports to international customers are lower than imports from foreign producers. Generally, those countries generate a net trade deficit. Therefore, there is a higher chance for the currencies of those countries to depreciate, because they are being sold more than they are being bought. Import enterprises will need to sell the domestic currency first and then purchase the currency of the foreign producer. As a result, demand for the currency of the net-importing country will likely diminish.
Let us consider the following example. The Swiss economy is faring well, and the local stock market is in a bull trend. Meanwhile, the US economy is not offering sufficient investment opportunities. In this case, US residents will look to sell US dollars and buy Swiss francs, as they will be willing to take advantage of the Swiss stock market boom. So, we may observe a capital outflow from the United States and a capital inflow into Swiss assets. From the forex market perspective, such a scenario will cause the US dollar to lose value and the Swiss franc to appreciate, as demand for dollars decreases and demand for francs increases. Thus, the USD/CHF currency pair will likely depreciate.
To sum it all up, every international transaction leads to two offsetting entries:
- capital flow balance (capital account)
- trade flow balance (current account)
The two entries represent the balance of payments of countries. In theory, they should balance and add up to zero so that the status quo in a particular economy and currency exchange rates is maintained. Every country may have either a positive or negative balance of trade, as well as a positive or negative capital flow balance. In order to minimize the net effect by both major factors on its currency exchange rates, the country must balance those factors.
Let us consider another example. The US has had a significant trade deficit recently, because its imports were higher than its exports. Thus, the country must fund this deficit.
A negative trade flow may be offset by a positive capital flow, since international investors make real or portfolio investments. Generally, the country will seek to reduce its trade balance deficit as much as possible and to maximize its capital inflow until they balance out. The net difference between the country’s trade flow and capital flow will usually affect its currency’s valuation (whether it will appreciate or depreciate).
In case the US overall balance tends to be negative, the US dollar will likely lose value. And if the overall balance is positive, the US currency will likely surge.
Any change in the balance of payments of a given country will directly affect its currency’s exchange rates. So, investors will usually watch economic reports related to the balance of payments closely and interpret the potential outcome on their own. If a country’s trade balance deficit increases and its capital flow decreases, this will generate a deficit on its balance of payments. Consequently, investors should anticipate that country’s currency to devalue.
The Theory of Purchasing Power Parity
It is a theory that assumes currency exchange rates should be valued by the relative prices of a given basket of goods and services between two countries. A change in a country’s inflation rate should be balanced by a change in the opposite direction in that country’s currency exchange rate. If consumer prices in a given country are rising due to inflation, then its currency’s exchange rate should devalue (so that parity is restored).
The basket of goods and services will usually encompass all goods and services that are covered by the Gross Domestic Product of the given country. The basket may include consumer goods and services, equipment goods, government services, etc. Consumer goods and services include food and drinks, clothing and footwear, tobacco, rents, fuel, water and gas supply, medical goods and services, transport services, education services, recreational and cultural services, etc.
The Economist magazine’s Big Mac Index is one of the popular examples related to Purchasing Power Parity (PPP). According to the proposed forecast method, the exchange rate between two currencies should adjust in such a way that a sample basket of goods and services should cost an equal amount in both currencies. The sample basket includes one McDonald’s Big Mac burger.
The PPP exchange rate between two national currencies can be calculated by dividing the price of one Big Mac in the currency of the first country by the price of one burger in the currency of the second country. The result will then be compared to the current currency exchange rate. If the resulting value is lower, this means the first currency is undervalued compared to the second currency. And if the resulting value is higher, this means the first currency is overvalued compared to the second currency.
In case one Big Mac burger costs USD 4.58 in the United States in January 2014 and GBP 3.42 in the United Kingdom, then the implied PPP can be calculated the following way: 4.58/3.42 = 1.34. So, the parity was USD 1.34 to GBP 1. The GBP/USD exchange rate back then was USD 1.6454 for 1 GBP. If we compare the two values, we will have the following result: (1.6454 – 1.34)/1.34 * 100 = 22.79%. Or, the GBP/USD exchange rate was overvalued by 22.79%.
A more formal PPP Index is published by the Organization for Economic Cooperation and Development and Eurostat. On the OECD website (www.oecd.com), one can find data about whether a given national currency is undervalued or overvalued against the United States Dollar. In a table form, one can find price data for all industrialized nations. The table visualizes the number of monetary units required in every country to buy one and the same basket of consumer goods and services.
We should note that the PPP theory should be applied for long-term fundamental analysis only, as, at some point (within 5-10 years), the PPP forces will equalize the purchasing power of currencies. Another drawback is that the theory assumes goods are traded with no constraints, and it also does not consider any taxes or import tariffs.
The Theory of Interest Rate Parity
This is a theory that postulates that if two different currencies are associated with different interest rates, then the difference will cause either a discount or a premium for the exchange rate, so that arbitrage opportunities in the market cannot occur.
Let us consider a situation where interest rates in Australia are at 1.25%, while interest rates in Japan are at 0.25%. The Australian dollar will have to depreciate 1% against the Japanese Yen in order to avoid arbitrage opportunities. The future exchange rate of the AUD/JPY pair is reflected in the forward exchange rate, which is known today. The forward exchange rate of the Australian Dollar is at a discount, because it buys fewer Japanese yen in the forward rate compared to those bought in the spot rate. And, the forward exchange rate of the Japanese yen is at a premium.
Yet, over the past decade, there has been quite little proof that the interest rate parity theory is working. In countries where interest rates are high, currencies appreciate, because the respective central bank aims to cool an overheating economy by hiking rates. Thus, the effect on currencies has nothing to do with arbitrage.
What factors do influence the Foreign Exchange market in the short term?
Short-term moves in the forex market are usually influenced by the release of key macro data from major economies worldwide. Usually, both fundamentalists and technicians tend to pay close attention to those data prints.
Since important macroeconomic reports induce high volatility and lead to sudden and wide spikes in prices, technicians who favor range trading will usually not take any action at the time around the data release. At the same time, technical breakout traders will usually favor such market conditions while taking advantage of the high volatility and large price swings.
Generally, the economic reports released from the United States tend to have the most considerable impact on forex pairs. It is so because of the US dollar’s status as a reserve currency and the United States’ status as the biggest economy worldwide. The US is also a major importer and exporter of a range of items, such as finished products, raw materials, as well as a range of services.
Labor market indicators
Some US macroeconomic indicators may impact the market to such an extent that shifts in sentiment could last for days or even weeks. Other data prints may be of little or no importance to investors.
Over the years, the US Non-Farm Payrolls report has become the economic indicator of utmost importance. It tends to induce very high volatility not only in currency pairs but in other market segments as well, because it is indicative of the US labor market strength and the rate of economic recovery.
US labor market health has not once been tied to the Federal Reserve’s bond-purchasing programs, aimed to stimulate recovery. Higher job creation rates are positively correlated with consumer spending and retail sales, and they usually prompt tighter monetary policies. On the other hand, a struggling labor market would undermine consumer sentiment and overall economic activity, which would increase the need for a more accommodative monetary policy (resulting in currency depreciation).
Purchasing Managers’ Indexes
Other key macroeconomic reports include the ISM Manufacturing and Non-Manufacturing surveys on business activity. Those data prints released by the Institute for Supply Management (ISM) tend to be more closely watched by investors than the similar reports by S&P Global (the US Manufacturing Purchasing Managers’ Index and Services Purchasing Managers’ Index).
We should note that the Non-Manufacturing report has a more notable impact on forex pairs’ daily price movement, because the services sector accounts for nearly 80% of the US Gross Domestic Product, while the industrial segment – for about 19%. Another interesting tendency is that the Non-Manufacturing report causes a more muted impact on the market right after it is published, but it triggers considerable movement on a daily basis.
Both reports by the ISM include a number of underlying components that require more time to be examined, so that investors can assume what the Federal Reserve’s policy decision may be based on those data prints. Both ISM reports also include a closely watched employment component that ensures a preliminary insight into the US labor market before the release of the Non-Farm Payrolls report. Therefore, it is considered a leading indicator.
Over the past several decades, some indicators have seen an increase in their significance due to shifts in the state of the US economy, while the importance of others has decreased drastically. In the 1990s, one of the most notable market-moving indicators was the US trade balance report. Currently, however, it is not among the top 10 by significance.
The trade balance report may be closely watched if a country is recording persistently large trade deficits. Yet, with the change in macroeconomic conditions, market focus will shift to different data prints that are more indicative of the pace of economic recovery.
In the years after the 2008-2009 financial crisis, the Federal Reserve tied the scale-back of its monthly asset purchases to US labor market health. Even as the central bank started to reduce quantitative easing, FOMC members pledged to maintain interest rates at all-time low levels until the rate of unemployment drops to a sustainable low level. That is the reason why consumer sentiment indicators also have a sizable effect on the US dollar. They are leading indicators pointing to household spending trends.
Central banks’ monetary policy and its impact on the Forex market
The course of monetary policy, which a particular central bank adopts, is one of the key factors that forex fundamental analysts and traders take into consideration. Every country’s central bank functions as a monetary authority, whose ultimate objectives are ensuring price stability in the economy and controlling the money supply through monetary policy tools. Every central bank aims to achieve and maintain equilibrium between economic growth and the inflation rate in the country whose financial system it oversees. Along with price stability, a central bank will always seek to ensure stable economic growth.
Monetary policy represents the entire process of controlling the money supply, the availability of money, and the cost of money (borrowing costs, or interest rates), so that a central bank can achieve its objectives. Monetary policy is all about the relationship between interest rates in the economy and the total money supply.
If a central bank decides to expand the money supply, then there will be more money available for investing and spending. As a result, the nation’s economic growth will be supported, since business investments and household spending are two key driving forces behind GDP growth.
Still, if the money supply is expanded too fast and way too much, this will immediately induce high inflation in the economy and potentially hamper economic stability. A high rate of inflation will undermine the purchasing power of the domestic currency. On the other hand, if the central bank contracts the money supply way too much, this will suppress the rate of inflation, but it will also cause economic growth to decelerate.
In an attempt to ensure a balance between healthy economic growth and a reasonable inflation rate, a central bank will stick to two types of monetary policy: expansive and contractionary.
Accommodative (expansive) monetary policy
When a central bank implements an accommodative monetary policy, it will expand the money supply. As a result, business investments and consumer spending will increase due to lower borrowing costs (interest rates), which will in turn stimulate economic growth.
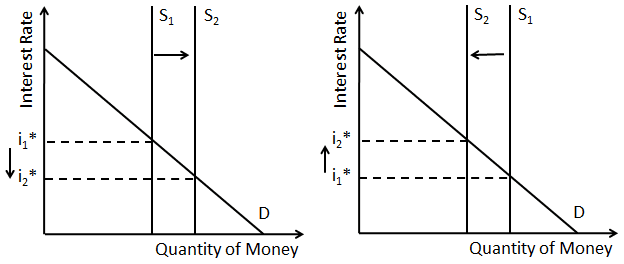
Such a policy, however, will have additional effects since it translates into lower real interest rates:
- The country’s financial and capital assets will become less attractive to investors due to their lower real rates of return. Or, international investors may reduce their portfolios of local bonds, real estate, equities, and other asset classes.
- Consequently, the country’s capital account balance could deteriorate, since foreign investors will be holding fewer local assets.
- Additionally, local investors will likely cut investments in their home country as well and seek more appealing rates of return abroad. Or, they will contribute to the capital account balance of another country.
All in all, lower investment activity in the local markets will likely cut demand for the local currency and increase demand for the currency of the foreign country. Therefore, the local currency will likely devalue.
An accommodative monetary policy may also increase the possibility of high inflation. The latter may be the result of the larger amount of capital available within the economy, and it would make the local currency less valuable.
We can say that when an accommodative monetary policy is implemented, it tends to weaken the national currency.
Restrictive (contractionary) monetary policy
When a central bank implements a restrictive monetary policy, it will reduce the money supply. To do so, the bank will usually raise interest rates. Such a move will restrict the ability of households and businesses to borrow due to the higher borrowing costs.
Since borrowing is restricted, businesses will tend to invest less and households will tend to spend less, which will reduce demand for goods and services. Because those two key economic subjects tend to be less active, the country’s economic growth is likely to begin decelerating. Still, higher interest rates and lower demand will probably ease inflationary pressure.
Again, such a policy will have additional effects. A restrictive policy translates into higher real interest rates. Because of this, the country’s financial and capital assets will become more attractive to investors due to their higher real rates of return. Or, international investors will likely expand their portfolio of local bonds, real estate, equities, and other asset classes. Consequently, the country’s capital account balance will improve, since foreign investors will be holding more local assets.
Additionally, local investors may increase investments in their home country as well. All in all, higher investment activity in the local markets could increase demand for the local currency. Therefore, the local currency will likely appreciate.
We can say that when a restrictive monetary policy is implemented, it tends to support the national currency.
What are central banks’ policy decisions usually based on?
Every central bank uses breakeven figures for key macroeconomic indicators (such as inflation rate, unemployment rate, GDP etc.), which are evaluated in line with its own methodology. Those figures will usually be compared with the so-called “preferable values”. If some of those indicators reach a breakeven number or start changing together in one direction or another, forming a certain trend in the economy, this may be an indication for the central bank that monetary policy adjustments are required.
For example, there are acceptable levels or ranges within which the rate of inflation should fluctuate. The Federal Reserve and the European Central Bank have set a target for the annual inflation rate at 2%. This target equals a healthy inflation rate that ensures price stability and facilitates moderate economic growth.
If the actual inflation rate tends to remain well below the inflation target, this is indicative of a suppressed inflationary pressure. Therefore, the central bank will likely continue implementing an accommodative monetary policy.
In 2022, as a tool used to combat inflation, the Federal Reserve started increasing interest rates. As a result, the US dollar became an attractive investment option as it led to better yields on dollar-denominated assets. Forex traders who relied on fundamental analysis to keep track of interest rates and the Fed’s decisions were anticipating a stronger US dollar.
By September 2022, the US Dollar Index (DXY) reached a 20-year high. Meanwhile, major currency pairs like the EUR/USD experienced a massive decline from around 1.13 in early 2022 to below 0.96 by the end of the same year. Those who utilized fundamental analysis were able to profit from taking long positions on the US dollar and going short on weaker currencies.
Central banks usually make adjustments to their policy gradually, taking small steps at a time. This way, economic stability will remain intact, and central banks will be able to observe to what extent the adjustments will affect economic activity. Banks will usually adjust their benchmark interest rate at a pace of 0.25% to 0.50%, while the cycles of increasing and reducing the rates may last between 1 and 3 years. Rate adjustments to the downside are usually implemented at a faster pace – 0.25% to 1.00%.
Now, let us take a closer look at the relation between interest rates and the inflation rate.
How are interest rates and inflation related?
The interest rate represents the amount of interest, which a borrower must pay to a lender for the right to use the funds borrowed. It is usually determined by central banks. Meanwhile, the rate of inflation represents the rate at which prices paid for goods and services increase.
Let us consider the following example. The overall price level of goods and services available in a particular market surged 4% during the last 12 months. A household spent $4,000 during the first month to cover all expenses, and now it needs to budget $4,160 during the last month for the same quantity of products and services.
Individual products may have risen in cost at a different rate, and some items may have even become cheaper, but overall, the household needs to ensure $160 more every month now. If it does not manage to increase its monthly income after taxes by that amount, then it will need to save less, buy cheaper items, or borrow money.
There is a difference between nominal and real interest rates. The nominal interest rate is the rate that your domestic bank offers. If you have a deposit account, the nominal interest rate will reflect the pace at which the amount of funds in that account will increase over time. The real interest rate will correct the nominal interest rate for the effect of inflation. It reflects how much the purchasing power of your deposit account will increase over time.
The Fisher Effect
According to Irving Fisher, real interest rates are independent of monetary measures. The so-called Fisher Effect can be presented via the following equation:
r = i – π, where
– r equals the real interest rate,
– i equals the nominal interest rate,
– π equals the rate of inflation.
In case you are paid 2.5% in annual interest on your deposit account, but the overall price level increases 1.5% during the year due to inflation, then, although you have 2.5% more funds in your account, you have only 1% more purchasing power.
It becomes evident that if real interest rates remain constant, a surge in the rate of inflation must trigger an equal surge in the nominal interest rate. The Fisher Effect provides proof that entirely monetary developments will not affect relative prices in a country in the long term.
What are other methods that can control the money supply?
Along with interest rates, central banks can utilize two more tools to control the money supply in an economy – making changes to the reserve requirements of banks and conducting open market operations.
Reserve requirements
This is a tool, which central banks worldwide use to obligate commercial banks under their supervision to hold a particular amount of client deposits and notes as a reserve. The latter can be physically stored as cash in bank vaults or held as deposits with central banks. The amount of client deposits held as a reserve by commercial banks is known as a “reserve ratio”. Excessive reserves, or extra cash held above the minimum requirement, can also be maintained by banks.
The reserve requirements impact interest rates in a given country by expanding or contracting the amount of money available for commercial banks to lend to their clientele:
- If a central bank reduces the reserve requirement ratio, it actually increases the amount of available capital (that was held as a reserve) and facilitates bank lending expansion.
- If a central bank raises the reserve requirement ratio, it actually obligates commercial banks to lock-in capital (that could have been used for their lending operations). Therefore, the amount of money used as loans will be reduced.
If a commercial bank is obligated to maintain a larger amount of money as a reserve, it will be forced to raise interest rates (to charge more on loans). This way access to bank credit will become more expensive and, in general, will cut lending growth and economic activity.
On the other hand, higher interest rates will benefit depositors, as they will earn more on the amount they park in bank accounts. In such a case, the local currency will likely appreciate, as more foreign investors will be willing to take advantage of higher rates of return. Since they will need to purchase the domestic currency, higher demand will cause its value to increase.
Conversely, if the reserve requirement ratio is reduced, it will free up liquidity, expand lending activity and push interest rates down. As a result, foreign investment flows will likely diminish and, ultimately, the local currency will likely lose value due to lower demand.
Central banks will usually avoid changing the reserve requirements for commercial banks, because such shifts will have a considerable impact on their ability to lend. Higher minimum reserve requirements may harm smaller banks and those having low excessive reserves.
Open Market Operations
These are activities such as purchases or sales of debt instruments (Treasury bonds, bills or notes) conducted by central banks to influence certain aspects of the economy by increasing or decreasing the money supply. Open market operations directly influence fundamental factors such as currency exchange rates, employment and so on. These activities tend to be closely watched by fundamental analysts and traders, as they impact liquidity in the forex market.
In the United States, the Federal Reserve’s Federal Open Market Committee (FOMC) implements monetary policy. It conducts policy meetings 8 times each year in order to assess current economic conditions, provide guidance for the future and decide whether to expand or reduce the money supply.
If the FOMC aims to expand the money supply, it will purchase securities from commercial banks. The acquired money can then be used by banks to provide loans to individuals and businesses.
As lending activity increases, the interest rates on loans will likely decrease and attract more borrowers. This cheaper access to capital will likely bolster investment activity and, as a result, spur economic growth. In the years after the 2008 financial crisis, the Federal Reserve was injecting money into the economy through monthly bond purchases in order to stimulate growth.
Conversely, if the FOMC aims to reduce the money supply, it will sell securities to commercial banks. This way the available money for lending purposes will decrease and interest rates will likely increase. Since access to capital becomes more expensive, investment activity will likely decelerate and, as a result, economic growth may also slow down.
How are central banks’ policy decisions usually announced?
Every statement by a central bank’s Chairman (or President, or Governor) during a regular or special testimony tends to trigger considerable movement in the forex market. Traders will usually look for any clues whether the current monetary policy stance may be maintained, or some adjustments may be introduced.
Central banks tend to maintain very well-organized communication with investors: they have a publicly disclosed schedule of policy meetings, speeches by bank officials, and so on. Central banks present their policy statements in such a way that international corporations and large investment or commercial banks appoint a highly qualified analyst to transcribe those statements into normal language. This way, major players in the market aim to clarify a central bank’s intentions. As for retail traders, it is best if they stick with larger market participants and follow their actions, because those investors may have managed to decipher the central banks’ announcements.
Central banks never offer straightforward statements because they do not yet know how economies will react to their decisions and what trends macro data may show. In case a central bank announces an interest rate hike today, but tomorrow a government agency releases a weak set of macroeconomic data, then bank officials would be prompted to say they will abstain from taking action on policy.
Policy makers must be fully aware of perspectives. They will usually prepare the financial world for a gradual change by altering the tone of their statements.
Those new to financial markets must also keep in mind the high volatility that usually occurs during a central bank’s policy announcement. If the bank’s policy decision or statement largely surprises investors, this could cause substantial movement in the forex market.
A central bank can always change its view on economic perspectives and always revise its forecasts on key macro data prints (employment, CPI inflation, consumer sentiment, retail sales, GDP, etc.). During such announcements, inexperienced traders should use extra caution, strictly manage their risk exposure on current positions, and reassess whether to open new trades.
Central banks can also take actions known as verbal interventions. The latter are remarks by bank officials that can be interpreted by markets either as supporting or as weakening a particular currency. Sometimes speculations among investors mount that a certain policy action is likely to be taken by a certain central bank. The bank itself may use verbal interventions in the market to suppress such speculations.
In other cases, verbal interventions can be used by banks to deliberately adjust the exchange rate of the local currency. This is particularly valid when the exchange rate is not in unison with a central bank’s specific objectives.
History has shown, for example, that the Governor of the Reserve Bank of Australia intervened in the market by saying the bank was aiming at a weaker national currency to support the process of economic re-balancing due to the fading investment boom in Australia’s mining industry. Such a statement is quite likely to lead to lower demand for the Australian dollar.
Consumer Price Index as an indicator
In the United States, the CPI report is published on a monthly basis by the Bureau of Labor Statistics and is based on a basket of 80,000 consumer goods and services. The CPI tracks prices of frequently bought items mostly by urban households (about 87% of the total US population). The general index takes into account sales taxes, but does not include income taxes and prices of investments (equities, bonds).
A more closely watched indicator is the core CPI, which excludes volatile categories such as prices of food and energy. This is the measure of inflation, which the Federal Reserve uses to examine and make adjustments to monetary policy.
Another indicator, published along with the core CPI, is the Chain-Weighted CPI. The latter better reflects actual consumer patterns compared to the general and the core CPI, as it considers the substitution and new product bias. In case consumers buy one item over another because of the higher price of the first item, the Chain-Weighted CPI will present this shift, unlike the core CPI.
The Consumer Price Index, as an indicator, has a predictive nature and tends to induce considerable volatility in both forex and stock markets – not only on the day of data release but also for 1-2 weeks ahead. The CPI report may provide clues about potential actions by central banks at their next policy meetings.
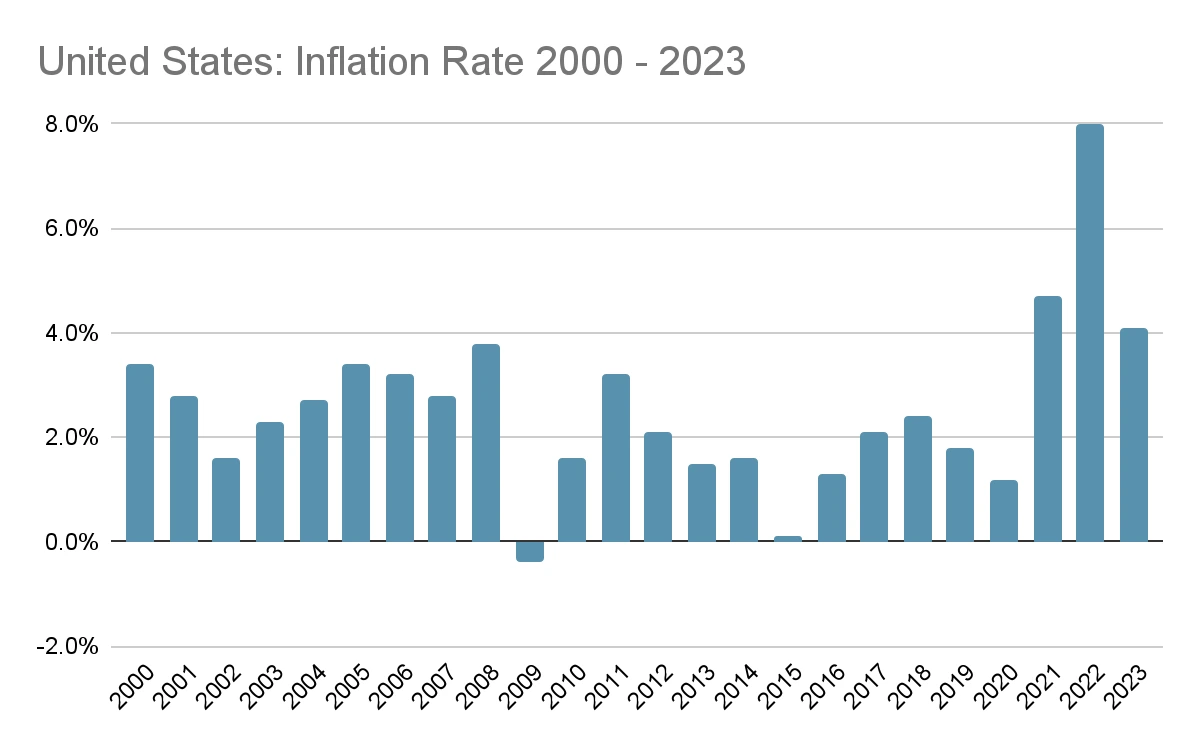
Data Source: U.S. Bureau of Labor Statistics
Within an expanding economy, a faster-than-expected rise in the annualized core CPI over a certain period (several months, for example) would tend to support the national currency, because consumer prices are approaching the central bank’s inflation target. It would also suggest that economic recovery is probably accelerating.
Still, quite high CPI inflation (well above the central bank’s inflation objective ensuring price stability) could harm the economy.
Within a sluggish economic environment, a slower-than-expected rise in the annualized core CPI over a certain period, this may indicate weak inflationary pressure and further need for an accommodative monetary policy to stimulate growth. In this case, the national currency will likely lose value.
Gross Domestic Product as an indicator
The Gross Domestic Product (GDP) is a major fundamental analysis indicator, which reflects the size of a given economy. The GDP indicates the total monetary value of all goods produced and services delivered by a particular nation over a certain period of time (quarter or year).
A healthy economic (GDP) growth is associated with strong wage growth and low unemployment, as companies seek labor to be able to respond to higher demand. If GDP growth changes considerably, in either direction, this will usually affect the local currency substantially.
Forex traders will usually look for higher rates of GDP growth in anticipation of higher interest rates. A strong growth rate translates into benefits for the consumer, or the likelihood to spend increases. Thus, the chances of a further economic expansion rise as well.
As consumer spending increases, it may induce inflation, which is very likely to be curbed by the central bank via an interest rate hike. This is especially valid if consumer prices begin to rise at a faster rate than overall GDP growth.
In the United States, the GDP report is released by the Bureau of Economic Analysis in three versions – preliminary, revised (second estimate) and final. Experienced forex fundamental traders will always consider the relation between the separate figures, not just the individual reports.
The preliminary GDP figure is first taken into consideration, after which traders’ focus is set on the final report. If the final GDP figure points to 3.0% growth, for example, after the preliminary estimate came in at 4.5%, then positive sentiment and its effect on the forex market will likely be muted. And conversely, if the final GDP figure exceeds the preliminary estimate, the positive effect on the local currency will likely be substantial.
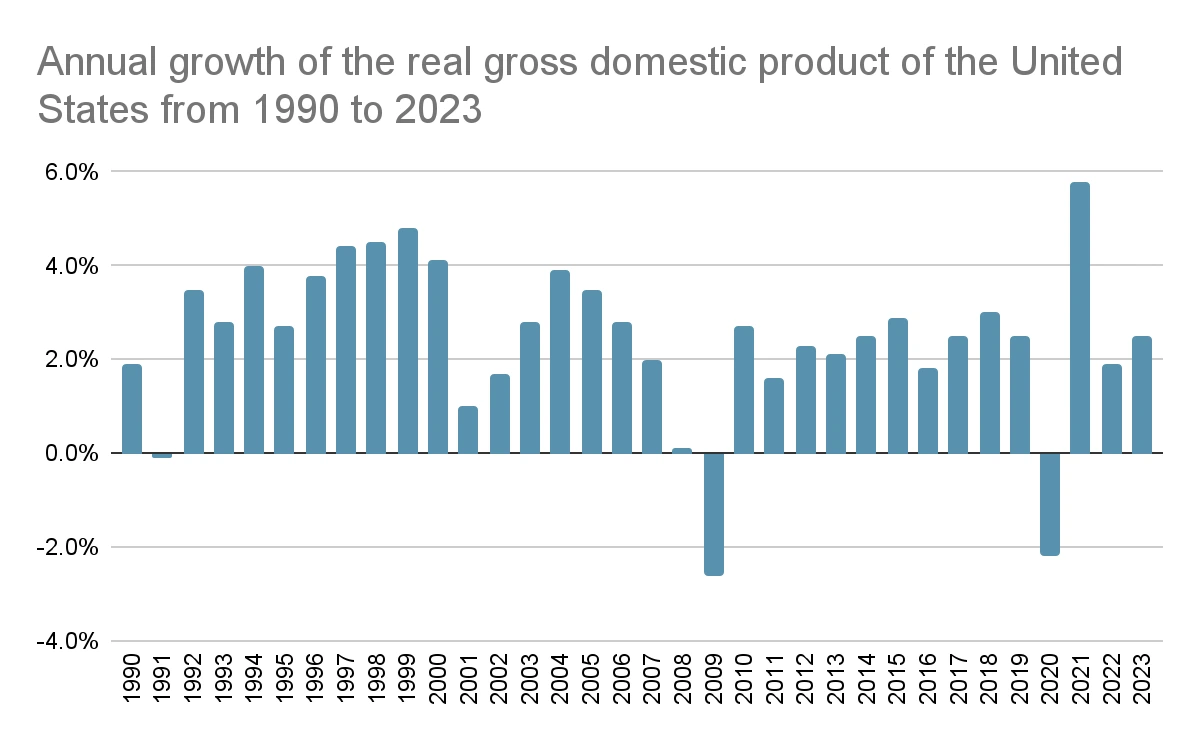
Source: Statista
There are three types of market reactions to the release of GDP numbers:
Local Currency Sell-Off
First, a GDP reading that falls short of market expectations (consensus of analyst estimates) will usually trigger a sell-off in the local currency against foreign currencies. A lower-than-expected UK GDP growth, for instance, would indicate a slowdown in economic activity and reduce the appeal of the British pound, because of the lower probability of an interest rate hike by the Bank of England. If you are monitoring the GBP/USD pair, you will probably see it losing value, as investors are likely selling the pound and buying the US dollar. The more the actual GDP reading differs from market consensus, the more notable the pound’s depreciation will be.
Mixed Market Sentiment
Second, a GDP reading that comes in line with market expectations will usually require some further analysis. If the preliminary and final GDP estimates match, traders will need to compare the actual figure with that of preceding quarters and even with figures from the respective period of the previous year. Yet, if analyzing the current situation this way, there may be different opinions among investors and, as a result, price action will be mixed, because the market will be sorting out the details.
Support of the Local Currency
Third, a GDP reading that exceeds market expectations will usually support the local currency against its peers. A faster-than-expected UK GDP growth will induce buying the pound and selling the US dollar, for instance, or the GBP/USD pair will likely gain value. The more the actual GDP reading differs from market consensus, the more notable the Pound’s advance will be.
Labor market fundamental indicators
A healthy labor market is a major driving force behind economic growth. Let us now discuss some of the key fundamentals that reflect the state of employment in the largest economy worldwide – the United States.
Non-farm Employment Change
This is a high-volatility macroeconomic indicator published on a monthly basis by the ADP Research Institute. It reflects the state of US non-farm private sector employment and is based on data covering 400,000 business clients from 19 major economic segments. This indicator is evaluated by using the same methodology, which the US Bureau of Labor Statistics uses.
Since it is released two days before the official government employment data, the ADP Non-farm Employment report serves as a precursor of the official government Non-Farm Payrolls report. A faster-than-expected growth in employment will usually be considered as a bullish signal for the US Dollar and vice versa.
Initial Jobless Claims
Published on a weekly basis, this indicator shows the number of people who filed for unemployment assistance for the first time during the preceding week. If the number of jobless claims tends to decrease, this is indicative of labor market strength, as fewer people have remained out of work during the tracked period. A larger-than-expected drop in claims or a reading that completely surprises market participants will usually induce high short-term volatility in currency pairs containing the US Dollar.
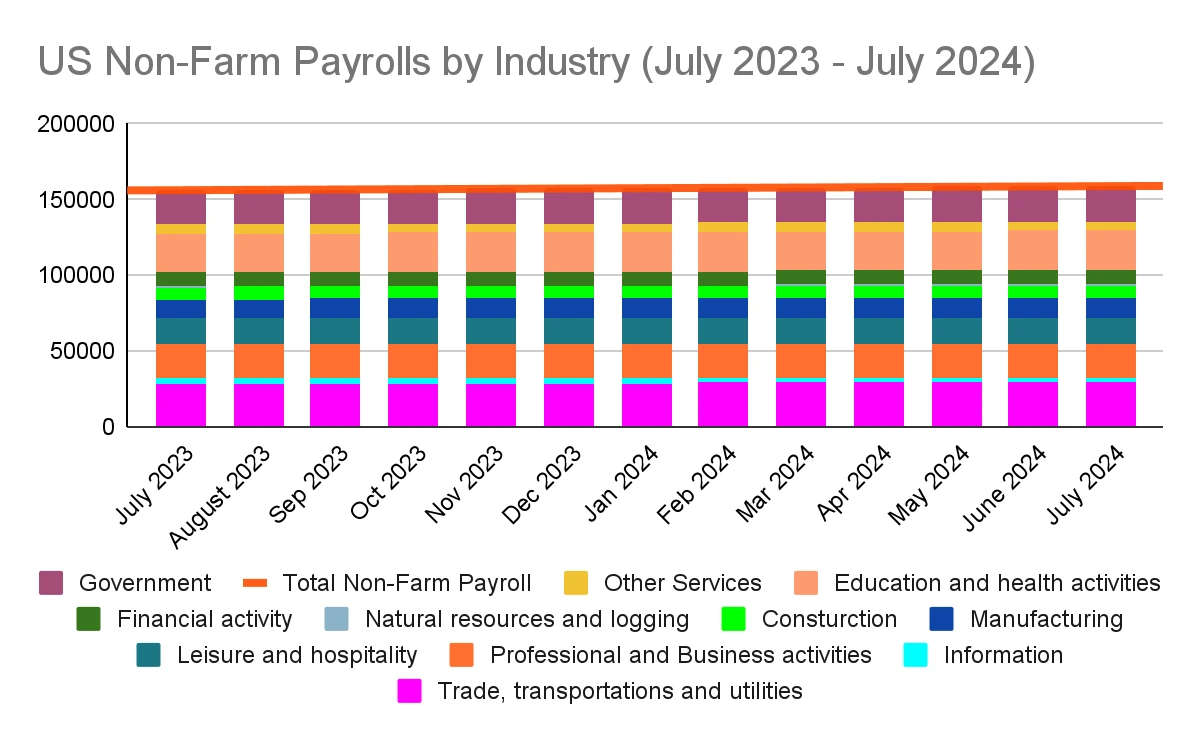
Non-farm Payrolls
This is the most essential and the most closely watched piece of macro data within the US Department of Labor’s Employment Situation report, published on the first Friday of every month. This indicator reflects the monthly change in non-farm payrolls – a higher figure suggests job growth in the tracked month compared to the prior period.
The indicator presents the total number of employees hired in all sectors of business, except the following groups: farm workers, non-profit organization employees, general government employees, and private household employees. Total non-farm payrolls represent 80% of employees who produce the entire US GDP.

Data Source: Federal ReserveBank of St, Louis
When the economy is faring well, the figure released will most frequently fall within the 50,000-300,000 range. A positive reading, especially if it far exceeds market consensus, tends to considerably bolster the US Dollar and vice versa.
Unemployment Rate
Reported every month, this indicator reflects the percentage of the total workforce that is not employed and is actively seeking work. A person is considered unemployed, if he/she belongs to all of the following groups: able bodied, not employed during the past week, he/she has been looking for employment for at least 4 weeks ending in the week of the research. Laid-off persons waiting to be hired again also belong to the group of the unemployed.
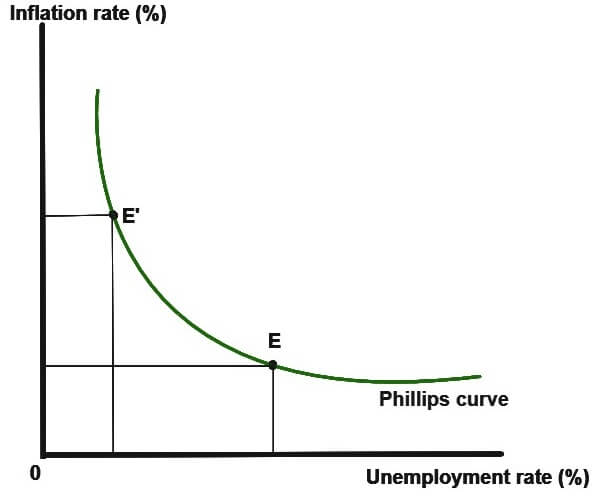
High unemployment rates are a threat to the economy, as they hamper consumer spending and the latter is a key driving force behind US GDP growth. A weak labor market also tends to undermine consumer sentiment, affecting actively working people. However, way too low unemployment rates are also undesired by governments, as they induce inflation and drive salaries up, which could lead to an overheating economy. Unemployment rates within the range 4%-6% are usually regarded as healthy. Inflation rate and unemployment rate are inversely related fundamental indicators, as is shown by the so-called “Phillips curve”.
Purchasing Managers’ Index (PMI)
The PMI is a timely fundamental indicator, which reflects sentiment in various segments of the economy – manufacturing, construction, and services. In the United States, the PMI report is released on the first business day of every month by the Institute for Supply Management, a non-profit organization with over 40,000 members. Similar indicators for Euro Area countries and the UK are published by the S&P Global research group.
The PMI represents a composite index consisting of several sub-indices, and it is based on surveys of over 400 purchasing managers who operate within the country. Each sub-index has a particular weighting:
- New client orders – 0.30
- Level of production – 0.25
- Level of employment – 0.20
- Supplier deliveries timing – 0.15
- Inventory level – 0.10.
Results from the surveys are usually diffused into 3 options – “better”, “same”, or “worse”. The value of the PMI can be calculated in the following manner:
PMI = (P1 * 1) + (P2 * 0.5) + (P3 * 0), where
- P1 represents the number of respondents (as a percentage) who reported improving business conditions,
- P2 represents the number of respondents (as a percentage) who reported no change in business conditions,
- P3 represents the number of respondents (as a percentage) who reported deteriorating business conditions.
The PMI value can range between 0 and 100. A reading of 100 indicates that 100% of respondents in the surveys pointed to improving conditions. A reading of 0 indicates that 100% of responses pointed to deteriorating conditions. A reading of 50 indicates that 100% of responses pointed to no change in conditions.
From the perspective of fundamental analysis, a key PMI reading to watch is 50.0. If the actual PMI value exceeds 50.0, this indicates that the particular segment (manufacturing, construction, or services) is expanding. Since those sectors are expanding, it is very likely that overall economic activity is also expanding. Thus, the PMI is a leading indicator that hints at potential GDP growth levels.
A PMI reading of 42.0 is also closely monitored. In case the PMI tends to remain above that level over time, this indicates that the economy is expanding. Figures between 42.0 and 50.0 actually reflect how robust the expansion is. In case the PMI tends to remain below the 42.0 level over time, this indicates that the economy has entered a period of recession.
Fundamental traders will pay close attention to month-to-month changes in the PMI reading, as they tend to trigger considerable short-term volatility in the forex market. An actual PMI reading that exceeds market consensus will usually support the national currency, and vice versa. Actual PMI readings pointing to less steep contraction in business activity than expected by market players will also support the local currency.
Retail sales and consumer spending
Released by the US Census Bureau on or around the 13th of every month, the report on retail sales presents the dollar value of merchandise sold in the retail trade sector and it is based on a sample of companies of all sizes. This is a timely indicator, as it gauges retail trade performance as well as overall price level activity. In the US, nearly two thirds of the total GDP is accounted for by consumer expenditures.
The report on retail sales is a coincident indicator (reflecting the current state of the nation’s economy). It is also a pre-inflationary indicator that is used to determine the probability of a rate hike or a rate cut by central banks.
A considerable surge in retail sales (well above market expectations) in the middle of the business cycle may indicate rising inflation. As a result, the nation’s central bank may be prompted to raise interest rates in the short term to ease inflationary pressure, which would support the national currency but would lead to a sell-off in local stock and bond markets.
A considerable decline in retail sales (faster than expected by analysts) may indicate suppressed inflation and may even prompt the nation’s central bank to reduce interest rates. This would devalue the national currency.
The Personal Consumption Expenditures Price Index (PCE) is another key fundamental indicator that measures consumer spending on goods and services in the US. This indicator reflects the average increase in prices of durable and non-durable goods and services that individuals, families, and non-profit organizations purchase.
Published by the US Bureau of Economic Analysis every month, the report on the PCE index is based on data from the GDP report. It differs from the CPI report, which uses household surveys as a basis.
As an index, the PCE fundamental indicator has 2012 as a base year and a base value of 100. The PCE index presents current personal consumption in prices today compared to current personal consumption in prices of 2012.
If the PCE price index increases more than expected during a particular period (several months, for example), this may indicate the Federal Reserve’s inflation objective is being approached. As a result, the US Dollar will likely receive support.
And if the PCE price index increases at a slower rate than expected during a particular period, this may indicate suppressed inflationary pressure. Thus, the US Dollar will likely devalue due to lower demand.
The Bureau of Economic Analysis will also publish a core measure of inflation – the core PCE price index, which does not take into account volatile components such as oil, gas, and food prices. This is the inflation measure upon which the Federal Reserve adjusts the target range for the federal funds rate.
Housing market indicators
Housing market reports by the Census Bureau and National Association of Realtors in the United States and the Lloyds Banking Group in the UK provide information about activity in the housing and mortgage sectors.
Some of the key data prints include New Home Sales, Existing Home Sales, and Pending Home Sales in the United States. Indicators of lesser significance include Housing Starts and Building Permits in the US and Canada, as well as the Halifax House Price Index in the UK.
 New home sales – Released by the US Census Bureau near the end of every month, this indicator tracks sales of newly constructed houses. New home sales usually have a significant impact on the forex market, as they could lead to a surge in consumption. This indicator also predicts an economic downturn or expansion as consumers’ personal income is highly sensitive. In case new home sales tend to decrease over a few successive months, this implies an economic depression may be on the horizon, and vice versa. Higher-than-expected sales will usually support the national currency.
 Pending home sales – The index of pending home sales can be used as a precursor of actual home sales, since about 80% of pending home sales become actual home sales within 2 or 3 months. This indicator is more accurate compared to other housing market indicators, as it samples more than 20% of the market. Better-than-anticipated performance of the index will usually support the US Dollar.
 Existing home sales – Released by the National Association of Realtors every month, the report on existing home sales presents sales and values of condos, co-ops, and single-family houses. Existing home sales actually do not cause a real direct effect on the US economy, because there is no economic activity (nothing is produced with the sale). Therefore, this report has a limited impact on the US Dollar, unlike the new home sales data (which is related to considerable economic activity).
Traders will look into the existing home sales numbers, as they suggest where the economy is headed, in general. Owning a house is often considered a sign of wealth and, unlike money wealth that is concentrated in particular regions, housing wealth is equally distributed throughout the country.
 Housing starts, Building permits – Those two indicators tend to induce moderate volatility in the market. The data prints are usually released around the 16th of every month by the Census Bureau of the US Department of Commerce.
Housing Starts present the number of residential units on which the construction process has already been initiated. Building permits are authorizations that allow excavation. Both housing starts and building permits usually surge several months after mortgage rates have been reduced. A higher-than-expected number of starts and permits usually supports the national currency.
 Halifax House Price Index – Published at the end of every month by the Lloyds Banking Group, this indicator reflects the change in real estate prices in the UK. It usually has a more limited effect on forex market volatility.
Economic sentiment indicators
Economic sentiment is usually evaluated with the help of fundamental indicators that determine optimism or pessimism of businesses and households about a country’s or a region’s macroeconomic outlook. Fundamental traders will usually look into economic sentiment data in order to assess the likelihood of higher consumer spending. There are three major indicators of economic sentiment, published every month:
- US Consumer Confidence Index by the Conference Board research group;
- University of Michigan Confidence Index (preliminary and final);
- ZEW Economic Sentiment Index (Euro Area, Switzerland, UK).
Other events affecting the Forex market
Forex is a global and interconnected marketplace, and because of it, events that occur at any location on the globe tend to immediately affect currency exchange rates.
 Political events – Elections are a good example of such events and usually have a substantial effect on the local currency. Most frequently, Foreign Exchange traders will keep an eye on pre-election polls, just to obtain an idea of the potential outcome. In case the current government of a given country is about to be changed, this usually implies new ideology and new fiscal and monetary policies. And those can become a major driving factor behind the local currency’s valuation.
Unexpected elections are another interesting case for traders. Such sudden and unexpected events may be the result of corruption scandals, or a non-confidence vote, or some other situation, and they could potentially trigger chaos in the market.
Also, upheaval among the population of a given country can pose even greater risks. Protests, walk-outs, and more extreme forms of civil unrest could trigger economic uncertainty, loss of credit rating, and more intense political instability. All these circumstances are likely to cause the local currency to considerably depreciate, at least in the short term. In the longer term, such disturbances are likely to ease, while the local currency will probably remain near exchange rates reflecting the country’s GDP growth outlook.
 Natural disasters – Such events could have devastating effects on valuation of national currencies. Floods, tornadoes, earthquakes, hurricanes, volcanic eruptions and so on can severely damage not only the infrastructure of a country, but also its morale, while inducing high volatility in local financial markets.
For example, the earthquakes in Japan and New Zealand led to the depreciation of the yen and the kiwi dollar at first, because of the economic damage they inflicted. Then, both currencies rebounded after the countries received insurance funds from abroad to fund the repairing process. Next, the yen and the kiwi depreciated again due to the actions taken by central banks in both countries. To spur recovery, central banks lowered interest rates and provided additional funding to financial markets.
 Warfare – Wars also have a wide-scale impact on economies. A damaged infrastructure would obstruct short-term economic viability and would cost millions or even billions to restore. And a considerable part of those funds would probably be borrowed. A war-ravaged economy will have to be recovered with low-cost capital, stemming from reduced interest rates. As a result, the national currency will unavoidably devalue.
In times of war, complete uncertainty usually clouds future expectations and daily developments of the situation. And, one can expect the volatility of war-engaged currencies to be much higher than the volatility of currencies not engaged in the confrontation.
Stock market fundamental analysis
When it comes to the stock market, fundamental analysis aims to determine a stock’s intrinsic value through examination of both economic and financial factors. Fundamentalists will usually look into everything that could influence a stock’s value: from macro factors such as conditions in a given industry and overall economic state to microeconomic factors such as management effectiveness.
Fundamental analysts strive to find out if a stock is priced correctly in the market. To do that, they will first examine the overall state of the respective economy, then the state of the particular industry, and after that, they will focus on the performance of the individual company.
Fundamentalists will usually establish a model to determine the particular company’s stock price by using publicly available data. This estimate represents the analysts’ educated opinion about what the company’s stock price should be in comparison with its current market price. This estimated price is usually referred to as the stock’s intrinsic value.
In case analyst estimates point that the stock’s intrinsic value should be well above the current market price, the analyst team may rank the stock as an “Overweight” or as a “Buy”. Investors who follow that analyst team’s research may consider this a recommendation to act. Should analyst estimates point that the stock’s intrinsic value will be well below the current market price, then the stock may be overvalued. Consequently, the analyst team may rank the stock as an “Underweight” or as a “Sell”.
Stocks with favorable recommendations will usually be bought by investors, as those stocks should be more likely to surge over time. And, stocks with unfavorable ratings will be expected to decrease in value over time. Those stocks may potentially be removed from investors’ portfolios (investors will add them as short positions).
A great example of how fundamental analysis has played out in the real stock market was Apple’s stock during the rise of the COVID-19 pandemic. While the general expectation for the tech industry was to slow down during the pandemic outbreak, in April 2020, Apple released an earnings report that surpassed expectations.
Traders and investors who have been using fundamental analysis to keep an eye on the demand, the company’s production, and subscription revenue were able to see Apple’s resistance to the overall tech industry collapse.
On the first day after Apple’s earnings report release, the company’s shares surged 7% and continued to soar throughout 2020. As a result, the Nasdaq 100 index was also experiencing significant highs during the early stages of the global pandemic.
Fundamental factors that relate to the stock market usually belong to two main categories:
 Quantitative factors – all the data that can be presented in numbers and amounts. These fundamentals represent the measurable characteristics of a given company. The biggest source of quantitative data (such as revenue, profit, ROI, ROA, liabilities, etc.) is corporate financial statements;
 Qualitative factors – the nature or standard of conducting business. These factors are not tangible and may relate to the quality of top executives of a company, patents, in-house technology, or how well recognized a particular brand is.
Stock market fundamental analysis will usually consider both categories of factors.
Quantitative Fundamentals
Every publicly traded company discloses its financial performance data in financial statements. The quantitative information these statements contain is used by fundamental analysts and traders to make investment decisions. They will usually pay attention to three key financial statements, such as income statements, balance sheets, and cash flow statements.
First of all, the balance sheet of a company presents its assets, liabilities, and equity at a given point in time. A company’s financial structure balances as follows:
Corporate Assets = Corporate Liabilities + Shareholders’ Equity
Assets include all the resources the company owns or controls at a certain point in time. Cash, inventory, machinery, and real estate are all included here. The other side of the balance reflects the total value of the funding that has been used to purchase the assets. The company can ensure funding through liabilities or equity. Liabilities are actually debt that needs to be paid back, and equity reflects the total value of financial resources the company’s owners have contributed to the business. Profits generated in prior years (retained earnings) are also part of the company’s equity.
Second, unlike the balance sheet, which provides a snapshot of the company’s business, the income statement reflects its performance over a certain period of time (quarter or full year). The income statement provides information regarding the company’s revenue, expenses, and net income resulting from its business operations during the particular period.
Third, the cash flow statement provides a record of cash inflows and cash outflows over a certain stretch of time. Usually, it includes the following cash-related activities:
- Cash from investing – acquisition of assets along with the proceeds from selling other businesses, equipment, or long-term assets;
- Cash from financing – cash the company pays or receives from funds issuing and funds borrowing;
- Operating Cash Flow – cash the company generates as a result of its daily business operations.
It is quite difficult for a company to manipulate its cash situation. While experienced accountants can do anything to manipulate profit, it may be almost impossible to do that with cash in the bank, for example. That is the reason why some traders and investors focusing on fundamental analysis will use a company’s cash flow statement as a more reliable measure of financial performance.
Qualitative Fundamentals
First of all, we have the business model of a company. If we have a business based on sales of fast-food items, for example, we can examine whether the company generates most of its revenue and profit from the sales themselves, or it is simply relying on royalties and franchise fees.
The second qualitative factor type has to do with the nature of the company’s industry. This includes market share among competitors, client base, growth prospects, business cycles, regulation and so on.
The next factor is the company’s competitive advantage. Success in the long term is tightly related to a business entity’s ability to maintain a competitive advantage. Take Coca-Cola’s powerful brand name, for example, or Microsoft’s domination over the PC operating system segment. Such competitive advantages achieved over time establish a “moat” surrounding the business, which keeps industry competitors at bay. If a competitive advantage is achieved, the company’s shareholders will enjoy considerable rewards not just for a few years, but for decades.
Some investors tend to think management is the most essential factor for investing in a given company. The most solid business models will certainly fail if top executives do not manage to properly implement corporate strategies. Retail investors may not have the opportunity to meet and evaluate the company’s management team, but they can always check the corporate website and look through the resumes of top executives and members of the Board. How successful have they been in earlier roles and at former employers? Have they been selling a large part of their stock shares as of late?
Finally, what should be considered is the company’s corporate governance. This comprises all policies that denote responsibilities and relationships between stakeholders, managers, and directors. Investors will always want to do business with a company that operates in a fair, transparent, ethical, and efficient manner. What is important to determine is if managers respect shareholder rights and interests and if their communications to shareholders are always transparent and understandable. If that is not the case, then perhaps the management is trying to conceal some information about the overall financial health of the company or other key areas of its business.
Forex Profit Calculator
Pips: 0
Profit / Loss: 0
Conclusion
To do financial analysis of a given country, or an international industry, or a particular corporate entity, one must dig deep into a variety of factors (economic, social, and political in their nature). And yet, to be able to observe the whole complex and interconnected fundamental picture may prove to be a mighty challenge that requires years of experience. We must say that making investment decisions in different market segments based entirely on fundamental analysis may not always be a successful move. Thus, along with fundamental factors, one needs to be aware of the other possible way to examine market conditions, i.e., technical analysis, and use the strengths of both methods to his/her advantage.
About the Editorial Team